MSCL trade ideas


Morgan Stanley double topPrice finishing the 5th wave within bigger wave 3 at level $50 and forming a double top with RSI divergence.
Selling to level 47 before the next spike to the upside. Break of the neckline for confirmation.
Good Luck!

MS bullish gartley and 2618 combination long!Morgan Stanley had a nice bounce off the gartley pattern, as what we mentioned in the earning preview.
Here we got this double bottom, which can be treated as a confirmation entry of the pattern!
What's more, it's pretty much at the 40.00 fig!
Accordingly, I'm willing to take this long and put my out below 38.5!
Let's see how it goes yo!

$MS Golden Cross In Morgan Stanley Entry level $51.60 = Target price $56.00 = Stop loss $50.00
Multiple buy signals on all time frames but we are highlighting the ultimate buy signal on the daily chart, The Golden cross which is in the process of coming to fruition.
MACD reverses off the zero line on the Monthly chart and has regained middle BB support.
Histogram ticking higher, stochastic and RSI all in bullish trajectory.
Yield 2.87%
P/E 10.4
Company profile
Morgan Stanley provides investment banking products and services to its clients and customers including corporations, governments, financial institutions, and individuals. It operates through the following business segments: Institutional Securities, Wealth Management, and Investment Management. The Institutional Services segment provides financial advisory, capital-raising services, and related financing services on behalf of institutional investors. The Wealth Management segment offers brokerage and investment advisory services covering various types of investments, including equities, options, futures, foreign currencies, precious metals, fixed-income securities, mutual funds, structured products, alternative investments, unit investment trusts, managed futures, separately managed accounts, and mutual fund asset allocation programs. The Investment Management segment provides equity, fixed income, alternative investments, real estate, and merchant banking strategies. The company was founded by Harold Stanley and Henry S. Morgan on September 16, 1935 and is headquartered in New York, NY.

Morgan Stanley updateAfter positive earnings this quarter, seeing the end of wave IV. After the break of the current resistance zone, starting the move up in wave V. A very good opportunity to buy.
Potentially can bounce low first, which would give us a better risk-reward.
Most banks and investment funds target the price for this stock above $50.
Good Luck!

was watching the big short about morgan stanley wanted to see..was watching the big short about morgan stanley wanted to see what their stock price did during the 07-08 crash, how long it took to recover etc.
Very interesting. Once it went public back in early 90s you can see a clear 1-5 wave impulse.
The 5 wave was clearly most extended of all the impulse waves which typically means a retracement to 786, 88, even up to 99% fib.
We went to over 90% fib.
During the dot com bubble you see the abc correction down to 786 fib (not shown). Then
during 07 08 mortgage bond crash you can see a B wave rally that went to 786 fib of the move down in 2000.
finally finishing off the C leg correction 5 waves down to probably over 95% fib. Was very interesting to see prices respect
elliot wave patterns and fib extensions/retracement levels

Morgan Stanley -5th Wave in ProgressMorgan Stanley – In Progress of 5th Motive Wave Competition. Once Completed, we can see the reversal which is Corrective Wave.

Morgan Stanley – Elliott Wave0, 1 & 2 - .618 Retracment
3 Wave - 2.618 High
4 Wave Completed with with .236
5 Wave to be the same size of 0, 1
Projection: 5th Wave and Corrective Wave


Morgan Stanley (MS) - SELLNYSE:MS is a STRONG SELL.
NYSE:MS had a failed 3rd Wave (Didn't travel 100% of Wave 1)
Will update.
-AB


The Key Fib Levels of 0.618 and 0.786 + Volume ProfileHere's a chart that nicely illustrates how the 0.618 and 0.786 levels are frequently used as reversal points by the market.
Price is ping-ponging back and forth between these key levels, and we can also see an almost full Volume Profile (parabolic in shape).
The shape of this VP tells us that all the prices within this given range have been discovered, with the middle areas being the places where the most buying and selling has occurred.
This is a sign of a normal and healthy range.
So, we have the Fib levels working in unison with Volume Profile to paint a picture of a ranging market.


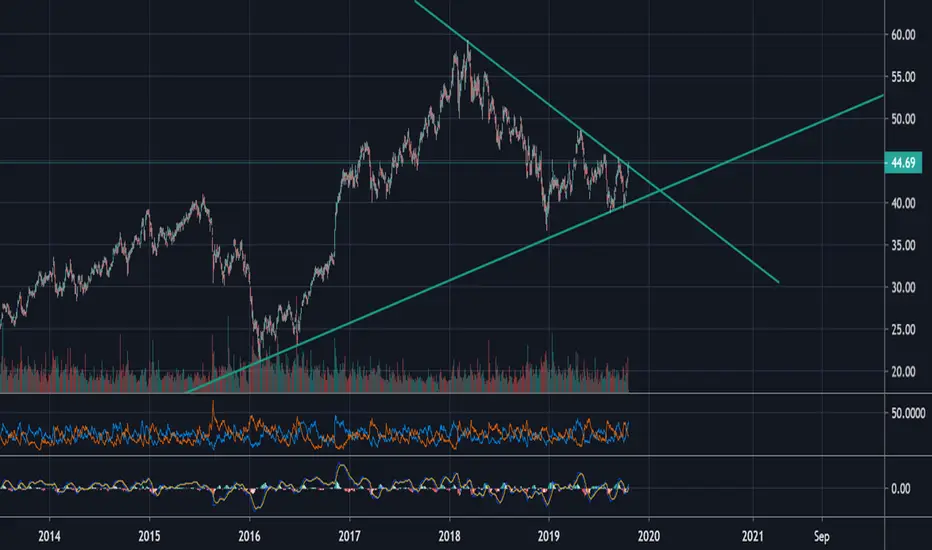
MS recovery hope is still alive as long it remains above 40.30MS - Morgan Stanley share prices breached the resistance trendline to the upside highlighted in red three sessions ago, but was pulled back on Tuesday session. The recovery hope is still alive as long as it remains above 40.30 support level. Share prices fell on Tuesday session and almost touch 40.30 support level before heading back up and closing at around its opening price at 40.99. Share prices were down 1.21%.
