Microsoft Momentum: Riding the Tech WaveLETS GO! It doesn't get simpler than this. Price took liquidity off the lows, then it made a higher low followed by a higher high. What's next? you are right! another higher low followed by a higher high
Entry $415
Target high $460's
Stop $400
MSFTCL trade ideas

Potential long in $MSFT**Scenario:**
The 30-, 50-, and 200-day SMAs have been perfectly aligned for a bullish move for the past few days.
Since the low point in August, the price has been making higher highs and higher lows, indicating a bullish trend.
The seasonality in NASDAQ:MSFT (bullish Q4) is about to begin.
The last bullish wave has already been corrected by 50%, which may be sufficient for the next move.

Microsoft (MSFT) Shares Drop Over 3% This MonthMicrosoft (MSFT) Shares Drop Over 3% This Month
An overview of stock market charts since the beginning of the month reveals that while the Nasdaq 100 index (US Tech 100 mini on FXOpen) is in positive territory, Microsoft (MSFT) shares have underperformed significantly. The opening price on 1st October was $427.47, but by yesterday's close, it had fallen over 3%.
One of the key drivers behind this bearish sentiment is analysis from Oppenheimer, suggesting that Microsoft's financial performance may be negatively impacted by losses related to OpenAI. Additionally, Oppenheimer downgraded Microsoft's stock rating, a concerning sign ahead of the upcoming third-quarter earnings season.
Technical analysis of Microsoft's (MSFT) stock chart shows that the price is hovering around a critical support zone, which is formed by:
→ the lower boundary of an upward channel that has been in place since early 2024 (marked in blue);
→ the psychological level of $400 per share.
What could happen next?
Bullish outlook: Microsoft's (MSFT) share price may reverse upwards from this support zone. Yesterday’s bullish candle indicates a potential increase in demand.
Bearish outlook: The median line of the blue channel has acted as resistance (shown by the arrow). It’s possible that the next level where bears could confirm control is the former support at $425.
Which scenario plays out largely depends on Microsoft's upcoming earnings report, scheduled for 22nd October.
This article represents the opinion of the Companies operating under the FXOpen brand only. It is not to be construed as an offer, solicitation, or recommendation with respect to products and services provided by the Companies operating under the FXOpen brand, nor is it to be considered financial advice.

Have we neglected the US stocks when the limelight is on China ?MSFT is entering into a consolidation phase and the two blue lines are where I would like to accumulate more.
Please DYODD

MSFT ready for takeoffOn the daily timeframe, MSFT has bounced off a bullish fair value gap as well as a bullish breaker block. Also a bounce out the golden pocket.
This is a high probability setup for me.
Targeting 441.85.

Oct 8: MSFT ready to explode to the upsideAug 5 was an important low for tech stocks and many stocks in the market, as shown in the weekly RSI that the drop has corrected the whole rally from 2022.
Since then, MSFT has been going sideways in an ascending channel in two sets of 1-2 waves as shown in the 4 hour chart. This is typical for accumulation or basing before price acceleration in wave 3.
Great buy opportunity here.

Microsoft: Beginning of a Downtrend?
NASDAQ:AAPL
After a prolonged uptrend in Microsoft’s stock that lasted over a year, there are now some technical signals suggesting that this upward momentum might be reversing.
As shown in the image (attached), one of the key indicators of this potential shift is the moving average crossover. The 50-day moving average has crossed below the 200-day moving average. This pattern, often referred to as a “death cross”, is a classic technical sign that a stock may be entering a downtrend.
While this is by no means a guarantee, it’s a signal worth paying attention to, as it typically reflects a change in market sentiment. Combined with other potential indicators, this could be the beginning of a bearish phase for Microsoft.
What are your thoughts? Are we looking at a correction, or is this just a short-term blip?
Disclaimer: This post reflects my personal opinion and analysis. It is not financial advice. I am not responsible for any actions taken by others based on this information. Please do your own research before making any investment decisions.


MSFT: Buy ideaWe have a high probability of seeing the market rise on MSFT over a 1 hour time frame. Indeed, this is explained by the fact that we are in an oversold zone (19.08). You must prepare for a purchase as soon as the vwap indicator breaks.

Possible H&S MSFT Possible H&S here. I'll watch the reaction at the neckline.
Trade with care and good luck everyone!

Microsoft LONG MSFT is looking great to long here, good 4R:R.
There is a 4H rsi bullish divergence right on support this is supporting the bullish idea.
I am targeting the wick fills at
TP1 :420
TP2 :423
LAst TP 425
SL is 4H closure below red support line at 413. after It could wick fill below at 410 but this depends on the overall market.

MSFT basic trend analysisWaiting for a confirmation on this short term uptrend. Once it starts rising from this level, this uptrend will be confirmed. In that case look for a short term target of $450 +

MSFT Setting up for a Long trade**Microsoft Value Correlation to USD and Interest Rates
>We are approaching oversold region for both correlations
**Election Year Seasonality forecast
>Setting up for a Bullish move on October 10
Technical Analysis:
1. Price could reach the highlighted Demand Zone and bounce.
2. Price could also reach the Gap Below the Demand zone. Price Gaps are like magnets because this is a market imbalance.
OTHERS:
>Scalpers can ride the Bearish trend until price reaches Demand Zone
>Long term traders can position for a Long trade at Demand Zone or at the Gap area.
***As always, manage your own trades, trade safe and make sure to do your due diligence when analyzing the charts.***

Microsoft to 450 and then to 520Microsoft is at best risk to reward entry level.
Ultimate target 520
Target: 450

Microsoft Clear Long - Term Elliott Wave PatternSometimes individual stocks can have clear Elliott wave patterns. Since October 2022 Microsoft (MSFT) rallied in a clear Elliott five – wave extended Impulse pattern. The decline from its July 2024 top was impulsive followed by a clear Single Zigzag correction.
A third wave down could now be developing. If so it could break below the August bottom and reach at least a .618 retracement of the 2022 to 2024 rally.

MSFT Topping OutMSFT is topping out at a key area.
Bulls should be taking profits.
Shorts have a great risk/reward setup.

Microsoft (MSFT): Decision Point – Will It Hold or Drop?Since our last analysis on Microsoft, not much has changed in terms of price action, as it rose to $469 before getting stuck again at $416. However, there is one major development – Microsoft has formed a new trend channel. We have marked this crucial channel in red and labeled it "Must hold for more upside," emphasizing its importance. A major decision is approaching for $MSFT.
Either Microsoft holds this channel, leading to a surge higher, or it loses this level, which would confirm the bearish head and shoulder pattern. We've maintained a bearish outlook on Microsoft since January 2024, and recent developments seem to support our analysis. For now, we're patiently waiting and letting the market decide.
If Microsoft loses the channel, we could find initial support for wave (A) around $316-306. However, a better buying opportunity for wave II may present itself closer to $220 – though reaching this level will take some time. 🫡

Greer Zones (Buy and Sell Zones)Greer Zones Indicator
The Greer Zones indicator is designed to identify optimal buy and sell zones based on the Aroon indicator and Fibonacci numbers. It detects key market shifts by calculating the highest and lowest prices over a user-defined period, providing visual cues for when the market enters a potential BuyZone or SellZone.
Key Features:
BuyZone and SellZone Detection: Automatically identifies and labels BuyZones and SellZones on the chart, helping users spot potential entry and exit points.
Fibonacci-Based Calculation: The indicator uses the Fibonacci number 233 for its Aroon calculation, a common ratio in technical analysis, to find reliable trends and reversals.
Visual Zone Marking: The script fills the areas between price levels with distinct colors to clearly visualize when the price is in a BuyZone (red shading) or SellZone (green shading).
Customizable Options: Users can enable or disable zone boxes, customize the size of text labels, and receive alerts when a BuyZone begins or ends.
Midpoint and Price Extremes: Plots the lowest and highest price levels along with the midpoint to offer a complete view of the price behavior during the zones.
This indicator is ideal for long-term traders who want to simplify their decision-making process by identifying key moments when the market enters favorable buying or selling conditions.

Trade Idea: Microsoft Daily Timeframe Rejection at ResistanceI’m watching for Microsoft’s price to return to a key resistance level on the daily chart. If the price reaches this point, I anticipate a potential rejection. This could lead to a reversal or a pullback, providing a possible short opportunity.

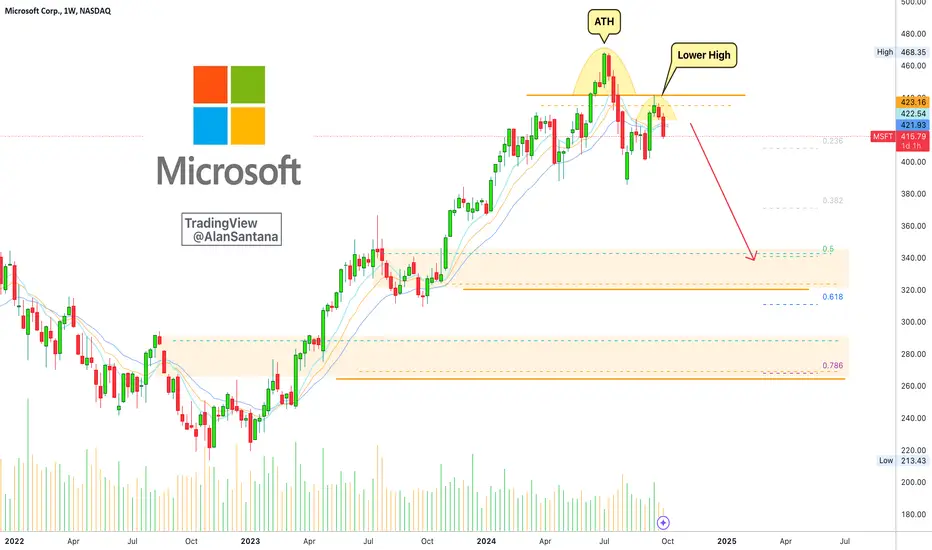
Microsoft Corp. Impending CrashLooking at Microsoft Corp. (MSFT), we have the same dynamic we saw on the Nvidia (NVDA) and Apple, Inc. (AAPL) charts, the lower high.
The All-Time High for this stock came in July 2024. This means that prices have been dropping now for several months. The recent up-move is just a pull-back, a natural market reaction after a major move. The bias is down and new downtrend is being established, we are in bearish territory.
The pull-back produces a lower high and now we have a break below EMA8, EMA13 and EMA21 on the weekly timeframe. Closing below these levels, 421-423, would confirmed the bearish bias. The week closes tomorrow of course.
Trading volume has been dropping since March 2023, a very long time and we have marketwide correlation with this chart. The DXY, which moves in inverse fashion to these stocks, turned ultra-bullish and is growing like there is no tomorrow.
We are about to experience a major correction or crash on this one. Prepare yourself.
The bearish wave can last for months...
Thank you for reading.
Your support is appreciated.
Namaste.
Correction Wave CompleteWe caught the move down and we are now reacting perfective off this zone 0.382 level. Price is very choppy in this zone and has made no lower lows in the lower time frames. Waiting for EMA to line up bullish before we take entry in shorter time frames.
I will be entering a swing position once we have a strong indicator of a reversal.

Microsoft - Its Decision Time Hi Guys,
This chart could be a leading indicator for overall market direction, alongside NASDAQ:NVDA - NVIDIA and $AAPL. So this chart and the other two largest companies in the world Nvidia and Apple are worth paying close attention to, for overall market direction.
▫️ Similar to a the 2019 - 2022 period, the price held the mid term parallel channel with the 200 day SMA acted as underside support. When the 200SMA and the parallel channel was lost in Q1 2023, it led to significant 28%+ decline from these levels (38% from the prior highs of the period).
▫️ We can use the DSS Bressert and the On Balance Volume to help here in distinguishing a likely trend direction.
▫️ This is a very strong chart as it stands. Many traders could step in at the 200 day SMA and bottom of the channel. If the channel is lost, and we have serious reason for concern and could exit on a revisit or test of the underside of the channel (as illustrated with the arrow).
Unless the channel is lost which sync's up with a loss of the 200 day moving average (approx. $410), intermediate trend looks intact for continued upwards trajectory.
Remember, you can check in on this chart and press play to get updated data at any time by clicking the link in the comments below or by following me on TradingView.
PUKA

OpenAI closes historic funding roundOpenAI has closed a $6.6 billion funding round, reaching an impressive valuation of $157 billion. The company, known for its development of ChatGPT, cements its position as one of the world's most valuable private companies.
• Microsoft (NASDAQ: MSFT) and Nvidia (NASDAQ: NVDA) are the lead investors in this round, joined by Thrive Capital, Khosla Ventures and other venture capital players.
Changes to the company's structure
The closing of the financing round coincides with a phase of internal restructuring at OpenAI. The departure of its chief technology officer, Mira Murati, last week marked a key point in this transformation.
• CFO Sarah Friar announced that the company plans to offer employees the opportunity to buy back their shares.
Revenue and growth outlook
OpenAI projects revenues of $3.6 billion in 2024, despite growing losses of more than $5 billion. By 2025, the company expects a significant jump, with revenue forecast at $11.6 billion.
• Thrive Capital has the option to invest an additional $1 billion if OpenAI reaches certain revenue targets.
Participation of major investors and their role
Altimeter Capital, Fidelity and SoftBank (TYO: 9984), along with Abu Dhabi investment firm MGX, also participated in this round, underscoring OpenAI's appeal to large global investors. Although Apple (NASDAQ: AAPL) was in negotiations to participate in the financing, it ultimately decided not to do so.
• The structure of the financing included convertible notes contingent on the successful restructuring into a for-profit organization.
OpenAI's meteoric growth
Since ChatGPT's launch, OpenAI has experienced rapid growth in popularity, attracting more than 250 million weekly active users. Its valuation has increased from $14 billion in 2021 to $157 billion in 2024.
• The company continues to look to develop artificial general intelligence (AGI) as it accelerates its commercialization and pursues profitability.
Conclusion
The $6.6 billion funding round strengthens OpenAI's position as a leader in artificial intelligence, with backing from major investors such as Microsoft (NASDAQ: MSFT) and Nvidia (NASDAQ: NVDA). Despite internal challenges, the company remains focused on growth and moving towards artificial general intelligence (AGI), consolidating its key role in the future of the technology sector.
Ion Jauregui - ActivTrades Analyst
*******************************************************************************************
The information provided does not constitute investment research. The material has not been prepared in accordance with the legal requirements designed to promote the independence of investment research and such should be considered a marketing communication.
All information has been prepared by ActivTrades ("AT"). The information does not contain a record of AT's prices, or an offer of or solicitation for a transaction in any financial instrument. No representation or warranty is given as to the accuracy or completeness of this information.
Any material provided does not have regard to the specific investment objective and financial situation of any person who may receive it. Past performance is not reliable indicator of future performance. AT provides an execution-only service. Consequently, any person acing on the information provided does so at their own risk.
