Great outlook on NVIA reverse HSNVIDIA (NVDA) showing a reverse head and shoulders (H&S) pattern can be a very bullish technical signal — often implying a trend reversal from bearish to bullish.
NVDA trade ideas

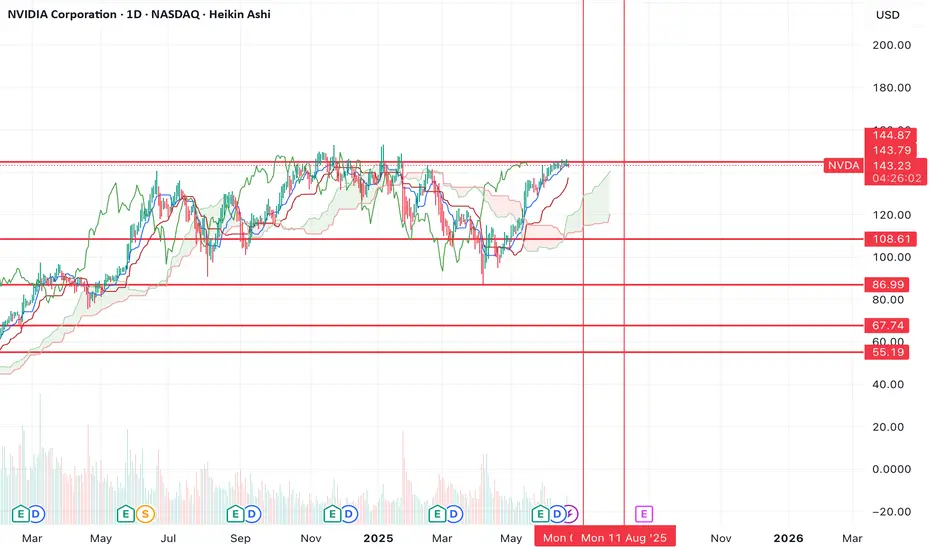
Nvidia & Nasdaq History - What you need to know!Record-high share price: NVDA hit a new all-time high as U.S. stock markets rallied and Wall Street analysts forecast continued upside
Nvidia is pushing towards the first ever $4 Trillion market cap.
Today it surpassed MSFT as the largest company in the world closing up over 4% on the session.
Micron earnings are adding extra fuel to the fire for semi conductors.
Short term picture for semis - they're very extended and need some consolidation.
Micron earnings: Revenue: $8.05 billion, up ~38% YoY, beating the ~$7.89 billion consensus
Data‑center revenue: Tripled YoY, powered by surging demand for high‑bandwidth memory (HBM)
HBM sales: Exceeded $1 billion, growing over 50% sequentially
Strong margin and revenue beat; robust cash flow (~$857 million free cash flow) with a solid balance sheet ($9.6 billion in liquidity)


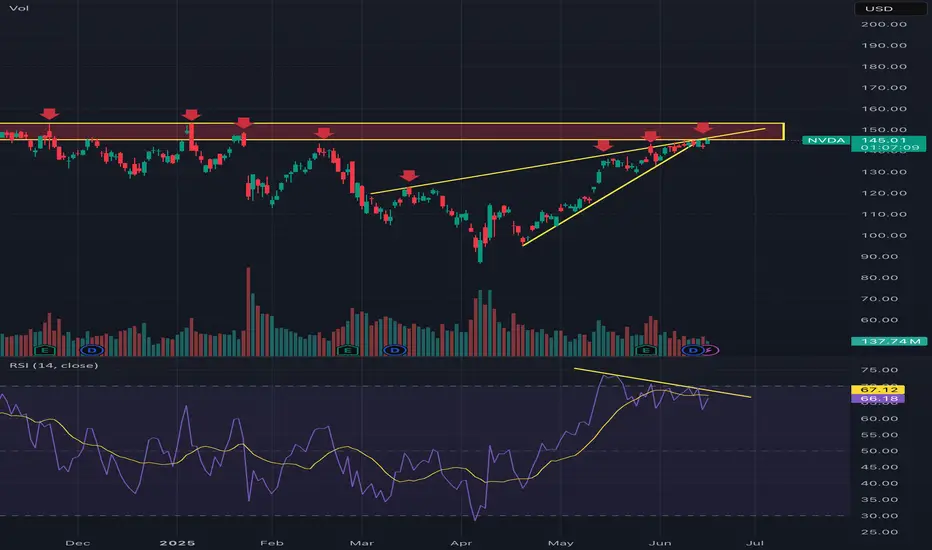
Nvidia into MAJOR resistance This will not be a popular opinion and that’s okay. The charts don’t lie and you can see it is into major resistance, highlighted by all the red arrows when it got rejected. It’s now broken down from a rising wedge which also lines up with said major resistance. I’ve also highlighted bearish RSI divergence, too many factors here for NVDA to keep going up. Could it break through? Of course it could but you have to look at all these factors I’ve highlighted and ask yourself what are the probabilities that it goes down here? High, very high and you want to take trades that put the probabilities in your favor.
NVIDIA – Ending Diagonal Signals Wave 2 Correction Toward $135The intermediate-degree wave 2 may be completing with an ending diagonal structure near $143. This formation typically signals exhaustion in bullish momentum and often marks the end of a fifth wave.
If this diagonal holds and breaks downward, the minimum expected retracement lies around $135. A deeper move toward the $123–125 region is also possible, depending on the development of the correction.
Price currently stands at $143.77. A confirmed break below the diagonal’s lower boundary may trigger the wave 2 pullback.
📈 This analysis is based purely on Elliott Wave structure. No indicators or external tools were used.

Nvidia - 100% new all time highs!Nvidia - NASDAQ:NVDA - is just too bullish now:
(click chart above to see the in depth analysis👆🏻)
Honestly it was not unexpected that Nvidia is now the most valuable company in the world. The chart is just so strong and perfectly following structure; it seems to be just a matter of days until Nvidia will create a new all time high. If this happens, a breakout rally will follow.
Levels to watch: $150
Keep your long term vision!
Philip (BasicTrading)

NVIDIA Corporation More Bullish Than BearishIt has been a while since we looked at Nvidia and here we have a mixed and tricky chart. I will try to make an accurate prediction nonetheless, watch!
It is tricky because the bullish move stalled and found resistance. The candles started to curve and there is little growth. Nothing to worry though. There is no retrace and the action is happening above 0.786 Fib. extension. This means that the action around resistance is likely to result in additional growth. Resistance is being weakened the more it is challenged.
If the bears were going to push prices lower they had their chance but nothing. If they tried, they failed and this is all bullish.
I predict NVDA will continue growing long-term. This goes in accordance with the analyzes I made back in early April of this year. We can expect a new all-time high in the latter part of 2025.
Summary
To me, the bullish bias is now confirmed. A continuation should happen in the coming days or weeks. Growth is expected long long-term.
Namaste.

$NVDA 6/27 exp week; $150 calls. Quick ChartHello. Market is moving up off the “news” of “ceasefire” from Trump. Take what is given I suppose. NASDAQ:NVDA could see a beautiful upside towards the psych level of $150 in just one session (Tuesday, 6/24) which is just a “small” move of 3%. Could break out of its rising wedge. This name has been lackluster as of late (kinda sorta). $150 calls will be entered at open (6/24) and my first target will be $148.98. There are multiple rejections at these levels. Good luck!
WSL

$NVDA has topped, new lows incomingNVDA has now topped, you can see that we've just formed another high time frame lower high and the rejection up here has the potential to create a strong bearish move.
I think it's very likely that the bearish move will take us all the way down to the bottom support before it's completed.
The bounce from the bottom went higher than I initially thought it would (which is why I'm creating a new chart), but price can't escape gravity and the same outcome is inevitable.
Let's see how it plays out over the coming weeks.
Nvidia - Weekly Volatility SnapshotGood Afternoon! Let's talk NASDAQ:NVDA
Last week we saw HV10 (24.96%) increase above HV21 (23.67%) after starting what could be a regression towards HV63 (39.13%). IV (37.37%) entering this week reflects within 6% of it's sliding yearly lows and resonating around quarterly means. This could be showing a fair prediction to the regression potential and a volatility spike.
Here, the RSI has room but is elevated and hinged down with the MACD crossed red -- lagging indicators showing trend reversal. If bi-weekly values can find regression to quarterly; the implied range I would be watching is $135.47 - $148.47 with IV increasing affecting premium positively. If the grind up continues slowly, expect IV to melt and be watching for contracting HV10 ranges between $137.82 - $146.12 -- Keep an eye on the news, it will ever affect the broader markets and any underlying within.
Follow along through the week as we track our volatility prediction -- I will pull the charts back in at the end of the week to review!
CHEERS!

NVDA might want to check this out.Been on a great run... whatever it's holding on to looks like it's about to break. So much negative divergence.

NVIDIA – Best Buy of the Decade (2 Years from now) 🚀💻 NVIDIA – Best Buy of the Decade (2 Years from now) 🔥🧠
Hey everyone! Back in 2021, I called NVIDIA the best buy of the decade, and in 2023, we followed up as NVDA rocketed to my target of $143. Now in 2025, it’s time for Part 3 — and the case for NVDA being a generational play just got even stronger. 💪
✅ On April 4th, I re-entered around $96.85, right at my alert level. The setup? A rounded bottom reversal pattern forming with 4 strong bullish divergences on key indicators (Stoch, CCI, MOM, MFI). Target levels ahead:
📍 $143
📍 $182
📍 $227
📉 Yes, Nvidia took a 6% hit after announcing a $5.5B impact from U.S. export restrictions on its H20 chip to China — a reminder that macro & geopolitical factors still matter. But…
💡 The company just launched DGX Spark and DGX Station, bringing AI supercomputing to the desktop — powered by Grace Blackwell architecture. That’s next-level innovation, not just for enterprises, but for developers, students, and researchers alike. A true desktop AI revolution.
🇺🇸 And most importantly: NVIDIA will now manufacture AI supercomputers on U.S. soil — in Arizona and Texas — aiming to produce $500 billion worth over the next four years. This initiative is a bold move toward supply chain resilience, economic growth, and cementing NVIDIA’s leadership in the AI arms race.
⚠️ If we lose the $96 level, I’ll re-evaluate. But for now? The technical and fundamentals still say: Best Buy of the Decade (2 Years from now we will revisit this chart).
💬 What’s your outlook? Are you buying the dip or waiting on clarity?
One Love,
The FXPROFESSOR 💙

NVIDIA (NVDA) – Ending Diagonal at the Top? 126 Next?NVDA is currently trading inside a potential ending diagonal, often signaling a reversal or strong correction. With multiple Breaks of Structure (BoS) and a visible Fair Value Gap (FVG) left behind, this setup is aligning with Smart Money Concepts.
📉 Bearish Rejection Expected?
Price might sweep liquidity and revisit the 126–129 demand zone, where strong unmitigated orders sit. If this zone holds, a bullish continuation toward 152+ is likely.
🔍 Key Highlights:
⚠️ Ending Diagonal pattern near local top
📊 Multiple BoS confirming internal structure shifts
📉 Unfilled Fair Value Gap (FVG) near 129
🟩 Strong demand zones at 129–126 and 108
🔄 Potential liquidity sweep before reversal
🧠 Smart money footprint visible
📅 Watch for price reaction around 129.8–126.1.
📈 Breakout above 145 with strength may invalidate the drop.

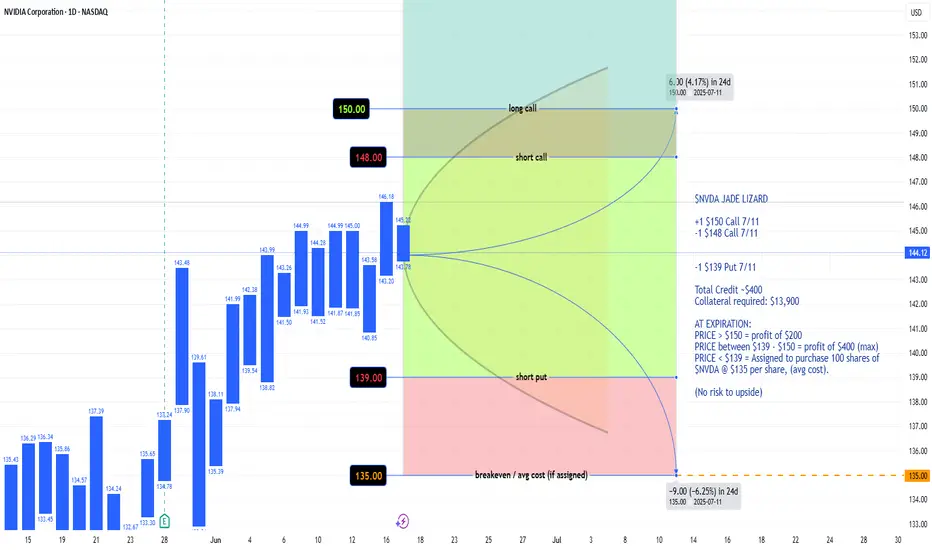
$NVDA JADE LIZARD 7/11 expirationNASDAQ:NVDA JADE LIZARD
+1 $150 Call 7/11
-1 $148 Call 7/11
-1 $139 Put 7/11
Total Credit ~$400
Collateral required: $13,900
AT EXPIRATION:
PRICE > $150 = profit of $200
PRICE between $139 - $150 = profit of $400 (max)
PRICE < $139 = Assigned to purchase 100 shares of NASDAQ:NVDA @ $135 per share, (avg cost).
(No risk to upside)
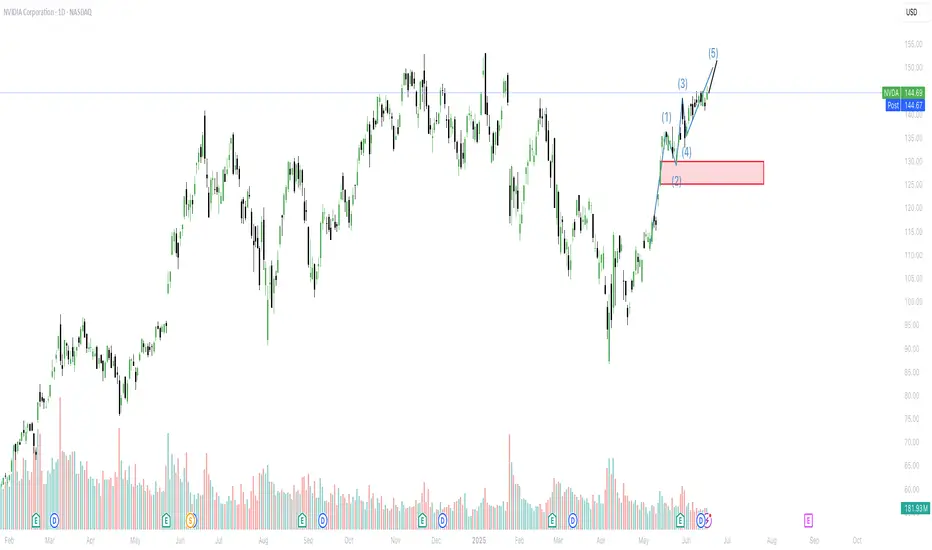
Nvidia (NVDA) Wave 3 Close to ConclusionSince July 4, 2025, Nvidia (NVDA) has been experiencing a robust rally. The rally is unfolding as a five-wave impulse structure according to Elliott Wave analysis. This upward movement began at a low on July 4, 2025, with wave (1) concluding at $115.44. A subsequent pullback in wave (2) found support at $95.04. This sets the stage for the ongoing wave (3), which has developed as another impulsive subdivision.
Within wave (3), the stock advanced in wave 1 to $111.92. A brief dip in wave 2 then followed to $104.08. The momentum resumed in wave 3, pushing the stock to $143.84. Afterwards, a corrective wave 4 settled at $132.92, as observed on the 30-minute chart below. Currently, Nvidia is advancing in wave 5 of (3). This wave has seen wave ((i)) peak at $144, followed by a pullback in wave ((ii)) to $137.88. The stock then surged in wave ((iii)) to $145, with a minor correction in wave ((iv)) completing at $140.46.
Wave ((v)) higher should end soon, concluding wave 5 of (3). Following this, a larger-degree wave (4) correction is expected, potentially unfolding in a 3, 7, or 11-swing pattern. This pullback should precede a final ascent in wave (5), completing the cycle from the July 4, 2025 low.

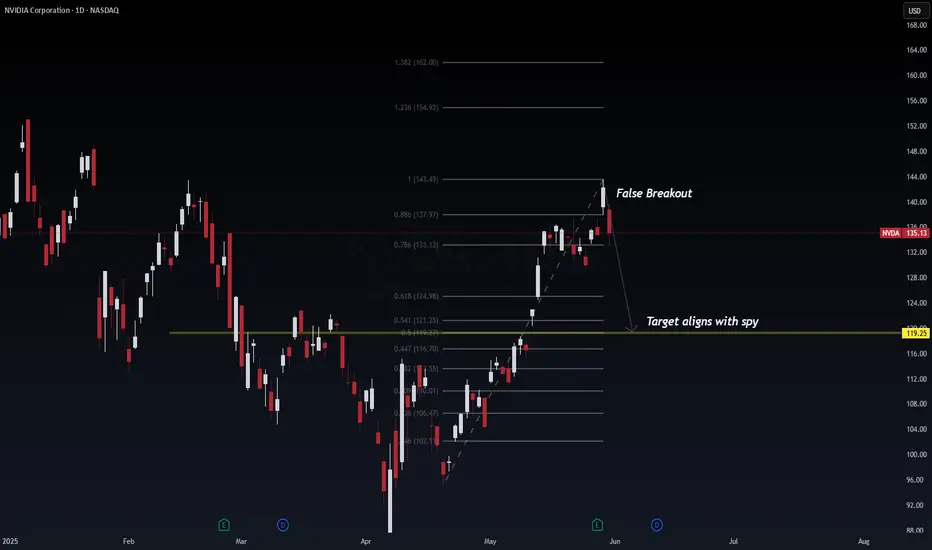
NVDA (NVIDIA) False Breakout and Synchronized Pullback with SPYNVDA printed what appears to be a false breakout at the 1.0 Fib extension level ($143.49), now reversing sharply — potentially aligning with SPY's projected retracement. This presents a high-probability mean reversion setup.
📉 Technical Breakdown
Current Price: $135.13
False Breakout Zone: 1.0 Fib extension ($143.49)
Key Breakdown Zone: 0.786 Fib ($133.12)
Probable Retest Zones:
0.618 Fib: $124.98
0.5 Fib: $121.25
Target: $119.25 (confluence with SPY's demand zone)
🔍 Probabilistic Trade Outlook
⚠️ False breakout + bearish engulfing = 80% probability of continued downside.
📉 Targeting $119.25 = 65% probability as it aligns with institutional levels and SPY’s projected retrace.
💡 Volume and momentum suggest profit-taking and supply absorption.
🌐 Macro Context (May 31, 2025)
AI bubble cooling: Rotation from AI mega caps into broader market value plays.
SPY & NVDA correlation: NVDA typically leads tech-heavy indices — the confluence here could signal broader market pullback.
Fed Policy Uncertainty: No rate cut priced in for June; July will be key.
🧠 Institutional View
This setup echoes the "buy-side trap" — liquidity engineered above previous highs, now reversing to collect resting orders below. This is textbook Smart Money Concepts (SMC) in play.
🧭 Trade Setup
Entry: On confirmed breakdown below 0.786 ($133.12)
Target: $119.25
Stop: $143.60 (above fakeout zone)
Optional Re-entry: Near 0.618 ($124.98) on confirmation
📌 If NVDA hits the $119–121 zone in confluence with SPY’s bounce region, a high-R:R reversal trade may follow.
#NVDA #FibonacciLevels #SmartMoney #LiquiditySweep #TechStocks #MarketReversal #AIStocks #TradingView #WaverVanir
How many times we need to get 1000%+ on this? Here's 3 more...NASDAQ:NVDA
We are currently trading above a significant Fibonacci retracement level of $143. We want to see price consolidate above $145, where we will target $194-$200 next. There are several ways to trade this from here.
* Short-term range from $145 to $150
* Breakout momentum trade over $153 targeting $193
* Long-term range between $103 to $140

NVDA 15mins Short Market Context:
After a corrective decline, NVDA is showing temporary bullish momentum, forming higher lows on the lower timeframes. However, the overall structure remains bearish-biased, and this upside is likely part of a liquidity run rather than a genuine reversal.
Liquidity Magnet at $149
There is resting liquidity above recent highs near $149, a zone where retail buy stops are likely positioned.
Smart Money typically pushes price into such highs to induce late longs and liquidate early shorts before a major move.
Momentum Shift Already in Progress
The current bullish move lacks aggressive expansion — it's showing divergent momentum and weaker impulse candles compared to the prior leg down.
This signals the upside may terminate as a liquidity hunt, not trend continuation.
Structural Setup for the Short
Once price taps $149, observe for a sharp rejection or breakdown of internal short-term structure (i.e., break of a local low with displacement).
This signals the smart money exit and bearish intent.
The shift from engineered buy-side pressure into sell-side delivery confirms short bias.
I expect NVDA to run higher into $149 to sweep liquidity, then break down sharply toward $135. I will look for internal bearish structure to form right after the sweep and will short only upon confirmation of intent (displacement and lower low).

NVDA: Fractal Wave BreakdownBreaking above Rounding Top Pattern after rejections.
Wave transformed from pullback to impulsive one, which implies that the emerging structure needs to be routed to relative cycle.
Waveform
Referral structure looks like compressed version of decline after ATH.
As if the movement of big magnitude that pierces through SL levels, causes "shockwaves" that resets frequency of reversals of forthcoming waves.
Fibonacci interconnection of ATH and Bottom

Expiration Dates for Options using Fibonacci Time ZoneThis is a way I use the Fibonacci Time Zone; it naturally leans into a balance of Gamma and Theta Decay. Choosing the right strike zone is up to your strategy. I prefer Covered Calls, Debit Spreads and Iron Condors for this strategy. Puts are fair game too. If you choose to roll something over, most recoveries occur after a month and a half after a 10% SPY drop off.

NVDA bearish rising wedge for right shoulder (the bear thesis)It looks like we’re just shy of a breakout confirmation this rising wedge which in itself might be only a right shoulder of head and shoulders top. Time will tell if this setup plays out or gets canceled out.

NVDA Swing Trade – Overbought Reversal Setup (June 12, 2025)📉 NVDA Swing Trade – Overbought Reversal Setup (June 12, 2025)
Ticker: NASDAQ:NVDA | Bias: 🔻 Moderately Bearish
Strategy: Short-Term Swing | Timeframe: ~2 weeks
Confidence: 75% | Entry Timing: Market Open
Expiry: June 27, 2025
🔍 Market & Technical Snapshot
• Price: ~$144.67
• Trend: Weekly and M15 uptrend still intact
• RSI (Daily): ~70.63 → Overbought
• MACD: Bearish crossover on Daily
• Options Data:
– Heavy put OI at $140 (14,803 contracts)
– Max pain at $135 → potential pull lower
– High call OI at $145–$150 caps upside
🧠 AI Model Breakdown
🔼 Grok/xAI (Bullish Swing):
• Calls out strong technicals, 5-min momentum
• Suggests $155C for upside play
🔽 DeepSeek (Bearish Swing – Preferred):
• Overbought daily RSI + bearish MACD
• Strong put volume + options market pressure
• Targets pullback to $138–$140 → PUT @ $140
✅ Recommended Trade Setup
🎯 Direction: PUT
📍 Strike: $140
📅 Expiry: 2025-06-27
💵 Entry Price: $2.09
🎯 Profit Target: $3.10 (+48%)
🛑 Stop Loss: $1.25 (–40%)
📈 Confidence: 75%
📏 Size: 1 contract
⏰ Entry Timing: Market Open
⚠️ Risk Considerations
• Weekly chart still bullish → risk of trend continuation
• Low VIX (17.26) = slower option premium movement
• Positive news surprise could cause upside gap
• Use tight risk controls and monitor intraday structure
💭 NASDAQ:NVDA : Extended or just gearing up for another breakout?
📉 Drop your play below — Put buyers vs. breakout chasers 👇
