ORCLCL trade ideas

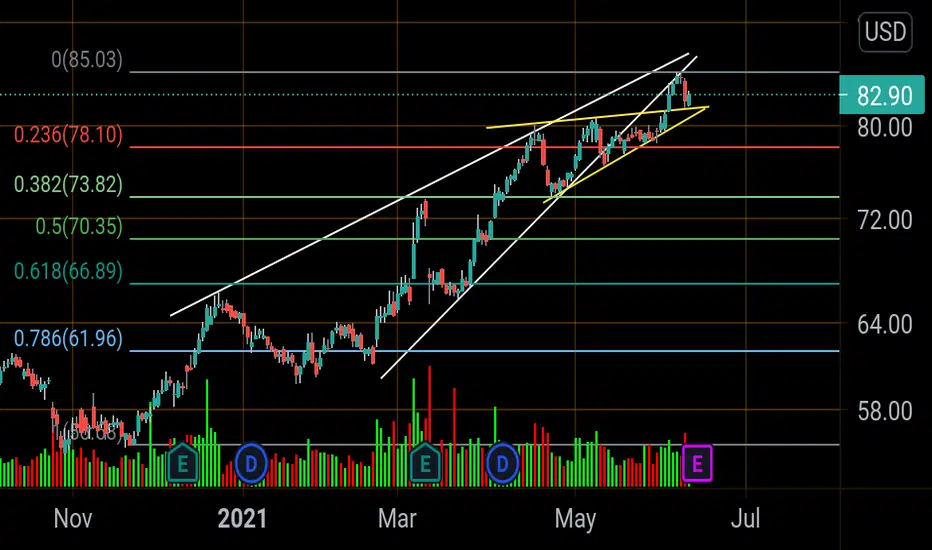
Oracle earnings previewActually fell out of the rising wedge (Whiteline) into a pennant(Yellowline), broke out of the pennant and got rejected trying reentering the wedge. Found support on pennant top.
I would be very surprised to see this stock hit new highs on earnings. Usually when a stock has a massive run up before earnings like this stock did with a 60% gain since 2021 they rank even with a earnings beat. Just look at MSFT earnings aftermath.
I think we'll see a dip back to .5 fibonacci at around 70$ and consolidate.
Let's see.
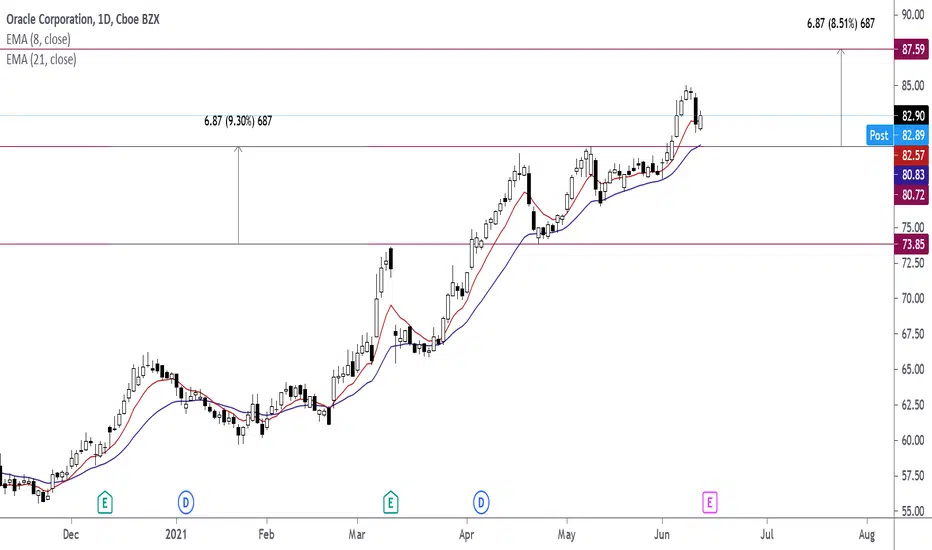


ORCL LONGAnalysis: $ORCL - Oracle is an information technology company and makes all sorts of products and services. Fundamentally ORCL is worth upwards of $170/share when compared to its industry peers. Technically ORCL is finishing a wave 4 correction, and should see a nice bull run again to catch up. Look for a break over $79.50 for your initial long entry, with additions on breakout confirmation over $81.00. Play invalidates under the uptrend line.
Key Levels to Watch
Breakout Level: $32.50
Resistances:
R1: $80.65
R2: $81.00
R3: $84.00
R4: $86.15
Supports:
S1: $78.70
S2: $78.15
Ways to Play:
June 18th calls have the highest open interest as well as Jan 21st of 2022. Look for a strike near or in the money.
Shares are also safe


Oracle Rising wedgeNear term I think we'll see 82.50 then a pullback to 81 before final trip to 85..
took awhile to get a good picture of what was happening here. resistance lines up on my RSI

Repeating itI posted this before as below and sharing it again since we are getting closer to where i need to build a short position.

I am going to short thisOnce it rebounds to $77-$78 range, i will short this for the target of $70.
Stop loss would be the previous high.


Oracle Tops in?Crazy run this stock has had... Overbought on all indicators and its approaching trendline resistance and with weakening vol I don't see it pushing through. Might get another green day and inch up to 77.30 -77.50. Look for the reversal candlestick.
Target is fib yellow line fib extension. 786


ORCL $72 Calls exp. 4/1Liking ORCL here to finish closing gap this week
Volume picking up and RSI heating up
Over 1,000 open interest on 72.00 calls exp 4/1

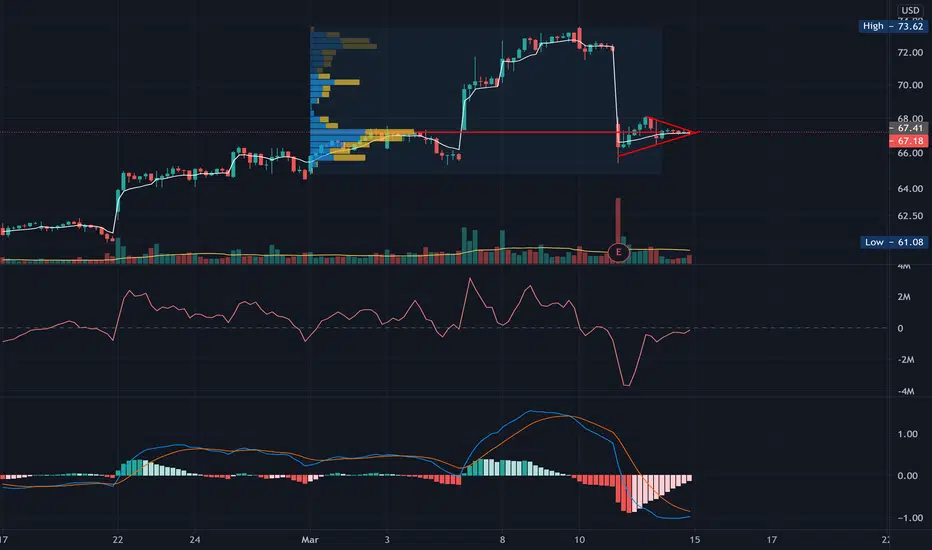
Double bottom to gap close?Completed a inverted H&S today on the 2-4 chart. It's now showing a double pattern. I'm targeting the gap close at 71.53
Yellow line was trendline dating back to 2017 that it broke thru March 5th. Fell back thru after earnings but now has risen back above it

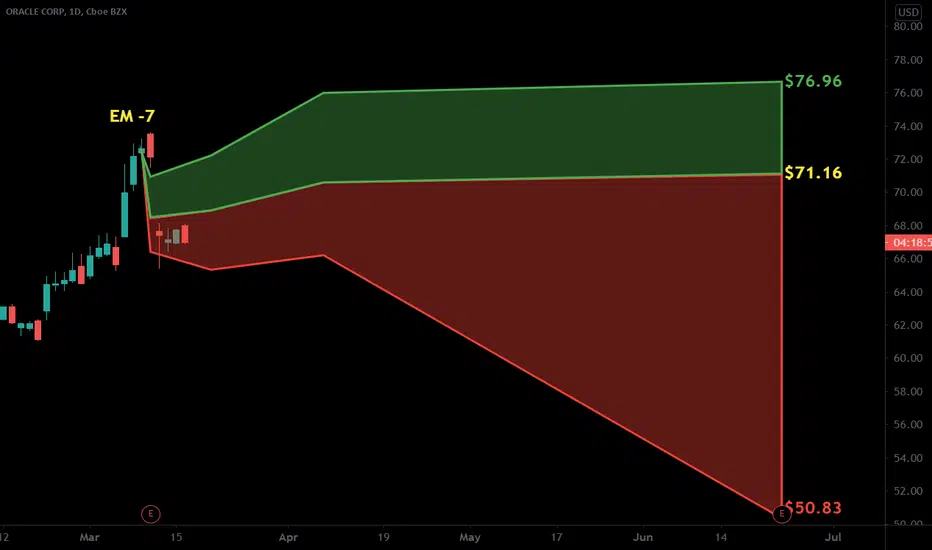
$ORCL with a neutral outlook following its earnings #Stocks The PEAD projected a neutral outlook for $ORCL after a negative under reaction placing the stock in drift D
If you would like to see the Drift for another stock please message us. Also click on the Like Button if this was useful and follow us or join us.
ORCL holding vwapHolding vwap after a big drop, tightening as well. The closing volume on the 15m is also good to see. I'll be looking for a move up if it can hold 64+ area.
ORACLE : PRICE ACTION 1D TIMEFRAME - PRICE READY TO FALL ! 🔔Hello Everyone ! ! I hope you'll Appreciate our Advanced Analysis on Price Action !
Check the Link on BIO and If you LIKE this analysis, Please support our page by hitting the LIKE👍 button
Feel free to request any pair/instrument analysis or ask any questions in the comment section below.
Strategy : BEARISH ABCD PATTERN
Have a Good Take Profits ! ! !


Oracle is strong, when other tech stocks fail!Oracle, which is not a internet company, but IT company with more traditional focus, seems to be very strong the last 1-2 month and not be affected by the weakness of the internet stocks.
Oracle is also profitable and may attract now more investors, so going long is a good idea in my eyes with this stock.

Long ORCL Solid company, lots of customers and low P/E. Many not huge growth potential with new and better competitors, but it is a good value stock to own some!
