Technical Analysis – TSLAChart Summary:
Current Price: ~$349.21
Local Top: ~$357.53 (100% Fib extension)
Bearish Rejection: Notable wick + retrace from 0.886–1.0 zone
Probable Pullback Zone: 343.00–338.50 (Fibonacci 0.618–0.5 retracement)
Major Support Levels:
$334.50 – Prior key horizontal + Fib confluence
$311.62 – Historical demand zone
Projection:
Intraday double-leg correction toward $338–$343
Possible bounce and continuation toward the golden target zone:
$366.47 (1.236 Fib)
$374.16–$380.95 (1.618 zone)
🌍 Macro Alignment
Bullish backdrop:
Tech sector leading broader rally
Tesla’s robotaxi and AI narrative lifting sentiment
Oil down → margin relief for EV production
Catalysts this week: Powell testimony, PCE inflation
📈 Trading Plan
Type Direction Entry Target(s) Stop Loss Confidence
Intraday Bearish $352–$353 rejection zone $343 → $338.5 Above $357.5 🔶 Medium
Swing (Buy the dip) Bullish $338–$334 zone $366.47 → $374.16 Below $330 🟢 Strong
📌 Suggested Strategy
Scalp short if rejection at $353.2–$357.5 confirms with bearish candle on volume.
Add long exposure if price consolidates or reverses from the $338–$334.5 support area.
Monitor Powell’s remarks – Any dovish tilt could accelerate tech upside.
TSLA sentiment remains strong, but intraday shakeouts are expected.
✍️ Summary Signal
“TSLA remains bullish on a swing basis, but intraday looks set for a Fibonacci pullback to $338–$334. Buy dips if structure holds. Macro backdrop (robotaxi + Fed pause) supports continuation to $366–$374.”
TSLA trade ideas

TESLA CORRECTION ON THE WAY? + MY WATCHLIST FOR JULY 2025In this video, I run through a couple stocks that look very interesting going into Q3 2025, all stocks listed below!
NASDAQ:TSLA
NASDAQ:CELH
NYSE:EL
NYSE:NKE
NASDAQ:SOFI
AMEX:SPY
NASDAQ:QQQ
NASDAQ:AMD
NASDAQ:CAKE


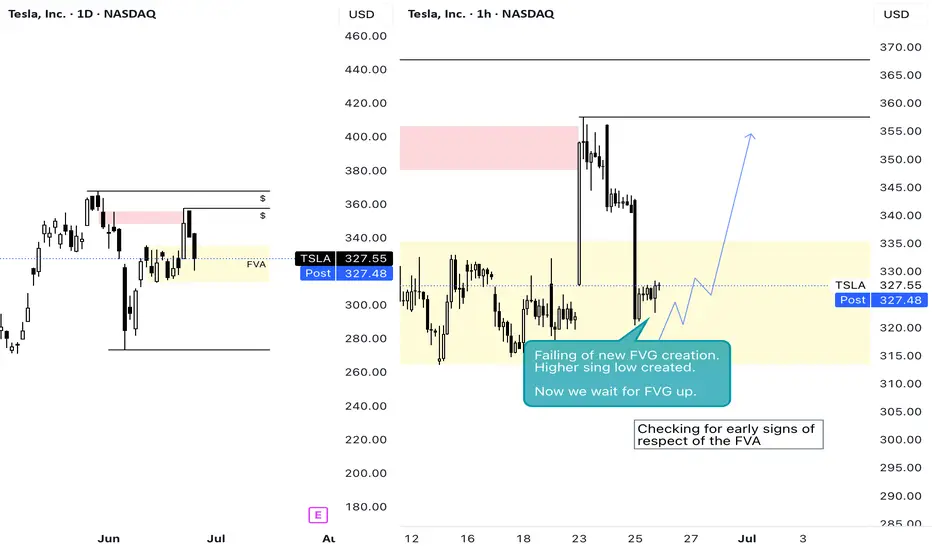
AoO Series No.3Wed - Monitoring the FVA reaction. The last swing high on the D is the last line of defence of the bearish FVG. If we run that high, there is no resistance left and we enter an area of opportunity.
Monitoring on the 4H and 1H early signs of respect of the FVA.
V-Bottom + Apocalypse news => Going UpV bottom was formed.
News are clearly bearish in a conclusive way =>> fool the public to sell shares to the big fish while the market will go up...
Overall market sentiment under the hood is bullish. Public is in huge fear of banks that collapsed and will continue to collapse, so the masses will sell stocks on an up wave fearing it will go down.
How else you will make the mass public sell their stocks? if there is no apocalypse on the way...? think about it...

Tesla update, watch 343 level!boost and follow for more ❤️🔥 tsla broke the trend support mentioned in my last analysis, doesn't surprise me too much I did mention it was likely, now look for a daily close above 343, if we can get that then the rally to and past 400+ will come in the blink of an eye 🎯👁️
that is all, I am done posting for today.. I hope you all have a great weekend! stay safe and see you soon ⚡✌️

Safe Entry Zone TeslaGreen Zone is Safe Entry Zone.
Target is Take Profit line.
Note: 1- Potentional of Strong Buying Zone:
We have two scenarios must happen at The Mentioned Zone:
Scenarios One: strong buying volume with reversal Candle.
Scenarios Two: Fake Break-Out of The Buying Zone.
Both indicate buyers stepping in strongly. NEVER Join in unless one showed up.
2- How to Buy Stock:
On 15M TF when Marubozu Candle show up which indicate strong buyers stepping-in.
Buy on 0.5 Fibo Level of the Marubozu Candle, because price will always and always re-test the imbalance.

TSLA : Up trend is becoming weakNASDAQ:TSLA is in Up trend. But the uptrend is becoming weak. Bullish momentum may become weak here. It has pull backed from the down trend line. So It may enter in sideways trend. Down trend line may act as resistance and up trend line may act as support.

TESLA falling down to 250 USD?Tesla is consolidating in a tight range, showing bearish pressure near the lower boundary of the formation. Moving averages (MA 5/10/30/60) are flattening, indicating a loss of bullish momentum, while the Wavetrend oscillator has issued a sell signal (bearish crossover below the zero line). A downside breakout from this range projects a potential move toward the $250 level, as illustrated by the measured move. This bearish scenario gains validity if price breaks below the $315 support level.
Possible TP: 250 USD

Will the Robotaxi euphoria continue to push TSLA higher?NASDAQ:TSLA pushing higher the last few days thanks to the start robotaxis. Will this rally continue? the answer is yes until the LIS gets broken.
LIS is at 311, any break below will give a retrace. If you are long, get out and get back in when the next LIS gets broken on the upside. This is efficient investing. Don't waste time doing HODL.
LIS is evolving over time, I will keep you updated on it.
This is really simple trading based on important levels. Keep following my post, so you can see it by yourself.

TSLA: GEX Points to Bounce Setup. Is This the Dip to Load Calls?📊 GEX-Based Options Suggestion
Gamma Exposure (GEX) data paints a bullish opportunity if TSLA holds the critical support zones:
* ✅ Key GEX Levels:
* $338: Near current price, minor GEX flip zone.
* $345–$350: Strong upward magnets (3rd Call Wall + GEX build-up).
* $359: Gamma Wall + Highest Net Positive GEX — market makers may pin price near this into end of week if bulls hold.
* 🛡️ Below Support:
* $330: Light PUT defense.
* $320: Major Put Support (-67.5%) — strong bounce zone if downside accelerates.
🔔 Option Trade Idea Based on GEX:
With TSLA near the $338 zone and GEX showing stacked resistance above + positive net exposure, a high-risk/reward call entry is forming.
* Play: Buy 345C or 350C expiring 06/28 or 07/05
* Trigger: Only if price holds $335+ and shows strength with volume bounce
* Target: $345 → $350 → potential pin near $359 (Gamma Wall)
* Stop: Close under $332 invalidates the bounce setup
🧠 Trading Setup – 1H Chart (Second Image)
From the second image, we analyze price action and structure to validate the GEX idea:
📉 Market Structure:
* Price is pulling back into a prior demand zone from $335–$338.
* Trendline support + Fair Value Gap zone + SMC CHoCH aligning at this base.
* Multiple bullish CHoCHs suggest potential reaccumulation if support holds.
🎯 Trading Plan Based on Price Action:
Bullish Case (Base Holds):
* Entry: $335–$338 zone (bounce off trendline and demand zone)
* Target: $345 (GEX level) → $348 → $350
* Stop-Loss: $331
High confluence with GEX option play. Use volume spike for confirmation.
Bearish Breakdown Scenario:
* Trigger: Loss of $331 + trendline break
* Target: $325 → $320 (strong PUT wall support)
* Put Options: 325P or 320P if breakdown triggers with momentum
⚠️ Summary:
TSLA is entering a decision zone — GEX shows bullish opportunity if $335 support holds, with upside targets toward $350–$359. But if price breaks under $330, expect a flush toward PUT support.
Patience is key — let price confirm the bounce or the break.
This setup is for educational purposes only. Trade with discipline and use stops. Always do your own research.

Tesla -> The all time high breakout!🚗Tesla ( NASDAQ:TSLA ) prepares a major breakout:
🔎Analysis summary:
Not long ago Tesla perfectly retested the major support trendline of the ascending triangle pattern. So far we witnessed a nice rejection of about +50%, following the overall uptrend. There is actually a quite high chance that Tesla will eventually create a new all time high breakout.
📝Levels to watch:
$400
🙏🏻#LONGTERMVISION
Philip - Swing Trader

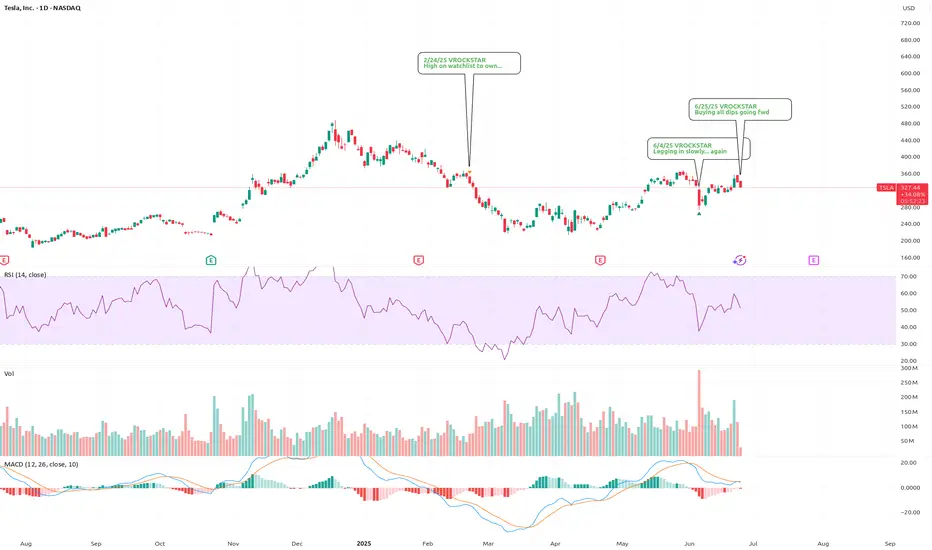
6/25/25 - $tsla - Buying all dips going fwd6/25/25 :: VROCKSTAR :: NASDAQ:TSLA
Buying all dips going fwd
- "successful robotaxi or not successful robotaxi"
- elon's clearly won the vision game
- scaling hardware (cars, infra, optimus, solar) is m-o-a-t
- so is a humanoid and robotaxi robotics company that doesn't burn cash worth a trilly in today's world if the upside is perhaps 5-10 tn in the coming decade (worst case) and your downside here is what? 30... 40... 50%? Is it more? unlikely.
- so "yes" we remain entering consumer recessy. yes "tsla" shares r not cheap. and that's for a reason.
- buy scarce paper.
- buying all dips here.
- i like the dec '27 deep ITM leaps. allows me to wrangle size with a bit more flexibility in the coming months.
- but this rocketship has yet to make any meaningful moves.
- $1,000/shr is the 2Y tgt.
V
Tesla, Inc. (TSLA) Boosted by Energy StorageTesla, Inc. (TSLA) is a global leader in electric vehicles, clean energy solutions, and battery technology. The company designs and manufactures EVs, solar products, and energy storage systems that help drive the transition to sustainable energy. Tesla’s growth is fueled by rising EV adoption, battery innovations, and expansion into new markets with its cutting-edge technologies.
On the chart, a confirmation bar with increasing volume signals strong buying interest. The price has moved into the momentum zone by breaking above the .236 Fibonacci level. A trailing stop can be set just below this level using the Fibonacci snap tool to protect gains as momentum continues.

Key Support at $313.3 Holds Potential for TSLA UpsideTesla tested the order block with an average price of $325.00 in yesterday's trading session. The critical support for TSLA is at $313.3, and if this level holds, the price can target $367.71.

TSLA (daytrading) break out and retest1. Still watching here (down trend is too strong)
We can see break out patterm
2. And came back to restest. But i worry about that tsla usually doesnt restest like that.
3. Hit sma 200 h1

Tesla-Heading For A New ATH?NASDAQ:TSLA is looking good!
Robo-Taxi, Optimus Robots...and so more to come!
Tesla to $692 in the next years? Or months?
#stocks #tesla #stockmarket

Quick View: $TSLA
- Bullish Box on the daily chart supported by the ema50d and strong ema 21d and 9d. No volume on this box.
- Almost the same pattern on the hourly

$TSLA The Magnificent PennyWelcome to a comprehensive analysis of the little Penny Stock that could..
NASDAQ:TSLA is at it again, ripping shorts and trapping longs. Business as usual.
NASDAQ:TSLA operates primarily from one chart being the Hourly. All signals giveth and all Signal taketh away from this chart.
At present we are seeing a distinctive weakness creeping into the hourly chart which is presently in a distribution pattern making lower lows on it's consolidation. The trend is just starting to turn bearish and as you can see from our dynamic support and resistance levels, our first stop after already retesting resistance is a fill of the box at 316.14
Once this box is broken we can expect to fill the lower gap at 291.85 being a weekly support target.
Finally if a run back to the 265.13 Monthly target would complete the Market Maker discount to grab stock and push it higher from here.
All things being equal, NASDAQ:TSLA is a great short in the mid-term with both CCI and MA angle breaking to the downside.

TESLA: Can double its price ($640) by the end of the year.Tesla is neutral on its 1D technical outlook (RSI = 51.064, MACD = 4.910, ADX = 24.971), consolidating for the past week, but remains over its 1D MA50 and 1D MA200 nonetheless. Since the major market bottom on January 6th 2023, it's been trading inside a Channel Up and this is its 3rd bullish wave. The 2 prior rose by +196.67% from the bottom of the pattern (despite the 2nd breaking marginally under it). Consequently, this suggests that Tesla can rise by +100% from the current $320 level, before the Channel Up tops (HH) again. We are bullish, TP = 640.
See how our prior idea has worked out:
## If you like our free content follow our profile to get more daily ideas. ##
## Comments and likes are greatly appreciated. ##

TSLA: Triangle PatternResearching the market through structural lens, particularly the topology of trapped liquidity buildup and compression of volatility, that leads to a proportionally heavier move once a breakout occurs.
Raw compression area derived from waves of higher degrees (2nd, 3rd)
The longer price consolidates within boundaries of a triangular formation, the more significant the breakout tends to be.

TSLA – Long Trade Analysis (30-min chart)!📈
🟢 Chart Pattern: Symmetrical Triangle Breakout
Price is breaking out of a tight triangle, indicating potential momentum buildup. Volume spike confirmation would strengthen the move.
🛒 Entry: Around $322.05 (breakout zone)
🎯 Target Levels (Upside):
TP1: $327.38 (minor resistance)
TP2: $333.72
TP3: $339.71 (strong resistance zone from early June)
🛑 Stop-Loss:
Below $317.30 (triangle base support and recent consolidation low)
This gives a risk/reward ratio of approx. 1:2.5, which is solid.
🧠 Why This Setup Makes Sense:
TSLA is moving ahead of the June 22 robotaxi event
Strong support trendline from June 6
Breakout is aligning with bullish sentiment and upcoming catalyst
Market is bullish overall, helping large-cap tech
⚠️ What to Watch:
Watch for fake breakouts — wait for candle close or volume confirmation
Be ready for volatility as event news can cause whipsaw action
Option traders: Consider bull call spreads if IV is high

Tesla: Robotaxi Hype and Breakout WatchNASDAQ:TSLA surged nearly +10% today, driven by growing anticipation around the upcoming robotaxi unveiling on August 8.
Investors are positioning early, speculating this innovation could open new revenue streams for Tesla and redefine mobility.
📊 Technical Setup:
• Price broke out of local resistance near $330
• Approaching major resistance at $370–371 (Bollinger Band + prior support)
• If $370 is broken and held, the stock could enter a new trading range: $370–$440
• RSI and Stochastic are heating up, but no signs of reversal yet
⚙️ Robotaxi Catalyst:
• Elon Musk confirmed the Robotaxi event set for August 8
• Analysts speculate this could boost valuation through AI and self-driving revenue potential
• Option volume and retail interest are rising fast
📌 Levels to watch:
• Breakout level: $370
• Target: $440
• Support zone: $330
• Invalidation: Close below $310
👀 Watch for pre-event momentum. A break above $370 could trigger a squeeze.
