TESLA / TSLA: Key Support Holding, Breakout Ahead?On the Tesla chart, we are still tracking a third wave to the upside, which could be in the making from the April 2024 low.
The rally into the swing high from December 2024, where the price topped around $490, has so far unfolded as a three-wave move. In the primary scenario, I am tracking this as wave A in the white scenario, meaning it is wave A of the larger degree third wave to the upside.
Why is wave three forming as an ABC structure? It ties into the broader pattern, where the third wave is part of a larger degree diagonal. In a diagonal, the waves within waves one, two, three, four, and five are all corrective, meaning we expect a three-wave move in wave three as well.
After wave A topped in December 2024, a pullback began, and the price has now landed in the standard support area for a B wave. However, there is no confirmed low in place yet. For an early indication that a low is in, we would need a break above $279.80 (the green line). Until that happens, further downside cannot be ruled out.
If the price starts to rally over the next few weeks, we could see a test of the $350 to $379 range, with standard resistance extending up to $454.
That being said, I find it increasingly likely that the entire decline could be all of wave B, as per the blue scenario, due to the depth of the pullback. This makes the yellow scenario (where this decline was just a wave 4) less likely, reinforcing the idea that we are still following the white scenario in which the correction is deeper but remains part of a larger bullish structure.
For now, the focus remains on whether Tesla can establish a reversal signal from the current support zone, with $279.80 as the key level to watch for an early breakout confirmation.
TSLA trade ideas

Omnichart presents - TSLA - long term trendsay what you will but what I see here is a long term trend intact. In a 3 month chart I see TSLA is in a squeeze, once released take the trade. If the squeeze is with Up momentum, scale or deploy in to the position. You can also buy a put at or near the current levels as indicated by the current fibonacci support line and also sell a near term put at the below fibonacci support level. If expires worthless keep selling a shorter term put to raise money - this might give you additional income which may pay off the long term (LEAP) put you bought near the current price.

TSLA interesting zoneTSLA is currently at a possible support zone but it will certainly have a hard time holding here if the markets aren't going to bounce as well.

TSLA Tesla off Gamma PositioningMenthor Q Levels makes us money again. Long off the 1DMin intraday Gex models, was able to catch a fantastic long midday to close off the 252 Put Gamma Level.

Tesla Impulse Wave DownRecent action of TSLA appears to be an Elliott Impulse wave. If so, this could mean more downside action. The most likely first downside target is in the 185 area. So far daily RSI is only marginally into the oversold zone. Please note the extremes RSI reached before a turn happened. MACD has only a small bullish divergence which also implies more downside action.
TSLA has moved below its 200 – day Simple Moving Average (SMA). If there’s a rally up to or just above the 200 – day SMA it could be just a correction within a larger decline.
If there’s a drop after hitting or briefly moving above the 200 – day line it could the beginning of another down move.

TSLA SELLING PRESSURE MAY REDUCE AS SHARE PRICE DIPS INTO SUPPORTesla’s support level between 200 and 260 may act as a buffer to hold the share price amid ongoing selling pressure. Will there be rejections on TSLA in coming week(s)?
N.B!
- TSLA price might not follow the drawn lines . Actual price movements may likely differ from the forecast.
- Let emotions and sentiments work for you
- ALWAYS Use Proper Risk Management In Your Trades
#tsla
#nasdaq
#nyse

Tesla (TSLA) – A Familiar Pattern Emerging?
Tesla (TSLA) – A Familiar Pattern Emerging?
The broader market has been undeniably volatile, but in times like these, I always come back to one of my favorite trading mantras: “When in doubt, zoom out.”
Looking at Tesla’s 4-hour chart, a compelling setup is unfolding. We can observe a repeating cyclical pattern forming, with what appears to be the third phase of this sequence now on the horizon. Notably, RSI is at oversold levels, historically signaling potential reversals in Tesla’s price action.
One key takeaway: TSLA has shown a tendency to break out aggressively from similar conditions in the past—especially when accompanied by a catalyst. Whether it’s a fundamental news event or a technical breakout, this could be the moment where the stock makes a decisive move.
A key level to watch? A breakout above could confirm momentum, while holding may be crucial for bulls.
⚠️ As always, this is NOT financial advice—just my own observations and analysis.
Good luck and trade smart!

TSLA Multi Timeframe analysesTSLA Charts showing confluence at the $261 level. There are multiple support lines & 50MA converging on weekly & Daily, along with 50MA on weekly.
Volume is higher at trendline touches.
200MA right under the level.

TSLA’s Failed Breakout: Reversal or Deeper Drop Ahead?Tesla (TSLA) Market Outlook & Long-Term Investment Report
Tesla (TSLA) has positioned itself as more than just an electric vehicle (EV) manufacturer. With its advancements in robotics, artificial intelligence (AI), autonomous driving, and energy solutions, Tesla is becoming a major player in multiple high-growth industries. While recent price action has shown volatility, long-term investors see buying opportunities at key support levels.
Technical Analysis & Key Levels
1. High-Timeframe Context (HTF)
- HTF Resistance: $415.71 – Tesla attempted to break above this level but faced rejection, leading to a sharp pullback.
- Major Support & Resistance Zone – A critical level where Tesla has previously consolidated and reacted strongly.
- Liquidity Zones (LQZs):
- Daily LQZ (~$238.18) – A key demand area where buyers could step in.
- Weekly LQZ (~$182.44 - $108.01) – A deeper liquidity zone, potentially offering even better long-term buying opportunities if the downtrend continues.
2. Market Structure & Trend Analysis
- **Failed Breakout:** Price action showed a breakout above resistance, but the failure to hold led to a sharp reversal, indicating a potential liquidity grab.
- **Retest of Support:** The price is currently testing a significant support level, which will determine the next move.
- **Momentum Shift:** The aggressive rejection at HTF resistance suggests sellers are in control in the short term, but this creates long-term entry opportunities.
Long-Term Investment Thesis
Tesla's expansion into AI, robotics, and autonomous technology presents significant long-term growth potential beyond its traditional automotive business. Here are the key areas driving Tesla's future:
1. Robotics & Artificial Intelligence
- **Tesla Optimus Robot:** Tesla’s humanoid robot project is expected to revolutionize industrial automation. It could become a major revenue source as industries move toward AI-driven labor solutions.
- **Neural Networks & AI Advancements:** Tesla’s AI systems, used for Full Self-Driving (FSD), are also being adapted for robotics, increasing its competitive edge.
2. Energy & Infrastructure Expansion
- **Solar & Energy Storage:** Tesla’s **Megapack** and **Powerwall** businesses are growing as renewable energy adoption accelerates.
- **Grid-Scale Energy Solutions:** Tesla’s energy division could play a crucial role in stabilizing power grids worldwide, providing another strong revenue stream.
3. Autonomous Vehicles & FSD
- Tesla’s **Full Self-Driving (FSD)** software could create a high-margin subscription-based revenue model.
- The potential for a **Tesla Robotaxi network** could disrupt the ride-sharing industry and unlock new business models.
4. Synergies with SpaceX & AI Computing
- Tesla benefits indirectly from advancements in **SpaceX** technologies, such as materials science and AI computing.
- The **Dojo supercomputer** is being developed to enhance AI training, which could accelerate Tesla’s robotics and self-driving ambitions.
Investment Strategy & Accumulation Plan
For long-term investors, Tesla's volatility provides attractive buying opportunities. A strategic approach would involve:
1. Key Accumulation Levels
- **Daily LQZ (~$238)** – A strong support zone where Tesla could see renewed buying interest.
- **Weekly LQZ (~$182-$108)** – A deeper level that may offer excellent long-term value if the price declines further.
2. Dollar-Cost Averaging (DCA) Strategy
- Instead of trying to time the absolute bottom, investors can **ladder buy-ins** at different liquidity zones to optimize their cost basis.
- This reduces risk and takes advantage of market dips without excessive exposure.
3. Risk Management & Long-Term Horizon
- Tesla is known for its volatility; maintaining **a long-term vision (5+ years)** is crucial for maximizing gains.
- Investors should be prepared for short-term fluctuations while focusing on Tesla’s multi-industry expansion.
Conclusion
Tesla’s failed breakout and recent pullback present a strategic buying opportunity for long-term investors. With its advancements in robotics, AI, energy, and autonomous technology, Tesla is well-positioned to be a key player in multiple trillion-dollar industries over the next decade. The current price action suggests that accumulation at liquidity zones could provide strong long-term returns.
As the robotics industry grows, Tesla’s potential as a leading producer for industrial automation is increasingly clear. Investors with a bullish long-term outlook may find current and upcoming dips as prime entry points.
Final Thought
**Is Tesla’s current dip a gift for long-term believers?** With its expanding technological footprint, this may be an opportunity to accumulate before the next major growth cycle. 🚀

The Ultimate Golden Zone to Close Shorts and flip Long TESLA Must Watch Analysis on TSLA revealing the ultimate golden zone to fill your Longs and close your shorts.
In this video I pinpoint a high probability zone of where to take the next long .
I have used a suite of Fibonacci tools to include TR Pocket , Trend based fib, pitch fan , 0.618, VWAP and volume profile to determine the best Long.

TSLA eyes on $253.57: Golden Genesis fib that bulls MUST-HOLD TSLA has been crashing since inauguration and Musk activity.
The retrace has just hit a Golden Genesis fib at $253.57
It is reinforced by confluence of a Covid fib at $248.05
Previous Analysis that gave many scalp entries:
============================================================
.

Two Dips I'm Watching After The CrashThe market took a beating over the last two weeks or so. Everything except for a few defensive sectors was hit hard. After all the selling, I am looking around and asking: where are some dip buys? I've come up with a list of a few names, but for this chart specifically, I have zoned in on two different companies of industry and size: TSLA and FIVN.
I'll start with Tesla (TSLA):
They are down just over 47% from their recent highs. This all transpired over the course of a few months, but it really accelerated over the last few days. I find this drop to be rather remarkable considering Tesla's latest products and upcoming releases. Nevertheless, this comes with challenges, including sales in a country like China and other fundamental factors. Tracking their cash flows and progress toward operational efficiencies is crucial.
Tesla is down 45% in this correction—nearly half of its value gone.
I have never owned NASDAQ:TSLA long-term. I have surely traded and covered it, especially when it first broke out during its epic short squeeze.
Maybe, just maybe, I might have a chance to get in at decent levels.
Now, let's talk about Five9 (FIVN).
Five9 builds and deploys customer management platforms so companies of all sizes can manage their massive user bases. They can use tools across all industries and verticals, and most importantly, it can sync with CRM platforms and AI models to feed it contextual data to make faster decisions.
Just recently, Five9 reported a fairly massive earnings beat, which lead to a spike. Sadly for them, the market crash started and the entire sector tanked. It's now dropped nearly 40% from its highs. At these levels, Five9 could be an interesting rebound candidate either for a swing trade to retrace part of the move.
Quick note: this entire industry has my attention from companies like NICE and others as they are essential to an organization—almost like a staple similar to VZ or T—simply because they power core components of the communication process. You can't just turn off messaging for you and your clients. New-age communications currently fill up my watchlist. I'll make a list soon.
Now, let's see if and when this sell-off ever ends. For now, I am making a list of possible dip buys.

Long Tsla at 240.10Target at 358.91 based on my calculations on Mayer and Fibo (yet studying how to build this script to trading view

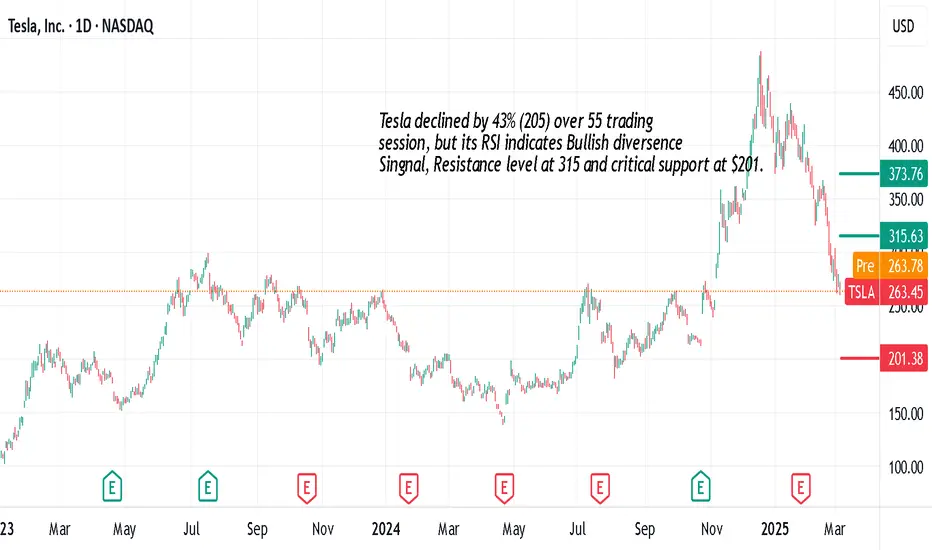
Tesla"Tesla declined by 43% (205) over 55 trading sessions, but its RSI(Relative Strength index)indicates bullish divergence,signaling potential upward momentum. Key levels to watch include esistance at315 and critical support at $201."
TESLAWe are going to invest in Tesla shares, aiming for a 50% gain before the end of April. Good luck to everyone!

TSLA Weekly Chart Analysis- NFATSLA Weekly Chart Analysis- NFA
-4Hour chart showing Bullish RSI Divergence
- Expecting another bearish day to sweep Sellside ($238)
-Great place to buy longs here
-Weekly iFVG(Green rectangle) can act as support zone
-Also approaching Weekly 200 SMA(Support)

Let's draw some linesTaking a look at the 1/1 and 4/1 Gann lines (dashed)... If we use the slopes of these lines to draw trendlines from inflection points we start to get some predictors of relative greed and "value".

TSLA - Support and ResitanceI believe NASDAQ:TSLA is entering a key support level here that will lead to a strong bounce back up. TSLA is down nearly 50% from all-time highs and is reaching a support level that had strong resistance for much of the last half of 2024. The RSI is also hanging out below 30 which could also indicate it as a strong candidate for an RSI play as well. I entered into a long position today and will accumulate more while it travels between the $260 and $230 levels. I will also add to this position when the RSI breaks above its 14 SMA. Targets for this trade are the $320 support level and 50 SMA line.

$TSLA worst 4 years are ahead us under president Trump? - What biden couldn't done would be done under $TRUMP.
- NASDAQ:TSLA has always traded at a premium devoid of any fundamentals.
- NASDAQ:TSLA cars are ugly looking cars as compared to NYSE:BYD and $RIVN. It's technology is great but you are basically buying a cheap build quality cars.
- Everyone thought that Trumpn <-> Elon parternship will be great for $TSLA. But my hunch is it will be bad for NASDAQ:TSLA shareholders. Elon's association with Trump will drag the NASDAQ:TSLA shares down and always in the limelight.
- Most elite investors are often leftist and might want to distance with trump and elon.
Fundamentally,
Year | 2025 | 2026 | 2027 | 2028
EPS | 2.90 | 3.85 | 4.96. | 6.40
EPS growth% | 18.02% | 32.82% | 28.87% | 29.12%
Fair forward p/e for a company growing EPS 20%+ with a moat is ~ 30
Fair stock value:
Year | 2025 | 2026 | 2027 | 2028
Stock price ( base case p/e = 30) | $87 | $115 | $148 | $192 |
Stock price (bear case p/e = 20 ) | $58 | $77 | $99 | $128 |
Stock Price ( bull case p/e = 50 ) | $150 | $192 | $248 | $320 |
- Bulltard + Elon musk premium p/e if ELON divorces with Trump = 100
Stock price ( p/e = 100 ) | $290 | $385 | $496 | $640

TESLAI expect the stock to approach the 300 level first in the next 6 months and then test the 700 level in the middle of the year.

$TSLA Sales Slump but is Support Near?Is Tesla ( NASDAQ:TSLA ) facing a sales slump and an overpriced valuation? In this video, we dive into the latest Tesla stock analysis, starting with the declining sales numbers and why the current valuation might be raising red flags for investors. We then break down the weekly chart, spotlighting a potential breakdown retest as NASDAQ:TSLA price nears key support levels around the 243 weekly SMA. What was once resistance could now flip to support—find out how! Zooming into the daily chart, we explore the 280 price level where the 200 SMA is and outline a possible 5-wave pattern completing at 243, followed by a correction toward Goldman Sachs’ 320 target and Bank of America’s 380 forecast. But could a deeper drop to 200 be on the horizon? Get the full technical analysis, price targets, and insights to navigate NASDAQ:TSLA ’s next move in this must-watch stock market update!

Tesla Short target approachingI have give the target and analyzed it short side. I have used Gann techniques. I have also used the trend.

230% Gains for Long TermTesla seems to be bouncing off the gap and the last golden fib level. It could potentially rally in the next 2-3 years to the 1.618 level, giving us up to 230% returns.
It also bounced off of the 200 SMA, giving us a strong bullish signal for at least the short term.
