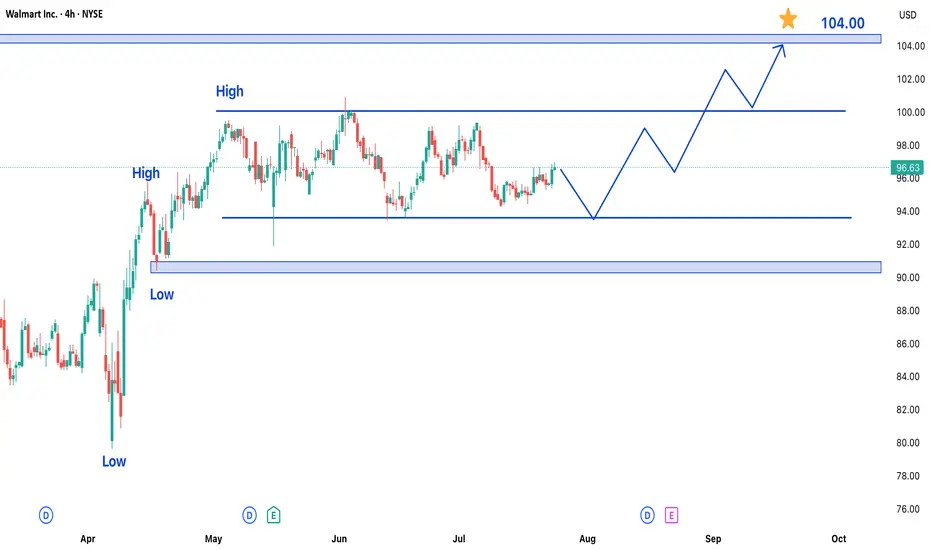
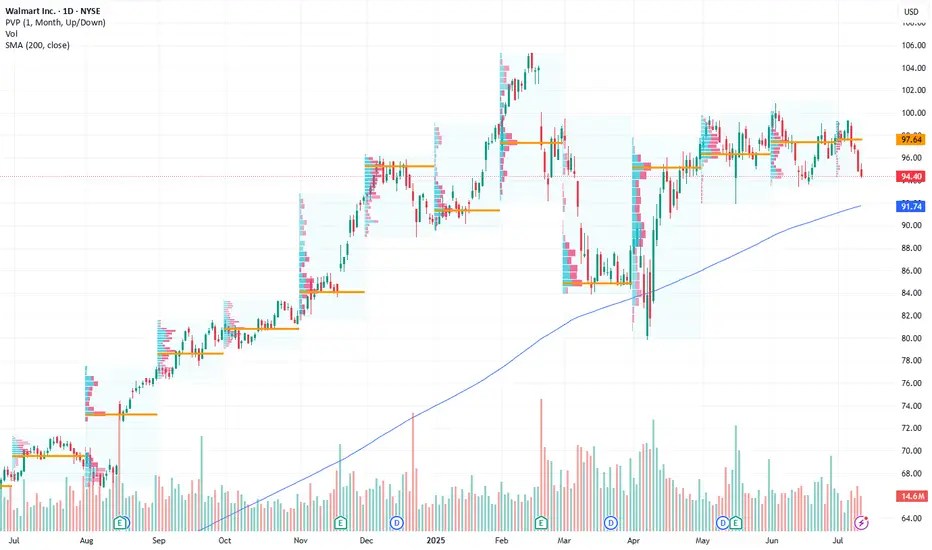
Walmart Stock Trading in Bullish Trend – Upside Potential AheadWalmart Inc. (WMT) shares are currently exhibiting a bullish trend, maintaining upward momentum over recent trading sessions. While the stock has been consolidating in a range over the past few days, the broader outlook remains positive, suggesting potential for further gains in upcoming sessions.
Key Observations:
- Established Uptrend: Walmart's price action reflects sustained buying interest, keeping the stock in a bullish phase.
- Range-Bound Consolidation: Recent sideways movement indicates a temporary pause, often a precursor to the next directional move.
- Strong Support & Resistance Levels: The stock has formed clear reference points for traders to watch.
Price Projections:
- Upside Target at $105: A breakout above the current range could propel WMT toward the $105 resistance level, representing a significant upside opportunity.
- Key Support at $90: On the downside, the $90 level has emerged as a strong support zone. Any pullback is likely to find buying interest near this area.
Market Implications:
1. Bullish Continuation Likely: The consolidation within an uptrend typically resolves in the direction of the prevailing trend—in this case, upward.
2. Breakout Potential: A decisive move above the recent range high could accelerate buying momentum toward $105.
3. Risk Management Consideration: While the bias is bullish, a drop below $90 would signal weakening momentum and potentially invalidate the near-term upside scenario.
Trading Strategy:
- Entry: Consider long positions on a confirmed breakout above the range, or on dips near $90 support.
- Stop Loss: A close below $90 would suggest a trend reversal, warranting exit from bullish positions.
- Target: $105 serves as the primary upside objective, with interim resistance levels to monitor along the way.
Final Thoughts:
Walmart’s stock appears poised for further gains, with $105 as the next key target. Traders should watch for a breakout from the current range while keeping an eye on the $90 support level for risk management. As always, confirmation through price action and volume will be crucial for validating the bullish thesis.
WALMARTCL trade ideas
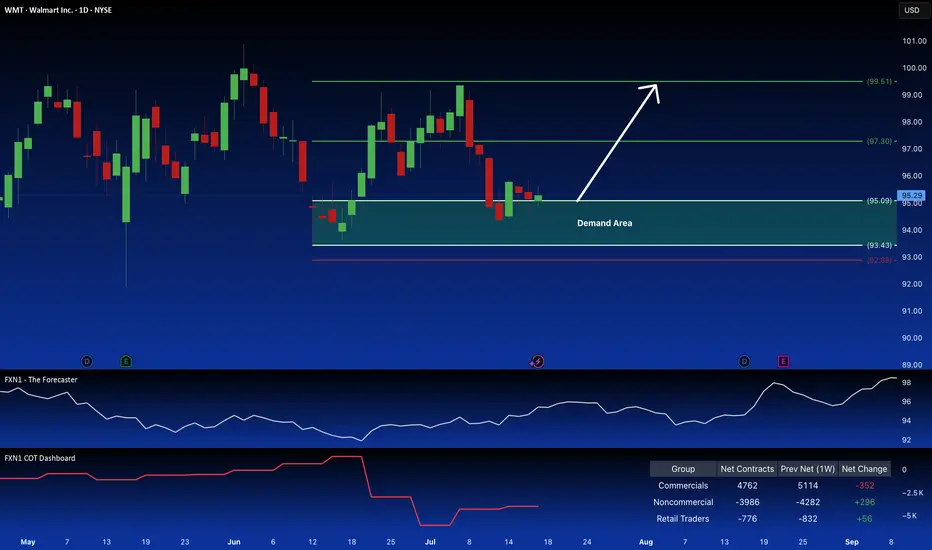
Walmart: Long Position Attractive on Demand ZoneWalmart Inc. presents a compelling long opportunity. The price action is reclaiming a key demand zone, suggesting a continuation of the current uptrend, a pattern reinforced by seasonal factors. Further bolstering the bullish case is the observed increase in large speculator positions.
✅ Please share your thoughts about WMT in the comments section below and HIT LIKE if you appreciate my analysis. Don't forget to FOLLOW ME; you will help us a lot with this small contribution.
WMT eyes on $95.68 above 93.38 below: Double Golden fibs are KEYWMT has been orbitting this Double Golden zone.
$95.68 is a Golden Genesis, $83.38 a Golden Covid.
This is the "highest gravity" cluster any asset can have.
This is a very important landmark in this stock's lifetime.
==================================================
.

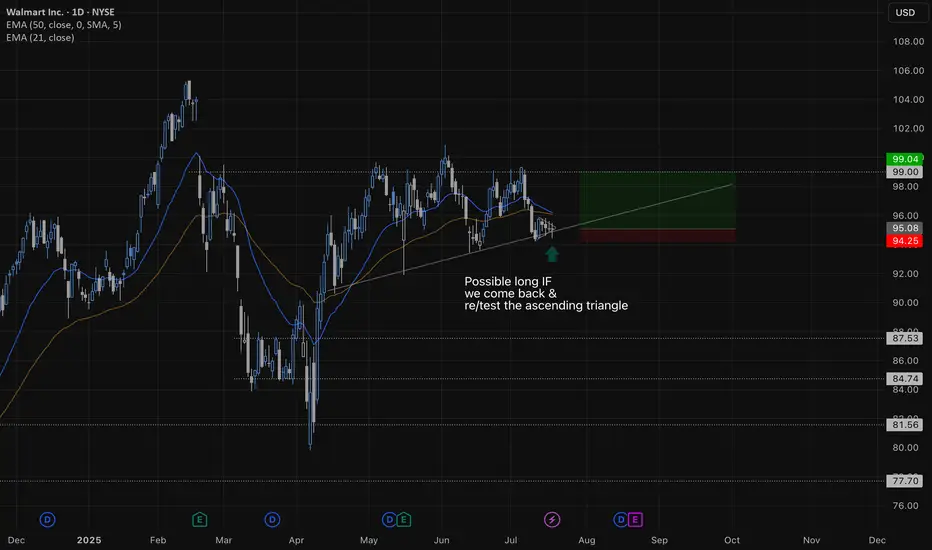
Walmart Long Taking Walmart long here, got a nice ascending triangle on the daily. We have 4 nice rejecting from the bottom trend line with nice consolidation on the daily. This was a 1h wedge and played it pretty aggressive expecting a break to the upside. I could have waited for a 1h break giving me more confirmation but I like the daily and the.
Walmart's Bullish Possibilities Walmarts wedging, with a gap to fill above from earnings, and buying volume is starting to pick up after being low during the chop. Buying volume may continue to rotate into Walmart and send it up. Nfa

Sell with the CEOWalmart CEO is selling a chuck of his stocks at this golden opportunity. Target price and stop loss indicated on the chart. This might take months to mature.
Walmart Stock Trading in Bullish Trend - Upside Potential AheadWalmart Inc. (WMT) shares are currently exhibiting a bullish trend, maintaining upward momentum over recent trading sessions. While the stock has been consolidating in a range over the past few days, the broader outlook remains positive, suggesting potential for further gains in upcoming sessions.
Key Observations:
- Established Uptrend: Walmart's price action reflects sustained buying interest, keeping the stock in a bullish phase.
- Range-Bound Consolidation: Recent sideways movement indicates a temporary pause, often a precursor to the next directional move.
- Strong Support & Resistance Levels: The stock has formed clear reference points for traders to watch.
Price Projections:
- Upside Target at $105: A breakout above the current range could propel WMT toward the $105 resistance level, representing a significant upside opportunity.
- Key Support at $90: On the downside, the $90 level has emerged as a strong support zone. Any pullback is likely to find buying interest near this area.
Market Implications:
1. Bullish Continuation Likely: The consolidation within an uptrend typically resolves in the direction of the prevailing trend—in this case, upward.
2. Breakout Potential: A decisive move above the recent range high could accelerate buying momentum toward $105.
3. Risk Management Consideration: While the bias is bullish, a drop below $90 would signal weakening momentum and potentially invalidate the near-term upside scenario.
Trading Strategy:
- Entry: Consider long positions on a confirmed breakout above the range, or on dips near $90 support.
- Stop Loss: A close below $90 would suggest a trend reversal, warranting exit from bullish positions.
- Target: $105 serves as the primary upside objective, with interim resistance levels to monitor along the way.
Final Thoughts:
Walmart’s stock appears poised for further gains, with $105 as the next key target. Traders should watch for a breakout from the current range while keeping an eye on the $90 support level for risk management. As always, confirmation through price action and volume will be crucial for validating the bullish thesis.

Stocks SPOT ACCOUNT: WMT stocks Buy Trade with Take ProfitStocks SPOT ACCOUNT: NYSE:WMT stocks my buy trade with take profit.
This is my SPOT Accounts for Stocks Portfolio.
Trade shows my Buying and Take Profit Level.
Spot account doesn't need SL because its stocks buying account.
Looks good Trade.
Disclaimer: only idea, not advice

Walmart: Retail Giant Positioned for Growth Amid Bullish MomentuCurrent Price: $94.40
Direction: LONG
Targets:
- T1 = $98.20
- T2 = $101.80
Stop Levels:
- S1 = $92.10
- S2 = $90.40
**Wisdom of Professional Traders:**
This analysis synthesizes insights from thousands of professional traders and market experts, leveraging collective intelligence to identify high-probability trade setups. The wisdom of crowds principle suggests that aggregated market perspectives from experienced professionals often outperform individual forecasts, reducing cognitive biases and highlighting consensus opportunities in Walmart.
**Key Insights:**
Walmart continues to demonstrate resilience within the retail sector, benefiting from strong consumer spending trends. Its position at the 200-day simple moving average (SMA) indicates a key technical support level, providing investors with an attractive entry point for potential upside. As e-commerce gains momentum, Walmart’s operational strengths, bolstered by strategic pricing and logistics, emphasize its long-term growth potential. Consumer discretionary spending remains robust despite inflationary pressures, solidifying Walmart's steady trajectory.
The company's push into hybrid models of shopping, blending in-store and online experiences, has given it a significant edge over competitors. With strong leadership and strategic investments in technology and supply chain efficiencies, Walmart has proactively positioned itself for sustained profitability.
**Recent Performance:**
In recent sessions, Walmart’s price has shown resilience by maintaining stability at the $94 range, aligning closely with its 200-day SMA. Despite broader market volatility, bullish sentiment in the retail sector has supported investor confidence. Comparatively, Walmart has showcased better performance than many of its peers in controlling costs while expanding its digital footprint.
**Expert Analysis:**
Market experts view Walmart as a bellwether of the retail industry. Its ability to balance cost leadership with quality offerings underscores a competitive advantage. This analysis shows optimism for Walmart's e-commerce investments and operational efficiency. Technical indicators such as a narrowing Bollinger band suggest potential volatility expansion, which combined with recent upward price action, hints at possible bullish momentum. Indicators of increasing relative strength support the potential for breakout levels.
**News Impact:**
Retail activity has been positively influenced by consumer interest in savings-focused platforms, with Walmart emerging as a primary destination. Events like Amazon Prime Day indirectly bolster competition, driving visibility toward Walmart's comparable discount strategies. Additionally, Walmart's robust supply chain measures have ensured product availability, catering to high consumer expectations and supporting its market credibility.
**Trading Recommendation:**
With Walmart holding key technical support levels and benefiting from strong consumer trends, a long position appears substantiated. Traders should consider entering near the current price with stops placed below $92 for risk mitigation. Price targets at $98.20 and $101.80 reflect meaningful upside potential spurred by favorable market dynamics and Walmart’s strategic initiatives.
WMT is ready for another phase of the price discoveryThis Week (July 8 - 12):
Support: The 20-day moving average around $96.70 is the first floor. Below that, the key range support is at $95.00.
Resistance: The top of the range and the all-time high around $101.50 is the ceiling that needs to break.
Next Month (July):
Support: The main support for the entire structure is the $95.00 level. A break below that would be a major warning sign.
Resistance: If we break above $101.50, there is no overhead resistance. We would be in "blue sky territory," with a projected target near $108.

WMT : Potential Diamond Top BreakoutDiamond top pattern identified with potential breakout above $98.90 and downside support at the 9 & 20 ema of 97.47 and 97.09. Anticipated rate cuts and seasonal rotation may drive this above the breakout threshold.

Exact Entry Levels & Profit Potential (July 3, 2025)🎯 Market Structure Breakdown – Exact Entry Levels & Profit Potential (July 3, 2025)
📊 In today’s session, I revisit the market for the second time – and you’ll see why I’m ruling out some setups altogether. There’s value in looking twice. What did I miss earlier? It's all in the structure.
I break down price action step by step, highlight precise entry zones, and show where the real potential for movement lies. Clean levels, no guessing.
⚠️ Note: I don’t trade the first 10 seconds – all orders are placed after 9:30:10 and I'm looking for entries only until 11:30:00.
👉 Check out the full breakdown and stay ahead of the game.
NASDAQ:AMZN
NYSE:ANET
NASDAQ:AVGO
NYSE:BA
NASDAQ:COIN
NASDAQ:CZR
NYSE:DELL
NASDAQ:GOOG
NASDAQ:MSFT
NASDAQ:AMD
NASDAQ:RKLB
NASDAQ:SBUX
NASDAQ:SMCI
NYSE:VRT
NASDAQ:NVDA

Long Position Targeting Key Resistance LevelsCurrent Price: $97.27
Direction: LONG
Targets:
- T1 = $100.25
- T2 = $102.50
Stop Levels:
- S1 = $95.50
- S2 = $94.25
**Wisdom of Professional Traders:**
This analysis synthesizes insights from thousands of professional traders and market experts, leveraging collective intelligence to identify high-probability trade setups. The wisdom of crowds principle suggests that aggregated market perspectives from experienced professionals often outperform individual forecasts, reducing cognitive biases and highlighting consensus opportunities in Walmart.
**Key Insights:**
Walmart continues to outperform in the Consumer Defensive sector, showcasing resilience in both stable and adverse market conditions. Experts have highlighted the stock's inclusion among bullish setups for the upcoming week, reinforcing optimism surrounding its operational strength, demand consistency, and ability to withstand broader economic volatility. These factors make Walmart a compelling candidate for potential near-term upside.
**Recent Performance:**
Walmart has maintained solid momentum, benefiting from strength within the Consumer Defensive sector, which remains a preferred choice among investors during uncertain economic phases. The stock has positioned itself as a safe harbor amid broader market volatility, garnering attention alongside peer staples like Costco and Pepsi.
**Expert Analysis:**
Consensus among market analysts paints a favorable outlook for Walmart, rooted in its enduring competitive edge, operational reliability, and robust consumer demand. The bullish sentiment ahead aligns with Walmart's ability to cater to investors seeking both stability and moderate growth in uncertain conditions. Analysts’ perspectives suggest the stock may trend upward, particularly if it breaches next week’s projected resistance levels.
**News Impact:**
While no major recent announcements have been flagged, Walmart's sector resilience combined with market enthusiasm for its strategic positioning signals optimism. Investors should remain alert for potential catalysts such as earnings reports, operational strategy updates, or changes in consumer spending that could influence performance. Walmart’s reputation as a core staple positions it well for consistent interest and demand.
**Trading Recommendation:**
The positive sentiment surrounding Walmart’s operational strength and sector resilience makes it a strong candidate for a LONG position with an upside potential to the next resistance levels. With robust performance in uncertain conditions, Walmart presents traders with an opportunity for growth with defined risk parameters provided by the stop-loss levels.

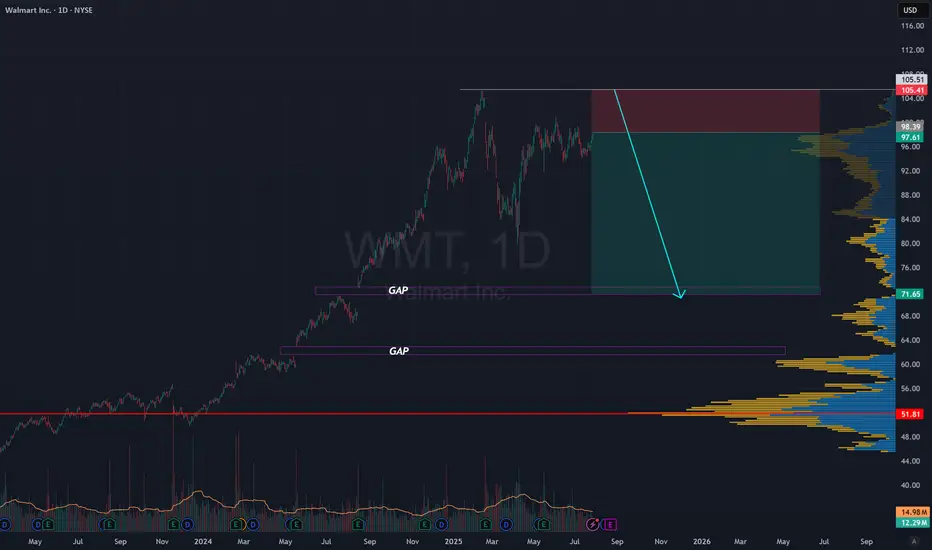
goes up to 100USD then Drop to 70USD for first step.It could eventually reach $100, but then, like most stocks on the US stock market, it will fall and fall to $70 in the first stage.

Wake-Up Time for Walmart?Walmart has snoozed for months, but some traders may think it’s waking up.
The first pattern on today’s chart is the price range on either side of roughly $95. The retail giant peaked at that level in early December and is back near the same location more than six months later. That indicates a period of consolidation has occurred.
Second, a weekly low of $93.43 developed near the bottom of the range. WMT held it last week and bounced, which may suggest support is in place.
Third, stochastics have rebounded from an oversold condition and prices are bouncing at the 100-day simple moving average. Those signals may imply a longer-term uptrend remains in effect and is reasserting itself.
Finally, traders looking to the upside may notice the February 20 gap around $100. WMT probed that level in early June before backing down. Is another test coming?
Check out TradingView's The Leap competition sponsored by TradeStation.
TradeStation has, for decades, advanced the trading industry, providing access to stocks, options and futures. If you're born to trade, we could be for you. See our Overview for more.
Past performance, whether actual or indicated by historical tests of strategies, is no guarantee of future performance or success. There is a possibility that you may sustain a loss equal to or greater than your entire investment regardless of which asset class you trade (equities, options or futures); therefore, you should not invest or risk money that you cannot afford to lose. Online trading is not suitable for all investors. View the document titled Characteristics and Risks of Standardized Options at www.TradeStation.com . Before trading any asset class, customers must read the relevant risk disclosure statements on www.TradeStation.com . System access and trade placement and execution may be delayed or fail due to market volatility and volume, quote delays, system and software errors, Internet traffic, outages and other factors.
Securities and futures trading is offered to self-directed customers by TradeStation Securities, Inc., a broker-dealer registered with the Securities and Exchange Commission and a futures commission merchant licensed with the Commodity Futures Trading Commission). TradeStation Securities is a member of the Financial Industry Regulatory Authority, the National Futures Association, and a number of exchanges.
TradeStation Securities, Inc. and TradeStation Technologies, Inc. are each wholly owned subsidiaries of TradeStation Group, Inc., both operating, and providing products and services, under the TradeStation brand and trademark. When applying for, or purchasing, accounts, subscriptions, products and services, it is important that you know which company you will be dealing with. Visit www.TradeStation.com for further important information explaining what this means.

Walmart (WMT): Building Momentum, Targets in SightLong-Term Trend Break : Walmart (WMT) was in a strong, sustained uptrend until early 2025, indicated by the thick green channel, but then experienced a significant correction in March that broke this primary ascending channel.
Established Support Zones : Following the March decline, WMT has established a "Good support" area near 91 to 93, with "Immediate Support" now identified at 96, indicating buying interest at these levels.
Current Price Action & Recovery Attempt : The stock is currently trading around 97.70, showing a bounce from its recent lows, suggesting an attempt to regain upward momentum after forming a potential bottom.
Defined Upside Targets : Two sequential bullish targets: a "1st Target" at 100, and a "2nd Target" at 104, which coincides with the previous resistance area and potentially the upper boundary of the long-term channel.
Disclaimer:
The information provided in this chart is for educational and informational purposes only and should not be considered as investment advice. Trading and investing involve substantial risk and are not suitable for every investor. You should carefully consider your financial situation and consult with a financial advisor before making any investment decisions. The creator of this chart does not guarantee any specific outcome or profit and is not responsible for any losses incurred as a result of using this information. Past performance is not indicative of future results. Use this information at your own risk. This chart has been created for my own improvement in Trading and Investment Analysis. Please do your own analysis before any investments.

Shorting Walmart at $90 Strike: Viking Technical Raid Wielding the axe of strict technical analysis and guided by the ravens of market intuition, I’m see short potential for Walmart (WMT) targeting a $90 strike price within 1-2 weeks (by June 20-27, 2025) . Key runes of the charts foretell a storm of downside momentum . Recent price sagas reveal faltering bullish spirits, with a double top signaling weakness in the enemy’s ranks. My Viking strategy strikes with precision to shield against counterattacks. Join my Trading Den for updates on this bold raid and more technical conquests! Skål! Not financial advice; trade at your own risk.

WALMART testing its 1D MA50! Will it bounce?Walmart (WMT) hit yesterday its 1D MA50 (blue trend-line) for the first time since April 21. It appears that the rebound from the Trade War Low has turned sideways on a Double Top formation and the 1D MA50 is the first Support to be tested, with the 1D MA200 (orange trend-line) following.
This pattern resembles the August - September 2022 Bull Flag, which despite breaking below its 1D MA50, it resumed the uptrend shortly after and hit the 1.382 Fibonacci extension before the next 1D MA50 pull-back.
As a result, we expect the stock to reach $110.00 (Fib 1.382) by the end of the Summer.
-------------------------------------------------------------------------------
** Please LIKE 👍, FOLLOW ✅, SHARE 🙌 and COMMENT ✍ if you enjoy this idea! Also share your ideas and charts in the comments section below! This is best way to keep it relevant, support us, keep the content here free and allow the idea to reach as many people as possible. **
-------------------------------------------------------------------------------
💸💸💸💸💸💸
👇 👇 👇 👇 👇 👇

WMT: Walmart stock under pressure from tariffs.
It seems that Trump's tariffs are not very favorable for Walmart’s long-term outlook.
However, from a technical perspective, the stock is currently in a good position, and its short-term EPS forecasts are improving day by day.
I don’t recommend buying Walmart for the long term, but there might be a good buying opportunity next week.

$WMT with a bullish outlook following its earnings #StocksThe PEAD projected a bullish outlook for NYSE:WMT after a negative over reaction following its earnings release placing the stock in drift C with an expected accuracy of 66.67%%.

Walmart Head & Shoulders on Daily and Weekly chartWalmart (WMT) may be forming, or already has formed, a bearish Head & Shoulders pattern.
#WMT #Walmart #bearish #short #headandshoulders #retail #discountstore

Three U.S. Retail Kings, Three Tariff StrategiesIn an environment of trade tensions and tariffs threatening to raise costs, America’s retail giants have taken very different paths to protect their profitability. Below, we analyze how Home Depot, Costco, and Walmart have managed the latest tariffs and how this shows up in their net profits for the two most recent fiscal years.
1. Home Depot: Absorbing the Cost and Diversifying Supply
o Net profit 2023: USD 17,105 M
o Net profit 2024: USD 14,806 M (–13.5 %)
In an unusual move for the sector, Home Depot refused to pass Trump’s tariff costs onto consumers, declaring “no way” they would raise prices. Instead, they bolstered their network of professional contractors and acquired SRS Distribution, allowing them to handle large volumes at lower cost and more competitive prices. Their geographic diversification now means no country outside the U.S. accounts for more than 10 % of their sourcing.
o Q1 FY25 sales: USD 39,860 M (↑ 9 % YoY)
o Q1 FY25 net profit: USD 3,400 M (–5.6 % YoY)
o Q2 FY25 guide: sales growth +2.8 %, maintaining solid EBITDA without price hikes.
o Current share price (20/05/25): USD 377.05 (YTD +2.45 %)
o 12-month forecast range: USD 360–475; consensus target: USD 427.50.
2. Costco: Memberships as an Inflation Shield
o Net profit 2023: USD 6,292 M
o Net profit 2024: USD 7,367 M (+17.1 %)
Rather than splashy headlines, Costco sticks to its tried-and-true formula: razor-thin margins and membership fees. By keeping margins tight on high-turnover goods and offsetting with subscription revenue, the company has boosted its member base and renewals, and optimized its internal supply chain to minimize external cost impacts.
o Q1 FY25 sales: USD 60,990 M (↑ 7.5 % YoY)
o Q1 FY25 net profit: USD 1,798 M (↑ 13.1 % YoY)
o Q2 FY25 (12 weeks): sales USD 62,530 M (↑ 9.1 % YoY); net profit USD 1,788 M
o Current share price (20/05/25): USD 1,036.82 (YTD +13.43 %)
o 12-month forecast range: USD 907–1,205; consensus target: USD 1,082.14.
3. Walmart: Selective Price Tweaks and Omnichannel Push
o Net profit 2023: USD 13,670 M
o Net profit 2024: USD 15,500 M (+13.4 %)
Unlike Home Depot, Walmart has been more willing to adjust prices on tariff-hit categories, drawing some White House criticism. Still, they closed Q1 FY25 with sales of USD 165,600 M (↑ 2.5 % YoY) and net profit of USD 4,480 M (–12.1 % YoY). For Q2, they anticipate sales growth of 3.5–4.5 % versus USD 167,800 M a year ago, thanks to their e-commerce and subscription services push. Their omnichannel strategy doubles down on platform investment, “click & collect,” and expanding digital delivery and subscription offerings.
o Current share price (20/05/25): USD 97.80 (YTD +8.81 %)
o 12-month forecast range: USD 91–120; consensus target: USD 109.33.
Conclusion
Peering out the windows of their vast megastores, Home Depot, Costco, and Walmart face the same tariff storm with very different navigational charts. Home Depot chose to resist price increases, absorbing extra costs and reengineering its supply chain to limit any single foreign supplier to under 10 %—a temporary margin sacrifice for long-term stability. At the other extreme, Costco has built an impenetrable dam with its membership model and razor-thin margins, where member loyalty and a fine-tuned internal logistics engine act as a natural shield against inflation and tariffs. And in between, Walmart sharpens its selective pricing knife on tariff-hit goods while flexing full omnichannel muscle—from “click & collect” to beefing up digital subscription and delivery services. Three distinct survival stories, yet one shared endpoint: weathering the tariff tempest without losing the rhythm of their financial performance.
*******************************************************************************************
The information provided does not constitute investment research. The material has not been prepared in accordance with the legal requirements designed to promote the independence of investment research and such should be considered a marketing communication.
All information has been prepared by ActivTrades ("AT"). The information does not contain a record of AT's prices, or an offer of or solicitation for a transaction in any financial instrument. No representation or warranty is given as to the accuracy or completeness of this information.
Any material provided does not have regard to the specific investment objective and financial situation of any person who may receive it. Past performance is not reliable indicator of future performance. AT provides an execution-only service. Consequently, any person acting on the information provided does so at their own risk.

possible short?Should we short this since it won't lower prices??????
We'll see how this performs. Yet not going with America might seem dumb.
