WMT idea This is the first options contract I ever purchased! I purchased 2 contracts at $1.08 on average on 3/4. my breakeven price is 146.08 and so far I'm up a total of about 160% This graph is what helped me to decide on my play. IF you have any tips or would like to bounce ideas off each other let me know id very open! I'm new to the market and want to learn its ins and outs.
WMT trade ideas


$WMT with a Bullish outlook following its earnings #Stocks The PEAD projected a Bullish outlook for $WMT after a Positive Under reaction following its earnings release placing the stock in drift A with an expected accuracy of 80%.

WMT Descending Trendline Breakout WMT formed an inverse head and shoulder pattern before breaking and closing above the descending trendline
Took a position of 300 shares @ 22.71
Stop loss will be placed at the previous pivot low

WMTDaily Report
WMT held the 134 support level for the 7th time. It looks like it will finally breakout of the 144 resistance and head to 152. WMT does have a breakout on the RSI and a bullish cross on the delta indicator.

bullish continuation of green maribozu (WMT)id love to see this trend continue, and this is a stock that usually follows through on its guarantees. when a strong return to the uptrend is shown, completion of the bull pattern is normally achieved. weve taken out multiple levels of resistance, and if we conti ue immediately we are bound for upper 146s.

WMTWalmart (WMT) said Wednesday MAR 02 it is launching Zeekit's technology that enables customers to virtually try on clothing from the retailer's private labels or the national brands it carries.
The technology will be available on Walmart's mobile application and website. It will allow customers to choose a model who best represents their height, body shape, and skin tone and see how an item looks on them, the company said

Nice demand zone for $WMT on the one hour.There is a nice demand zone I identified on the one hour for $WMT, and I think $WMT should bounce from that area once it reaches that area again.


Short on Walmart They did just raise their dividends and beat earnings but the thing is that Walmart relies on contracts threw vending with their great value of the exception.... i mean Walmart has plenty of options from here with the money they have made over the years .... i mean i would rather go to a small store like a CVS called great value full of nothing but great value products.... Their murphy usa stock separated itself and its doing great... im just bearish in general on Walmart and their whole operation tactics. Not only thay the highs keep getting lower, Walmart moves rapid so if we can break the $141 local resistance then i can see some upside if not its down town to shaded areas marked.


$WMT - looks like good consolidation.WMT has been consolidating and should continue down to 124-125. Nice bounce at that level with low downside risk. No gaps below.

Wmt trade Opportunity Wmt is currently at support and it looks like its holding so far. There is a W pattern on the 15 minute chart. Calls look amazing with the 8-1 risk to reward ratio if you were to hold your whole position until resistance at 152. There are 2 things off setting this play so far, earning are right around the corner and the market sediment is bearish. Unfortunately those 2 things mean a lot and adds more risk to this play.

Walmart Technical Analysis-Read notes on the chart for full analysis.
-Price reacts off of support/demand but each time price reacts off of the support/demand buyers cant seem to take full control.

Walmart, Hourly Wedge PopSo, to start off, Walmart is currently a stock in one of my backtested strategy's that does about 0.16% per day on average.
The setup is clearly a wedge, and I'd kinda expect it to pop in a day or two here. When WMT moves it tends to do so explosively after a week or so of consolidation, so it's actually a really nice setup. If it doesn't move in a day or two I'll redefine a range and wait for another breakout. I think when it does break out it'll move a few percent in a week. My stop will be either a new low of the range, or a failure to breakout tomorrow.

$WMT good entry point (4/5)Conviction: 4/5
Thesis
at former resistance-turned-support (2008 peak)
near channel (2016) support
very cheap (P/S of 0.67), although more expensive relative to own history
RSI-W not overbought at all
RSI-D showing possible bullish div
Risks
balance sheet is a bit weak (low quick ratio)

WMT- Setting up descending triangle Rangebound for now - 135 has held 4 times since last year.
Selling volume could pick up if it really is going to break down before ER. I expect chop to continue into ER.
Positionally, I think WMT would see ATH with eCommerce and WMT+ membership picking some steam.

Trade idea on Walmart - WMTJust as an idea: Cash secured put on Walmart, with a strike price of $134 (delta 23) and an expiry of Feb. 18, 2022. Trade would to be closed on Feb. 16, 2022, 1 day before the quarterly results, which will be published on Feb. 17, 2022, before market opening. The $134-$135 area has successfully acted as support four times over 1 year. Whether it will do it another time is of course uncertain! The additional purchase of the cheaper put with strike price 115$ reduces the margin and creates a bull put spread. This trade idea is one of the 222 trade ideas from my book "The Stock Market Year 2022: Which stocks go up and when?"
Disclaimer:
This trade idea is for educational purposes only and does not constitute investment advice or a solicitation to buy or sell securities or financial instruments. Investment in securities and financial instruments (especially options) are generally associated with risks, up to total loss of the invested capital and above. I am not a financial advisor. Please do your own research and make your own decisions.

WALMART, sell short and I don't recommend to keep itsell short I don't recommend to keek this stock we have a pullback after a long uptrend

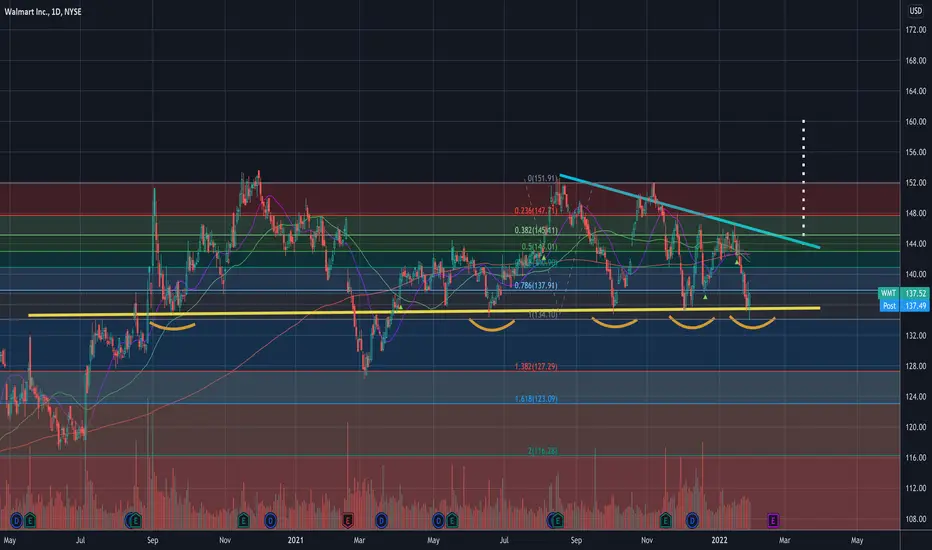
$WMT - Can we get a reversal?A lot has happened since the last chart was published. Past 2 weeks has reshaped the pattern.
The price is currently sitting on lower trend line of a descending wedge at around $135 area. $135 has provided as support prior 3 times and it provided support again in today's trading session.
It may be a signal that reversal could be happening and the price could again travel towards the upper trend line area of around $144.
If the price breaks above $146, we can expect the price to travel to $151 which is prior all time high. If the momentum allows, we can see $160.
Anything is possible in this volatile market. If the price breaks below $135 support, we can expect to see $127.29.
Bullish Target 1 - $144
Bullish Target 2 - $151
Bearish Target - $127.29 (If the price breaks below $135 support.)
———————————————————
How to read my charts?
- Matching color trend lines shows the pattern. Sometimes a chart can have multiple patterns. Each pattern will have matching color trend lines.
- The yellow horizontal lines shows support and resistance areas.
- Fib lines also shows support and resistance areas.
- The dotted white lines shows price projection for breakout or breakdown target.
Disclaimer: Do your own DD. Not an investment advice.

WMT - Bounce of Lower End of Symmetrical TrianglePrice has been in a symmetrical triangle for the past several months as it takes a breather from the prior uptrend. It is currently at the lower end (support) of the triangle and looks likely to bounce (it has bounced off this support thrice before). The stock could have a lot of potential upside, especially if the symmetrical triangle breaks out past resistance in the coming months. That being said, broad market sentiment is quite bearish so I wouldn't be too surprised if support doesn't hold here. I would be a little patient and wait to see where price opens tomorrow; if it opens at or above $139 and seems to be holding that level, I would look to enter long. PT#1 is around $148-$150; PT#2 is $163; PT#3 is $180. Place your stops at $137.
Although it is still a bit early to call, numerous indicators(inflation, stark overvaluations, rising debt, massive market speculation, ukraine tensions, etc.) suggest that the economy could be heading into a recession. Walmart, being an essential big-box retailer, is one of the stocks that has the ability to weather recessions, an ability it has demonstrated several times in the past, so it could be a relatively safe long position for the coming months.
