BTC vs Nikkei 225 strong match for declineI've been using the Nikkei 225 for at least 2 years to make forecasts as the big players have been involved in the Japanese Carry Trade.
Gains in the Japanese Nikkei 225 equity market have carried onto Bitcoin BTC.
Now I am afraid BTC could collapse from 120k and above to well under 50k. Not just for a short duration but permanently. It will begin with a volatile ABC, but could commence into a deep wave 3 down, where waves before the ABC is wave 1.
You should be considering selling all your Bitcoin BTC and Crypto.
There will be no come back from this.
I'd advise followers to make use of the following SHORT methods.
1. Use Short ETF's were you cannot be scam wicked.
2. Only use European Style Put Options on short durations e.g Derebit.
3. MSTR Option Shorts and Short ETFs will be a good way to capitalize on this volatility.
Be aware that the majority of exchanges are going to go bust from this event.
It would be advisable to solely trade on a ON RAMP exchange or with a reputable Stock Broker that has insurance or Gov payback schemes on your fiat.
BEARUSD trade ideas

BTCUSD...15m chart patternlooking at a BTC/USD long trade setup:
Entry: 92,550
Stop Loss (SL): 92,000
Take Profit (TP): 93,000
Here's a quick breakdown:
Risk: 550 points
Reward: 450 points
Risk-Reward Ratio (RRR): ~0.82
This is a bit below the ideal 1:1 RRR. You might want to:
Tighten your SL slightly (if structure allows), or
Aim for a higher TP to improve the RRR

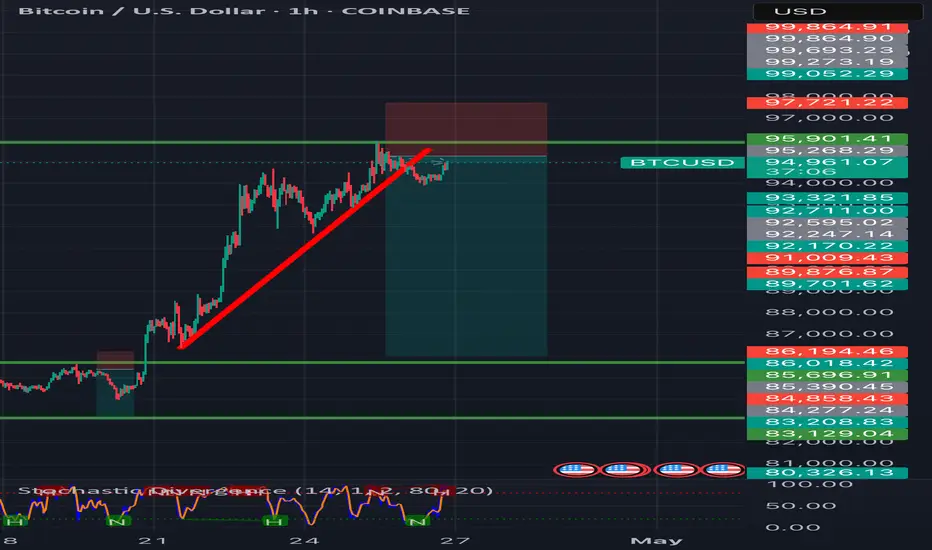
BTCUSD:Wait for a breakthroughToday, the price of BTC strongly broke through the threshold of $93,000. Subsequently, it started a rebound trend. After consolidating near $95,500, it failed to further break through the resistance level of $96,000 and dropped back to around $94,000. It may fall again and break below the support level of $93,000.
The breakthrough of these two key price levels will serve as an important dividing line for the subsequent trend of BTC, indicating the direction of its future price movement.
Special Reminder: A number of important economic data will be intensively released this week, and market volatility is likely to increase significantly. It is recommended that everyone trade with caution and strictly control risks.
I am committed to sharing trading signals every day. Among them, real-time signals will be flexibly pushed according to market dynamics. All the signals sent out last week accurately matched the market trends, helping numerous traders achieve substantial profits. Regardless of your previous investment performance, I believe that with the support of my professional strategies and timely signals, I will surely be able to assist you in breaking through investment bottlenecks and achieving new breakthroughs in the trading field.

BTC LONG IDEATimeframe: 1H⏰
Analysis:
• BTC is consolidating after a strong bullish move. 📈
• The market structure remains bullish, with a high probability of continuation to the upside. ✅
• A bullish flag/channel pattern is forming. 🏳️🌈
• Strong support is located around 93,700. 🛡️
Key Zones:
• Support zone: 93,700 🧲
• Resistance zone: 95,000 → 96,500 🎯
Idea:
• Price action currently shows a bullish bias. 🔥
• Watching for a breakout or a potential retest without structural break. 🧐
• Momentum is building, supporting further upside movement. ⚡

BitcoinGreen line represents mid-point and the respective upside and downside levels for the study purpose.

"BTCUSD | Smart Money Discount Play | Watch the Liquidity Trap"⚡ BTCUSD Analysis - 1H Timeframe | April 27, 2025
📊 Price Action Summary:
BTC has tapped perfectly into the Discount Zone after orchestrating a clean liquidity sweep below the prior lows.
🔥 Key Moves:
Liquidity Grab: We can clearly see those liquidity spikes — textbook fakeout behavior.
ChoCH (Change of Character): After the liquidity sweep, a strong bullish shift (ChoCH) appears, signaling a potential reversal.
Strong Low Created: This strong low within the discount zone is now protected by Smart Money players.
🧠 What's Actually Happening Behind the Scenes:
Retail traders: "It's breaking down! Sell everything!" 🚨
Smart Money: "Thanks for your liquidity. We’re loading up. 🛒"
🧩 Why This Setup Matters:
BTC swept liquidity, trapping sellers.
We saw a bullish change of character — proof of demand stepping in.
Entry opportunity now exists inside the yellow Discount Zone, where risk is minimized and upside is juicy.
🎯 Trade Setup Idea:
Entry: Inside the Discount Zone AFTER confirmation.
Stop Loss: Below the strong low (~93,455) — surgical precision.
Take Profit Zones:
Weak High (~94,500) for first scale-out 🎯
Strong High (~95,773) for the real bag 🚀
💬 Pro Tip:
"Smart Money buys red and sells green. Retail does the opposite."
Watch how BTC reacts around the ChoCH — this is where the BIG BOYS decide the next move. 🧠🔍
🚀 Summary:
✅ Liquidity sweep complete
✅ Change of character confirmed
✅ Discount zone respected
✅ Probability favoring upside expansion
🧘♂️ Be patient, wait for confirmations, and execute with sniper discipline.
✍️ Save this chart, journal it, and study how liquidity manipulation looks in real-time!
➡️ Comment "BULL MODE" if you’re positioning inside the Discount Zone!
➡️ Tag a trader who still thinks markets move randomly. 😂📉📈

BTCUSD:Ascending Wedge Trend and StrategiesI. Trends and Patterns
From the 4 - hour chart, BTCUSD has shown complex volatility characteristics recently:
1.Consolidation phase: The price oscillated within a narrow range in the early stage, forming a rectangular consolidation pattern. The forces of bulls and bears were relatively balanced, and there was a strong wait - and - see sentiment in the market.
2.Breakout and current pattern: After breaking through the consolidation range, the price moved upward, indicating that the bulls were dominant in the short term. However, it has now entered an ascending wedge pattern - which is a common reversal signal in technical analysis.
- Pattern characteristics: Although the price has been making short - term new highs, the upward slope has gradually flattened, suggesting that the bullish momentum is fading and the bearish momentum is gradually accumulating. Be vigilant against the risk of trend reversal.
II. Key Support and Resistance Levels
S1: $93,000. It is near the lower trend line of the ascending wedge and also a previous pullback low. If the price drops, this could form a strong support. If it is broken, it may open up a downward space, and we need to be vigilant against trend reversal.
S2: $91,500. It is the upper edge of the previous consolidation range. If the price drops significantly, this may form a secondary support to slow down the decline.
R1: $96,000. It is near the upper trend line of the ascending wedge. The price has tested it several times without a valid breakthrough, indicating strong selling pressure here and a significant short - term suppression effect.
R2: $98,000. It is a higher - level resistance target. If the price breaks through $96,000 strongly and holds above it, it may further rise to this level.
III. Trading Strategy Recommendations
1.Bullish strategy:
- Entry conditions: The price finds support near $93,000 (such as the appearance of bullish candlestick patterns like hammer candlesticks), and does not break below this level.
- Target price: $96,000 (testing the upper wedge), and if broken, look towards $97,500.
- Stop - loss setting: Break below $92,500 (below the lower edge of the support level).
2.Bearish strategy:
- Entry conditions: The price effectively breaks below the support level of $93,000 (such as closing below it for two consecutive candlesticks), or encounters resistance and falls back near $96,000 (the appearance of bearish patterns like shooting star candlesticks).
- Target price: $91,500 (the upper edge of the previous consolidation), and if it further drops, it can look towards $86,000.
- Stop - loss setting: Break above $96,500 (above the upper wedge).
3.Risk warnings:
- The reversal signal of the ascending wedge needs to be verified with trading volume (for example, if there is a significant increase in volume during the breakout, the signal is more reliable).
- Pay close attention to fundamental factors such as the expected Fed policy and regulatory dynamics of cryptocurrencies. Be vigilant against breakout movements triggered by unexpected news.
IV. Conclusion
Currently, BTCUSD is in a critical observation period of the ascending wedge. Technical analysis shows that the bullish momentum is waning, and it faces a directional choice in the short term. Aggressive traders can lightly test the waters near support/resistance levels, while conservative traders are advised to wait for clear breakout signals (such as a volume - based breakout of the upper wedge or an effective breakdown of the lower wedge) before entering the market. At the same time, strictly control positions and stop - losses to avoid volatility risks before the pattern is confirmed.

BITCOIN BEST PLACE TO SELL FROM|SHORT
BITCOIN SIGNAL
Trade Direction: short
Entry Level: 92,665.30
Target Level: 86,001.16
Stop Loss: 97,096.62
RISK PROFILE
Risk level: medium
Suggested risk: 1%
Timeframe: 9h
Disclosure: I am part of Trade Nation's Influencer program and receive a monthly fee for using their TradingView charts in my analysis.
✅LIKE AND COMMENT MY IDEAS✅

CME Gap Between 91,050 and 91,659 – Market Might Revisit🧠 A CME gap has formed between 91,050 and 91,659 🕳️
Price could retrace to fill this zone after the recent bounce 🔁
This area is often revisited — watch out for a possible reaction ⚠️

Bitcoin: The Grand Ascension Blueprint - Ready for Lift-Off!
The Most Important Bitcoin Chart You'll See This Year.. As we said before in pervious idea for enrty in 74,500
and that what happen in one month
Looking at this daily BTC/USD chart, we're witnessing the formation of a powerful technical setup that could define the rest of 2025. This isn't just another prediction—it's a strategic roadmap based on key technical levels that smart money is watching.
📊 What The Chart Is Revealing:
🔷 Perfect Channel Formation
* Bitcoin has established a massive ascending channel (gray boundaries) with textbook precision
* Current price ($77,626) testing the critical lower boundary support
* Previous touch points have all resulted in significant bounces
🔷 Triple Target Trajectory
* TP1: $82,400 - Initial relief target (conservative)
* TP2: $85,700 - Mid-channel equilibrium zone
* TP3: $89,100 - Upper resistance test before potential breakout
🔷 Historical Context Matters
* We're constructively holding above the December 2023 breakout level
* Current consolidation mirrors the pre-pump phase from late 2023
* Blue trendline break served as the first warning of trend change
Why This Pattern Has MASSIVE Implications
⚡ The Timing Effect:
The current position at channel support presents a rare low-risk, high-reward opportunity with clear invalidation points. The pattern suggests accumulation before a potential explosive move toward $130,000 by August-September.
⚡ Macro Alignment:
This technical setup coincides perfectly with post-halving supply dynamics and institutional capital flow patterns. The projected move higher follows the historical post-halving performance cycles.
⚡ Risk Management Precision:
* Invalidation point: Clear break below $74,000 with volume
* Ideal entry zone: $74,800-$75,500
* Risk:reward ratio at current levels: approximately 1:5
he Hidden Message Most Traders Are Missing
This isn't just about price targets—this formation suggests Bitcoin is preparing for its largest percentage gain phase of this cycle. The projected path (purple forecast line) indicates a potential 68% move from current levels in just 90-120 days.
Institutional positioning data supports this view. The methodical stair-stepping pattern in the forecast line suggests strategic accumulation phases between aggressive price advancement.
📊 SEE YOU AFTER 3-4 MONTHS .. FOLLOW ME FOR MORE DETAILS 📊

"BTC Just Triggered ChoCh! Are You Ready For The Next Big Play?"⚡ BTCUSD Analysis - 15M Timeframe | April 28, 2025
📈 What's Happening:
BTC hunted liquidity above the previous highs (notice those $$$ grabs 🔥).
A sharp sell-off followed = Clear ChoCh (Change of Character) printed.
Price is now marching back into the Fair Value Gap sitting right inside the Premium Zone.
🚨 Critical Levels Highlighted:
Strong High = Ultimate invalidation for bears if price closes above.
Fair Value Gap (FVG) = First supply area.
Order Block (OB) = Deeper, higher probability short zone.
🧠 Key Observations:
Smart Money grabbed liquidity to trap breakout buyers.
Now price retraces into the imbalance = prime sniper setup.
🎯 2-SCENARIO PLAN:
Plan A — Short Setup (Main Bias):
✅ Wait for rejection signs inside FVG or OB.
✅ Trigger short entries only after bearish structure forms (M5 or M1 timeframe).
✅ TP1 = Previous minor low. TP2 = Weak Low (~92,800 zone).
✅ SL = Above Strong High (~95,400).
Plan B — Breaker Play (Alternative):
✅ If price smashes through OB + Strong High with strength, flip bias.
✅ Look for bullish Breaker structure (retest + continuation).
✅ Target fresh liquidity zones above.
📊 Risk Management Tip:
"React to confirmation, not prediction. Let price prove itself before you jump."
🧘♂️ Summary:
✅ Liquidity swept
✅ ChoCh confirmed
✅ Premium Zone retest incoming
✅ High Risk-Reward opportunity forming
🔥 This is where patience = profits.
➡️ Mark this setup, and let's trade like Smart Money, not like retailers.
➡️ Comment "PATIENT SNIPER" if you’re waiting for the perfect trigger!

BTC Bullish ContinuationAs predicted, BTC made an impulsive move to the upside. Currently, I'm looking for a retracement on the H4 and H1 to join the rally again. Look for rejection and a buy setup in the buy area. Trade safe.

BTC Short Term BullBTC has broken out of a mini falling wedge pattern . After touching 3 year longterm support BTC now finds its way towards $115,000 per BTC . The RSI accompanies it as in the past once the RSI broke descending resistance BTC rose sharply
Target ; $115,000

BTC DAİLYA small pullback is expected followed by a movement in the direction of the arrow. The targeted area is $144,000. This analysis can take 45 days to materialize.

Bitcoin sell technical analysis Description:
Bitcoin is rejecting major resistance near $94,000 after forming a bearish engulfing candle on the 4H chart.
• Key Resistance: $94,000–$95,000 zone rejected with strong selling pressure.
• RSI Divergence: Bearish divergence between price and RSI confirms weakness.
• Break of Support: Price broke minor support at $92,800, shifting short-term structure bearish.
• Moving Averages: Trading below the 50 EMA on the 4H chart, signaling bearish momentum.
Sell Setup:
• Look for entries around $93,500–$94,000 (retest zone).
• Stop-loss above $95,000.
• TP1: $91,000
• TP2: $88,500
Bitcoin is showing clear signs of a pullback — sellers are currently in control.
#BTC Update (1H Chart)Trade Bias Verification: Long (with caution for short-term bearish momentum)
Confidence Score: 6.5 out of 10 (slightly reduced due to bearish MACD crossover and RSI divergence)
Hypothesis Refinement:
The bullish continuation hypothesis still holds, but the MACD bearish crossover and RSI divergence on the 1-hour chart signal a stronger short-term pullback or consolidation phase. The price is likely to test the demand zone near 92,000 - 92,934 before resuming the uptrend. Traders should wait for signs of momentum recovery (MACD crossover back up, RSI turning up from support) before entering.
Key Levels:
Entry: Near demand zone 92,000 - 92,934, ideally after MACD bullish crossover and RSI support confirmation.
Stop-Loss: Below demand zone and Ichimoku cloud, around 91,000.
Take-Profit: Near recent highs (94,000) and daily resistance (95,000 to 100,000).
Actionable Insight:
Avoid chasing the current pullback; wait for momentum indicators to confirm a reversal near the demand zone.
Use a momentum-based entry strategy on the 1-hour timeframe, entering once MACD crosses back above the signal line and RSI shows upward momentum.
Set alerts for price approaching the demand zone and for MACD/RSI bullish signals.
Maintain stop-loss discipline below the demand zone to protect against deeper corrections.
Monitor volume for increasing buying interest on the bounce to confirm strength.

BTC UpdateIn my view we're still in a bullish cycle but in the short term bearish trend is not over so current retracement will stop @101k target where bearish shor term trend will restart to test 65k before massive bullish reverse to new ATH @137k where bull cycle will finish and a long term bear cycle will start.

BTC Likely to Correct – New Moon EffectThere is a strong potential for Bitcoin to undergo a correction first, with a high probability of forming a swing high. This is indicated by decreasing volume and the appearance of ranging doji candles. If today’s daily candle closes below 93,900, it will serve as a confirmation of the swing high formation.
Downside Targets:
Target 1: 92,000
Target 2: 88,000
Target 3: 86,000
Additionally, there is a potential for the decline to halt around May 12th, which may mark the beginning of a reversal.

Bitcoin trading plan through the 4th Marked the important levels in this video for this week and considered a few scenarios of price performance
Important support for this week is the 89-90k zone
Write a comment with your coins & hit the like button and I will make an analysis for you
The author's opinion may differ from yours,
Consider your risks.
Wish you successful trades! MURA

Altavics Group: Why Smart Investors Embrace CryptoVolatility Isn't the Enemy — It's the Opportunity
The crypto market is known for its fast and sharp moves. Yes, Bitcoin can drop 10% in a day. But it can also rise 40% in a month.
This is exactly why cryptocurrency remains one of the most profitable asset classes over the past decade.
At Altavics Group, we believe that fearing short-term price swings means missing out on long-term strategic opportunities.
Why Invest in Crypto?
1. Blockchain is not the future — it's already here
Web3, DeFi, and Central Bank Digital Currencies (CBDCs) are shaping a new financial system, where cryptocurrencies are the backbone of innovation.
2. Limited supply = growing value
There will never be more than 21 million Bitcoins. That makes BTC a digital equivalent of gold. In a world of inflation and excessive debt, scarcity is strength.
3. Portfolio diversification
Crypto assets help reduce exposure to traditional markets. Especially in times of geopolitical or economic instability, decentralized currencies offer a non-political, borderless hedge.
What if the market crashes?
Crypto corrections are not the end — they’re accumulation phases. Some of the best opportunities are found when the market is fearful.
Bitcoin dropped to $3,000 in 2018. Today it trades above $90,000.
Ethereum was $80 in 2019. Today it’s over $1,600.
The history of crypto is one of crashes and recoveries. Those who stay in smartly — win big.
What Altavics Group Offers
A secure, advanced platform for buying, storing, and trading cryptocurrencies
Real-time analysis and expert trading signals
Custom investment strategies aligned with your goals and risk appetite
Education for beginners and seasoned investors
Altavics Group’s Final Word
Investing in crypto doesn't mean taking blind risks. It means thinking ahead.
Those afraid of volatility today may regret missing the upside tomorrow.
Strong investors don’t chase comfort — they seek potential. And crypto is exactly that: proven potential.

Safe-haven funds continue to drive BTC higher.Yesterday, Bitcoin approached $94,000 with bulls maintaining strength, and $95,000 may become the next target. As a high-quality safe-haven asset, Bitcoin is currently still supported by uncertainties surrounding U.S. trade policies and the Federal Reserve's interest rate path. In trading operations, the strategy of going long on pullbacks should still be adhered to, with attention paid to the support level at $90,000 below.
BTCUSD
buy@93K-94K
tp:95K-96k
I hope this strategy will be helpful to you.
When you find yourself in a difficult situation and at a loss in trading, don't face it alone. Please get in touch with me. I'm always ready to fight side by side with you, avoid risks, and embark on a new journey towards stable profits.

BITCOIN NEXT STOP 110k$ In our previous update, we observed that Bitcoin (BTCUSD) had been stuck between $92-106K since November last year. Moreover, since the new Bull started in late 2022, we found five previous range-based patterns lasting for twenty months. Each led to a breakout. Hence, we concluded that based on these last five base patterns, a breakout was to be expected targeting ideally ~$110K. Unfortunately, BTC proved us wrong, abided to the "past performance is no guarantee for future results" adage, and broke down.
Thus, our alternative "Conversely, a breakdown below GETTEX:92K and especially GETTEX:89K can induce a waterfall decline back to the top of the previous range zone:

it might be go down I am unsure, but if the price action makes three touches on the top line, it might go down.
