BTC BUYBTC BUY. BTC Breakout. We have a lagging line close above the ichimoku pro on the daily as well as a candle close. Strong breakout possible. We're still waiting for a plot line close for entry.
BEARUSD trade ideas

Bitcoin Elliott Wave AnalysisHello friends
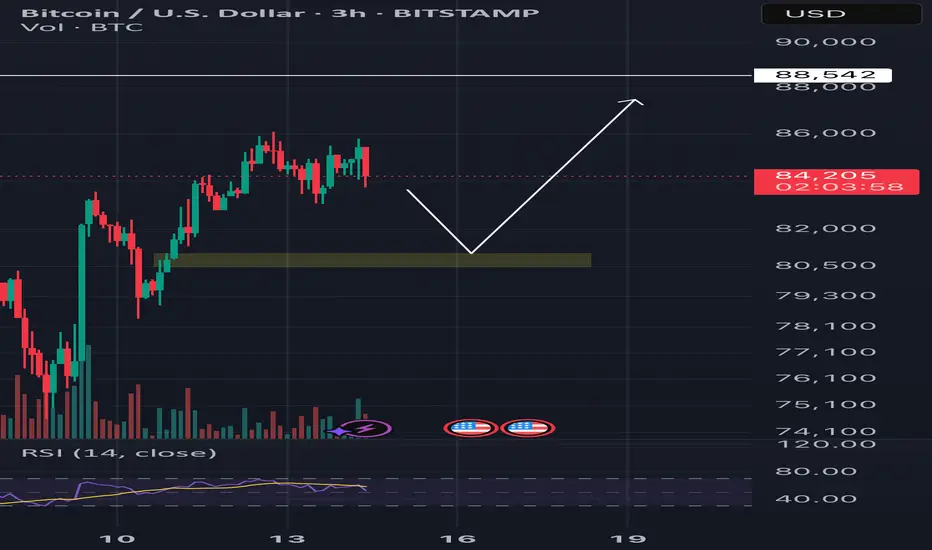
On the Bitcoin chart, we see the formation of a complete Elliott wave pattern. These waves from 1 to 3 or C are quite clear and we can even count its sub-waves.
Now a 3-wave ABC has formed. We cannot be exactly sure that this is a complete zigzag because wave C can be extended and the price will fall further.
But we consider it wave 4 assuming that this zigzag is completed.
So we will wait for the formation of an upward wave in the form of wave 5.
The target is first $86,500 and then $88,000.
Good luck and be profitable.

BTC Bullish But Needs to RetestThe market had a selloff and is about to break highs in the upcoming months!
The current coming phase will be the mania phase, most people think the bull run is over, but it is not over just yet 🙂 #trustmebro
Bitcoin has a level at 81,100 to retest and will fly until June 2025.
This will sound absurd, but BTC to 854,000! There are big institutions sell orders at that level.
XRP - $54
HBAR - $50.26
LTC - $1800
DOT - $240
ETH - $8000
BTC Full Cloud Reclaim Ichimoku Script Buy alert1. Technicals: BTC & MSTR both flashing buy signals on Ichimoku
Bitcoin (USD, daily) has just closed back above both its Tenkan‑sen/Kijun‑sen (blue/orange) and broken the downward yellow trend‑line, with price now sitting on the top edge of the cloud. That close‑above is exactly the condition you want to wait for to avoid mid‑bar whipsaws.
MicroStrategy (MSTR, daily) also closed back above its cloud, giving you a clean “BUY” arrow.
In both cases the CM_Ult_Macd has crossed back above zero and RSI sits in neutral‑to‑bullish territory.
All together that’s a pretty classic Ichimoku “trend turn” signal on the daily.
2. What the liquidation maps tell us
On the Coinglass Hyperliquidation Map, there’s a huge wall of long‑liquidation clusters sitting just below $90 000. If BTC grinds through $90 k, you can trigger a cascade of short‑squeeze buying as those long positions liquidate.
The heatmap confirms heavy leveraged interest between $88 000–$91 000. That zone could act as both resistance (big stop‑runs) or fuel a squeeze if stops get blasted.
3. Putting it together
Bullish bias now that both symbols have daily close‑above signals.
Caution around $89–90 k on BTC: big liquidity clusters live there.
A clear break and close above $90 k could flush those clusters and carry price higher.

April 25 Bitcoin Bybit chart analysisHello
It's a Bitcoinguide.
If you have a "follower"
You can receive comment notifications on real-time travel routes and major sections.
If my analysis is helpful,
Please would like one booster button at the bottom.
This is the Nasdaq 30-minute chart.
There is no separate indicator announcement.
I bet on a red finger upward sideways movement or a strong rebound.
If the green support line is maintained,
the short-term pattern will be maintained and it is a safe zone, so it seems that there will be no big effect on Bitcoin.
The short-term pattern is broken from the bottom 2,
and the bottom section is the 1+4 section, so if it succeeds in rebounding without breaking away from the true blue support line,
it is good for a long position.
I just applied it to Bitcoin.
This is a Bitcoin 30-minute chart.
The purple finger section on the lower left is the section where the long position was entered in the analysis article on the 23rd.
*When the red finger moves,
it is a one-way long position strategy.
1. $93,046 long position entry section / stop loss price when the green support line is broken
2. $95,562.5 long position 1st target -> Top 2nd -> Good 3rd section,
and when the Good section is broken, the possibility of a new high is high.
The 1st section at the top is the rising wave confirmation section
The green support line 2nd section that I marked is the safe section.
The final match was held in the 1+4 section
If the strategy is successful, the 1st section on the right is the long position re-entry and utilization section
I left a simulation with the pink finger.
From the bottom breakout, until the additional weekly candle is created next Monday,
I have sequentially displayed the main prices and support lines,
so please refer to them,
and please use my analysis articles only for reference and use,
and I hope you operate safely with the principle trading and stop loss price.
Thank you for your hard work this week.
Thank you.

BTC ANALYSE The next Fibonacci retracement level on BTC in Monthly is between .
This level could be reached in the space of three Monthly candles, with an advance of more than 27%.

BTCUSD Bitcoin (BTC/USD) highlights price movement between a key resistance zone and a strong support level. Price has currently pushed back into the Fair Value Gap (FVG) zone near 94,600, setting up a potential short-term reversal.
The expectation shown on the chart is for price to react from the FVG/resistance area and move lower toward the support level, targeting around 92,947.
Key Technical Points:
- Resistance Zone: 95,500 -95,750
- FVG Area: Current price is testing imbalance at 94,600.
- Support Level: Strong demand zone near92,750.
- Target Projection: $92,947
Outlook: Price is likely to face selling pressure around the FVG and resistance zone, leading to a possible drop towards the support zone. Traders should monitor bearish confirmations for potential short opportunities.
Would you also like me to create a short caption for posting this chart on social media?

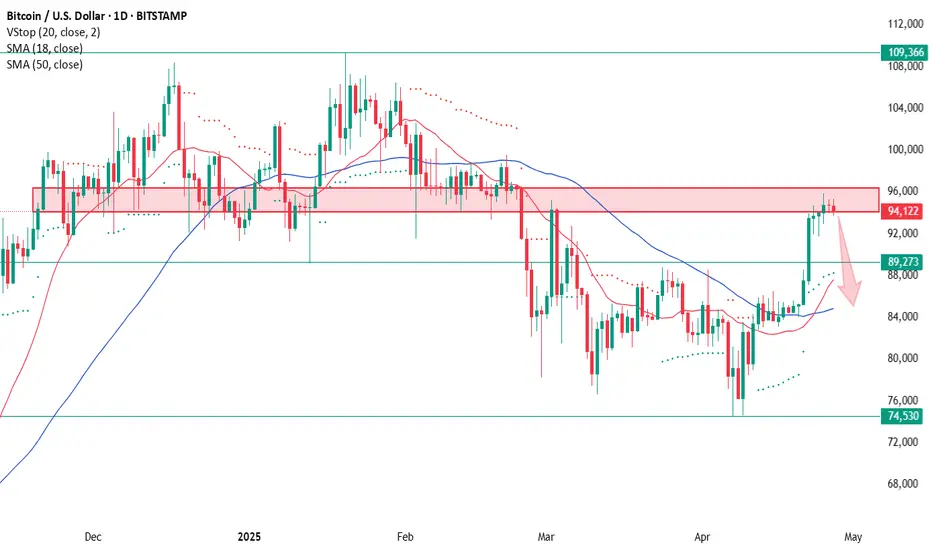
Resistance Test: Close Longs and Wait for SetupsWe've reached the zone from where a strong sell-off started back at the end of February. This area is now acting as resistance, and as we approach it, it makes sense to lock in longs — if you were holding any.
I’m not planning to short on a potential pullback; I'd rather wait for a deeper correction and then look for new long setups. The asset remains in an uptrend on the weekly chart, and as long as we stay above 74,500, I don't see any reason for confident short trades.
📝Trading Plan:
Long entries:
1. After a pullback — watching for bullish candlestick confirmations.
2. On a strong breakout above 96,300.
BTCUSD – Long Trade Setup !📈🟢
Asset: Bitcoin / U.S. Dollar (BITSTAMP: BTCUSD)
Chart: 30-Min Timeframe
Pattern: Bullish pennant breakout setup
🔹 Entry: ~$94,200 (breakout + structure support)
🔹 Stop-Loss: ~$93,000 (below pennant and trendline)
🔹 Take Profits:
TP1: ~$95,500 – Near upper channel
TP2: ~$97,000 – Measured breakout target
⚖️ Risk-Reward Calculation
– Risk per Trade: ~$1,200
– Reward to TP2: ~$2,800
– R:R Ratio: ~1:2.3 ✅
🧠 Technical Highlights
– Strong pennant consolidation after big rally
– Higher lows holding tight on 30-min frame
– Clean breakout expected above $94,500
– Previous breakout patterns confirmed bullish continuation

BTC into weekly resistanceBTC is pushing into weekly resistance, going to be interesting weekly close here, 2 more days for candle closure.
If we break above the upper blue box, we will most likely turn into buy the dip mode on higher timeframes.
If we reject here, new lows could be the target for the bears.

D1 still hasn’t formed a peak?D1 still hasn’t formed a peak?
Long this week, the peak is still on D1. D1 hasn’t signaled a top yet, and the smaller H1 or H4 timeframes are correcting to continue the LONG upward move.

BTC or Gold?Answer Gold!
The BTC/Gold ratio is on the verge of cracking here.
A crack here will trigger a sell-off in BTC relative to Gold.
This is a very simple, low risk, ratio trade.

BTCUSD h1 timeframe bullishAnalysis of the BTCUSD pair for today, April 22, 2025, btcusd formed a double bottom in the previous day, which the market bounced off and went up, then bounced back up from the sideways chill, but I analyze it going to 94000 we consider buying
Entry 88.350
TP 94.000
SL 86.000

Bitcoin on a new bull run!Technicals are aligning for a new rally. I'm watching to see price drop to the level on the chart and rally from there

#202517 - priceactiontds - weekly update - bitcoin
Good Evening and I hope you are well.
comment: Very bullish breakout on Tuesday, now bears last hope before 100000 is if maybe prior support has turned resistance. I marked the area with the red box. How likely is it? Very unlikely. Much more likely is a measured move up which could lead to 101000ish.
current market cycle: weekly chart says continuation of the bull trend but i highly doubt it. much more likely we are in a big trading range 73000 - 110000
key levels: 85k - 100k (if bears somehow manage to get below 85k again, we test 80k next)
bull case: Big breakout above 90000 and now 100000 is the obvious next target. The lowest measured move up I can see is 101000 but I want to see market reaction around 100000 first before I look for higher targets. Bulls are in full control of this but any pullback should stay above 88000.
Invalidation is below 88000.
bear case: Bears gave up on Tuesday and I think more will wait for 100000 and see if bulls take profits there before initiating new shorts. Until bears can get a daily close below 88000 again, they don’t have much.
Invalidation is above 101k.
short term: Neutral but bullish above 96k on good momentum for 100k. No shorts until bears show strength again.
medium-long term - Update from 2025-04-13: Bear targets for this year are met. Now we likely range before we get new impulse to either side. I wait for market reaction around 100000 before I write more here. For now my assumption is still that this will be a trading range 73000 - 100000 for longer than a retest or even new highs.

BTCUSD: Will Go Up! Long!
My dear friends,
Today we will analyse BTCUSD together☺️
The price is near a wide key level
and the pair is approaching a significant decision level of 94,137.25Therefore, a strong bullish reaction here could determine the next move up.We will watch for a confirmation candle, and then target the next key level of 94,804.43.Recommend Stop-loss is beyond the current level.
❤️Sending you lots of Love and Hugs❤️

BITCOIN/U.S.DOLLAR01) It looks that, bitcoin is currently following AB:CD pattern on daily and weekly time frame.
02) Show a strong reverse from fib golden numbers of retracement with the alignment of bullish trend line.
03) Showing divergence on daily time frame.
04) Break the downtrend resistance line with strong volumes.
05 Creating first wave of Elliot wave, after breaking downtrend line on daily time frame.
Target1 : 109,300
Target2 : 134,722
Stop Loss : 83,000

Bitcoin Surges and Gold Falls: Risk Appetite RisesBy Ion Jauregui – ActivTrades Analyst
Friday’s session sends a clear message to financial markets: risk appetite is roaring back, and investors are shifting their positions accordingly. While Bitcoin heads for its best week since March—fueled by geopolitical expectations and signs of a softer U.S. trade policy—the gold market, traditionally a haven in times of uncertainty, is undergoing a mild pullback from its record highs.
Bitcoin Tops $93,000 and Eyes Weekly Gains
The leading cryptocurrency, Bitcoin (BTC), climbed to $93,300, marking a near 10% gain for the week after briefly touching $94,000 on Wednesday. This rebound represents a sharp reversal from the caution seen in recent weeks and largely reflects a shift in tone from Washington.
President Donald Trump withdrew his threat to remove Federal Reserve Chair Jerome Powell, a move interpreted as an institutional stability signal. He also hinted at potentially lowering tariffs on China, easing market tensions and benefiting higher-volatility assets like cryptocurrencies.
Although Beijing officially denied any trade talks, Bloomberg reports suggest China is considering exempting certain U.S. goods from its 125% tariffs, stoking hopes for a de-escalation. In this context, Bitcoin, which has historically reacted to geopolitical uncertainty and market sentiment, has drawn investor interest as a speculative asset with upside potential amid greater liquidity and less trade friction.
BTC/USD Technical Analysis
A long-term Bitcoin chart reveals that the Fibonacci retracement has returned near the 61.0% level, currently sitting just below it. The Point of Control (POC) is around $84,568, significantly below today’s price of $93,617.
The Relative Strength Index (RSI), at 55.84, shows no signs of extreme overbought conditions. Should the current resistance level be decisively broken, Bitcoin could surge toward $98,000, reclaiming territory lost in late February. Conversely, if momentum falters, a pullback to the 50% Fibonacci retracement—around $90,822, the previous resistance—becomes more likely.
Gold Pulls Back from Record Highs
On the flip side, spot gold fell 0.9% to $3,318.28 per ounce, while June futures slipped 0.6% to $3,328.67. These modest declines come after gold reached a historic peak of $3,500 earlier this week.
The primary catalyst for the pullback has been renewed risk-on sentiment, driven by strong earnings from tech giants Alphabet (+2.5%), Amazon (+3.3%), and Nvidia (+3.6%)—all benefiting from the AI boom and boosting confidence in growth assets.
Additionally, a rebound in the U.S. dollar, which had hit three-year lows, pressured precious metals. Yet gold remains elevated, underpinned by structural factors like persistent inflation, Middle East conflicts, and broader geopolitical tensions.
A New Balance Between Safe Havens and Speculation
This week’s action underscores a temporary shift in investor priorities. With signs of trade détente and no surprises from central banks, capital is moving from defensive assets into higher-return, speculative vehicles such as cryptocurrencies.
Other altcoins have also performed well: Polygon is up 11%, Cardano +4.4%, Solana +2.7%, while Ethereum holds steady near $1,770.
Although the backdrop remains fragile—trade talks remain uncertain and global risks linger—the market’s narrative has turned cautiously optimistic. This shift positions Bitcoin as a hybrid asset, straddling the line between a digital haven and a high-risk investment.
Conclusion
The divergent performance of Bitcoin and gold highlights the market’s current duality: optimism with reservations. If trade-tension relief takes hold, digital assets could see further gains. Conversely, renewed conflict would likely propel gold back into the spotlight as the premier store of value.
*******************************************************************************************
The information provided does not constitute investment research. The material has not been prepared in accordance with the legal requirements designed to promote the independence of investment research and such should be considered a marketing communication.
All information has been prepared by ActivTrades ("AT"). The information does not contain a record of AT's prices, or an offer of or solicitation for a transaction in any financial instrument. No representation or warranty is given as to the accuracy or completeness of this information.
Any material provided does not have regard to the specific investment objective and financial situation of any person who may receive it. Past performance is not reliable indicator of future performance. AT provides an execution-only service. Consequently, any person acting on the information provided does so at their own risk.

Double Top Forming on BTC 1D ChartMy free: Degen Indicator is printing a Double Top on the Bitcoin 1D Chart. This is a very strong signal that price upside is weakening. If Today's candle is Bearish Engulfing along with the second Top signal holding on the next 1D close it will mean that Bitcoin has yet made another Lower High.

Bitcoin (BTC) $95K Target? ETF Inflows & Supply Shock Key Signal
Bitcoin Flashes Bullish Signals: Record ETF Flows and Supply Shock Fuel $95K Target Hopes
Bitcoin, the original cryptocurrency, is demonstrating renewed vigor, capturing investor attention with a confluence of bullish indicators. After a period of consolidation and sideways movement following its all-time high earlier this year, recent data suggests underlying strength is building. Significant inflows into U.S. spot Bitcoin ETFs, a tightening supply on exchanges, strong relative performance against traditional markets, and key technical levels being tested are painting a picture that has analysts eyeing the next major psychological and technical hurdle: $95,000.
ETF Demand Roars Back: A Sign of Renewed Institutional Appetite
One of the most significant developments fueling recent optimism is the resurgence of demand for U.S.-based spot Bitcoin Exchange Traded Funds (ETFs). Launched in January 2024, these products marked a watershed moment, providing traditional investors with regulated and accessible exposure to Bitcoin. After an initial explosive launch, inflows moderated. However, recent weeks have seen a dramatic turnaround.
Reports indicate that these ETFs recently experienced their largest single-day net inflows since their early days in January, signaling a powerful return of institutional and potentially broader retail interest. This influx of capital into regulated vehicles is crucial. It represents sticky, long-term demand rather than just short-term speculative trading. Each dollar flowing into these ETFs effectively removes Bitcoin from the readily available market supply, contributing to a potential supply squeeze.
This sustained demand has also propelled Bitcoin's overall market capitalization significantly. While direct comparisons fluctuate daily and depend on methodology (e.g., including gold, different equity classes), Bitcoin's market cap has grown to rival that of major global corporations and even some traditional asset classes. Its ascent up the ranks of the world's largest assets underscores its growing acceptance and integration into the broader financial landscape. While claiming a specific rank like "5th largest" can be debated based on what's included, there's no denying Bitcoin is now a multi-trillion dollar asset class demanding attention.
The Supply Squeeze: Coins Vanish from Exchanges
Complementing the demand surge is a notable trend on the supply side: Bitcoin reserves held on cryptocurrency exchanges are dwindling rapidly. Data reveals that the amount of BTC available for immediate sale on major trading platforms has plummeted to levels not seen since November 2018. This marks a multi-year low, indicating a strong preference among holders to move their coins into self-custody or long-term storage solutions, rather than keeping them poised for sale.
What's driving this exodus from exchanges? Analysts point to several factors, including the aforementioned ETF accumulation, where authorized participants acquire Bitcoin on the open market to meet ETF share creation demand. Furthermore, there's growing anecdotal and on-chain evidence suggesting accumulation by long-term holders ("HODLers") and potentially public companies adding Bitcoin to their balance sheets. While large-scale corporate buying sprees like MicroStrategy's haven't been widely replicated across the board, the cumulative effect of sustained institutional buying (via ETFs) and dedicated HODLers consistently pulling supply off exchanges creates a powerful dynamic.
Lower exchange reserves typically correlate with reduced selling pressure. When less Bitcoin is readily available to be sold, even moderate increases in demand can have an outsized impact on price. This scarcity factor is a core tenet of Bitcoin's value proposition, underpinned by its fixed supply cap of 21 million coins, and the current trend highlights this dynamic in action.
Relative Strength: The "Cleanest Shirt in the Dirty Laundry"
Bitcoin's recent performance also stands out when compared to traditional financial markets. Over the past 30 days (as per the provided context), Bitcoin has posted significant gains (e.g., +7.68%), while major equity indices like the S&P 500 and the tech-heavy Nasdaq have experienced notable pullbacks (e.g., -6.79% and -8.14%, respectively).
This divergence has led some commentators to describe Bitcoin as the "cleanest shirt in the dirty laundry pile." In times of macroeconomic uncertainty, geopolitical tension, or wavering confidence in traditional financial systems, Bitcoin can attract capital seeking alternatives or hedges. While its correlation with risk assets like tech stocks has often been high, periods of decoupling, like the one observed recently, suggest investors may increasingly view Bitcoin through a different lens – perhaps as a non-sovereign store of value or a bet on future technological disruption, rather than just another high-beta risk asset. This relative outperformance can attract momentum traders and further bolster positive sentiment.
Technical Hurdles: The Road to $95K
From a technical analysis perspective, Bitcoin's price action is generating significant discussion. One key metric analysts watch is the "realized price," particularly for short-term holders (investors who acquired BTC relatively recently). When the market price surpasses the average acquisition cost of these recent buyers, it can signal a shift in market psychology. Those who bought recently are now in profit, potentially reducing sell pressure and encouraging further buying. Bitcoin recently surpassed this level, leading to speculation about whether this marks the beginning of a sustained rally or potentially sets up a "double top" scenario – a bearish pattern where an asset fails twice to break above a certain resistance level.
Analysts are closely watching specific price levels. There appears to be a consensus around a key resistance zone that, if decisively reclaimed and held, could signal that "all bets are off" for the bears, potentially opening the door for a significant upward move. Conversely, failure to break through these levels, or a strong rejection from them, could lead to a pullback, validating the warnings from more cautious analysts.
The $95,000 mark looms large as the next major psychological and potential technical resistance area should the current momentum continue and key lower resistance levels be overcome. Reaching this target would likely require a confluence of the factors already discussed: continued strong ETF inflows, further depletion of exchange supply, supportive macroeconomic conditions (or continued relative strength despite macro headwinds), and a decisive break through established technical resistance zones.
What Triggers the Breakout?
Achieving a breakout towards $95,000 isn't guaranteed and likely requires several catalysts:
1. Sustained ETF Demand: Continued, consistent net inflows into spot Bitcoin ETFs are paramount to absorb supply and signal ongoing institutional conviction.
2. Supply Shock Intensification: If exchange reserves continue to fall sharply, the scarcity narrative strengthens, potentially triggering FOMO (Fear Of Missing Out) buying.
3. Macroeconomic Shifts: A dovish pivot from central banks, renewed inflation fears driving demand for hard assets, or further instability in traditional markets could push more capital towards Bitcoin.
4. Technical Confirmation: A convincing break and hold above currently watched resistance levels would give technical traders confidence and potentially trigger algorithmic buying.
5. Positive Regulatory Developments: While the ETFs were a major step, further regulatory clarity or positive developments globally could reduce perceived risk.
Conclusion: Optimism Tempered with Caution
The current Bitcoin landscape presents a compelling bullish case. Resurgent ETF demand, dwindling exchange supply creating a scarcity effect, and strong relative performance against traditional assets paint an optimistic picture. Technical indicators, such as surpassing the realized price of recent buyers, add fuel to the fire, bringing targets like $95,000 into the conversation.
However, caution remains warranted. Bitcoin is notoriously volatile, and technical resistance levels often prove formidable. The risk of a "double top" or rejection at key levels is real, and regulatory headwinds or negative macroeconomic shifts could quickly alter sentiment. While the confluence of positive factors is undeniable and the path towards $95,000 seems plausible given the current dynamics, investors will be keenly watching whether ETF flows remain strong, supply continues to tighten, and crucial technical levels can be decisively overcome. The interplay between institutional adoption, HODLer conviction, and market technicals will ultimately determine if Bitcoin can conquer its next major milestone.

Do you want BTC to drop on April 27 or May 11?Do you want BTC to drop on April 27 or May 11?
If it drops on April 27, BTC will decline sharply. If it drops on May 11, BTC will only correct on the D1 timeframe and then continue rising on the weekly timeframe.
Which option do you choose?

BTCUSD 1H Forecast Hello guys, I hope years are well let me tell you that right now the order is stuck at the Bearish OB, so we will sell from here and this will remain our target until the Bullish OB and after that, our next target will remain ours until the resistance area.

BTCUSD Eyes Liquidity Sweep as Bulls Push Into Supply ZonesBTCUSD DAILY TECHNICAL ANALYSIS 📊
OVERALL TREND
📈 UPTREND — Momentum has surged, with multiple bullish candles breaking out above prior consolidation. Structure suggests a bullish continuation unless rejected at key resistance.
📉RESISTANCE ZONES
🔴 109,618.40 — PIVOT HIGH | Resistance Level
🔴 107,877.89 — SELL ORDER II
🔴 104,355.29 — SELL ORDER I
📈SUPPORT ZONES
🟢 102,576.04 — EXIT BUY | TP 4
🟢 96,169.15 — BUY ORDER | TP 3
🟢 92,012.50 — BUY ORDER | TP 2 | Mid-Pivot
🟢 86,027.66 — BUY ORDER | TP 1
🟢 79,908.44 — BUY ORDER II
🟢 76,167.19 — BUY ORDER I
🟢 74,406.60 — PIVOT LOW| Support Level
📊OSCILLATOR SIGNALS
RSI: 67.98 — Neutral, approaching overbought
MACD: 1,629.47 — 📈 Bullish crossover
Momentum: 10,006.19 — 📈 Strong upward push
Stoch RSI: 100.00 — 🔄 Extremely overbought, caution warranted
Williams %R: −5.30 — 🔻 Sell signal (overbought territory)
📈MOVING AVERAGES ALIGNMENT
All major EMAs & SMAs (10 through 200) are flashing BUY
HMA (9): 92,191.54 — supports current bullish thrust
Ichimoku Base: 84,535.45 — below price, further confirms bullish bias
🤓STRUCTURAL NOTES
BTCUSD has cleared a long-term pivot range with conviction — first time in over 2 months Price now testing supply zone between 102K and 104K
Break above 104K could trigger acceleration toward 107.8K and possibly 109.6K
Pullback scenarios would likely retest 96.1K or 92K (TP zones 2 & 3)
TRADE OUTLOOK 🔍
📈 Long bias remains strong above 92,012 with targets toward 107.8K and 109.6K
📉 Short-term profit-taking or rejections possible in 102.5K–104.3K zone
👀 Watch for confirmation of breakout or rejection from dynamic resistance at 109.6K
🧪STRATEGY RECOMMENDATION
CONSERVATIVE BULLISH PLAY:
— Entry: 92,012.50
— TP Targets: 96,169 / 102,576 / 104,355
— SL: Below 86,027
AGGRESSIVE SWING SCALP:
— Sell Orders @ 104,355 or 107,877
— TP: 96,169 / 92,012
— SL: Above 109,618
“Discipline | Consistency | PAY-tience™”
