BTC Bitcoin COT dataCOT data shows large negative divergence with small positive
Suggesting we ended Wave A on April 9th and we're in B now
With large devastating C down coming soon
BEARUSD trade ideas

Bitcoin short from 95500$Waiting for 95.5k npoc level and i am entering short , target 91k and 86k.
Lets see what this pump brings on.
We can also see 98k npoc close , if that does more agressive on shorts.

Forget Tariffs: Why Bitcoin Cares More About ETFs Than EarningsBitcoin's Great Decoupling: Why It Ignores Tariffs and Earnings, Fueled by Fundamentals and ETF Billions
In the complex tapestry of global finance, assets typically dance to the tune of macroeconomic news, central bank policies, corporate earnings reports, and geopolitical tensions like trade tariffs. Stocks rise on strong profits, bonds react to interest rate shifts, and currencies fluctuate with trade balances. Bitcoin, however, increasingly appears to be charting its own course, seemingly indifferent to the traditional market drivers that dictate the movements of legacy assets. This phenomenon, often termed "decoupling," isn't just a statistical anomaly; it's rooted in Bitcoin's fundamental nature and is gaining significant validation through the burgeoning success of US-listed Bitcoin Exchange Traded Funds (ETFs).
The core argument, as highlighted in recent market commentary, is compelling: Bitcoin's value proposition isn't tied to quarterly earnings calls, CEO performance, or the potential impact of import tariffs. It has no central bank adjusting its supply or setting its interest rate. Instead, its perceived value stems from a unique set of characteristics: verifiable digital scarcity capped at 21 million coins, a decentralized network resistant to single points of failure or control, and an emerging role as a neutral, global reserve asset in an increasingly politicized and fragmented world.
Fundamentals Over Fleeting News Cycles
Traditional assets are intrinsically linked to the health of economies and corporations. A weak earnings report can send a stock tumbling, while fears of a trade war can ripple through entire sectors. Bitcoin exists outside this framework. Its "earnings" are the security and finality provided by its blockchain; its "management" is the distributed network of miners and nodes enforcing consensus rules; its "monetary policy" is embedded in its immutable code.
This inherent separation means that while traditional markets might gyrate based on the latest Federal Reserve announcement or geopolitical flare-up, Bitcoin's trajectory is often more influenced by factors specific to its own ecosystem: adoption rates, network upgrades, regulatory clarity (or lack thereof), halving events that reduce new supply issuance, and, crucially, capital flows into vehicles that provide access to it.
The narrative suggests Bitcoin is maturing into something akin to a digital version of gold – an asset valued for its scarcity and neutrality, acting as a potential hedge against inflation, currency debasement, and systemic risks within the traditional financial system. In a world grappling with high debt levels, persistent inflation, and geopolitical instability (like the mentioned US trade war volatility), the appeal of a non-sovereign, mathematically scarce asset grows.
ETF Inflows: A Roaring Stamp of Approval
The most potent evidence supporting this decoupling narrative and Bitcoin's growing acceptance comes from the recent performance of US spot Bitcoin ETFs. Launched earlier in the year, these products represented a watershed moment, providing regulated, accessible exposure for institutional and retail investors alike through traditional brokerage accounts.
Recent data underscores their impact. On April 21st, these ETFs collectively witnessed their largest single-day net inflows since the initial launch frenzy in January, pulling in a remarkable $381.3 million. This surge in demand, with notable contributions like the $116.1 million flowing into the RK 21Shares Bitcoin ETF (ARKB), coincided directly with significant positive price action. Bitcoin decisively broke through previous resistance levels, reclaiming the $91,000 mark after a seven-week consolidation period.
These inflows are more than just numbers; they represent a tangible shift in capital allocation. They signal growing institutional comfort and strategic positioning in Bitcoin. Unlike speculative futures-driven rallies, inflows into spot ETFs reflect direct demand for the underlying asset, potentially building a more stable foundation for price appreciation. This influx suggests investors aren't just chasing momentum but are making longer-term allocations, viewing Bitcoin as a legitimate component of a diversified portfolio, independent of its correlation (or lack thereof) to other asset classes.
Price Action, Leverage, and the Path Ahead
The technical picture for Bitcoin has brightened considerably alongside these fundamental drivers. The recent surge saw Bitcoin break key bearish structures, establishing a higher low that many traders see as a potential launchpad for challenging previous all-time highs. The reclaiming of the $91,000 level was a significant psychological victory for bulls, reinforcing the positive sentiment fueled by the ETF flows. Market participants are now eyeing levels like the yearly open around $93,000 as the next major hurdle.
However, caution remains warranted. Analysts note that recent price surges have often been accompanied by significant leverage in the derivatives market. While leverage can amplify gains and accelerate upward moves, it also increases volatility and the risk of sharp liquidations if the market turns. The critical question is whether the consistent spot buying, particularly through ETFs, can absorb selling pressure and provide the underlying support needed to sustain these higher price levels. A rally built predominantly on leverage without corresponding spot demand is often viewed as less stable.
The comparison to gold's comeback potential amidst trade tensions is intriguing, but Bitcoin still needs to prove its resilience. While it has demonstrated periods of acting as a safe-haven asset, its correlation to risk assets like tech stocks can reappear, especially during broad market liquidity crises. The "decoupling" is not absolute, but rather a dominant trend driven by its unique value proposition gaining traction.
Conclusion: A Maturing Asset Forging Its Own Path
Bitcoin's recent performance, marked by significant ETF inflows and a price surge seemingly disconnected from traditional market anxieties like tariffs and earnings reports, lends strong support to the decoupling narrative. Its fundamental characteristics – scarcity, decentralization, and neutrality – are increasingly resonating in a complex global environment. The success of spot Bitcoin ETFs provides a regulated gateway for broader adoption and serves as tangible proof of growing institutional and retail demand, validating Bitcoin's role as an emerging reserve asset.
While challenges remain, including inherent volatility, regulatory uncertainties, and the need for spot demand to underpin leverage-driven moves, the trend is undeniable. Bitcoin is increasingly trading based on its own unique supply/demand dynamics and its perceived role in the future financial landscape, rather than simply mirroring the movements of traditional markets. It doesn't care about Q3 earnings or new import duties because its value proposition exists on a different plane. As capital continues to flow in via accessible vehicles like ETFs, recognizing its distinct properties, Bitcoin's journey towards becoming a truly independent, globally significant asset class continues, one block at a time.

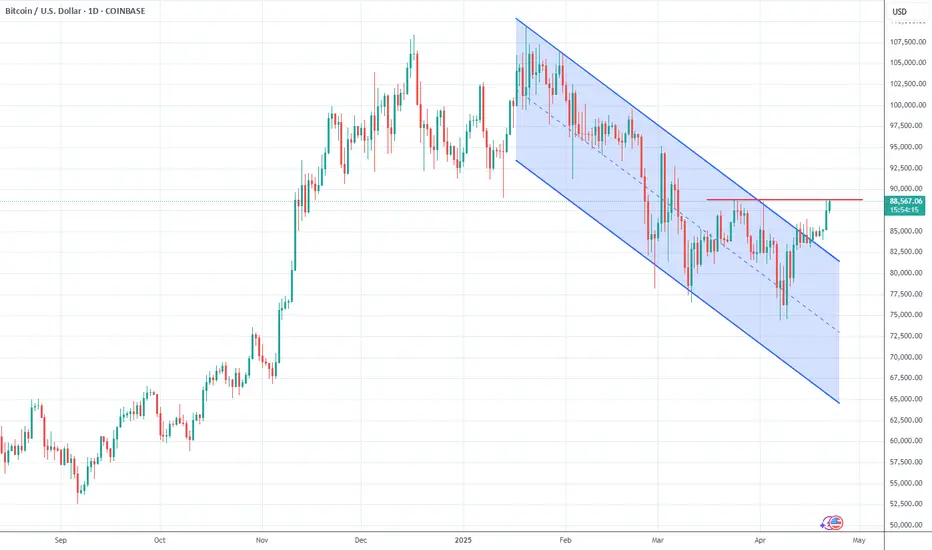
$BTC Is Bullish Again — Momentum Building?Bitcoin ( BITSTAMP:BTCUSD ) is back with bullish momentum — and the charts are starting to show real strength.
🟢 Key bullish signals:
• Breakout above recent bearish channel resistance on daily chart
• Strong volume confirmation
🧠 Sentiment is shifting — fear is cooling off slighthly, and traders are eyeing higher targets.
📍 What I'm watching next:
• FWB:88K level is double top pattern neckline. Or there is a possibility that the price would bounce from the level and make another try to break it while forming head and shoulder pattern. We will see. But either way the level acts as neckline and the break would confirm a bullish move.
But let’s not forget: CPI data & macro events can still shake the market short term. Stay sharp.
Are you riding the wave or waiting for a retest?
Let me know your game plan below 👇
BTC/USD Price Action Update – April 29, 2025📊BTC/USD Price Action Update – April 29, 2025
🔹Current Price: 94,371.51
🔹Timeframe: 1H
📌Key Supply Zone (Resistance):
🔴95,781.91 – Major Resistance (previous swing high)
📌Key Demand Zone (Support):
🟢91,711–92,122 – Strong Demand Zone (major bullish origin area)
📈Bullish Outlook:
Price is consolidating between resistance and demand. If BTC holds above 94,000 and builds bullish momentum, we could see a retest of the 95,781 high. Breakout above 95,781 may trigger further upside.
📉Bearish Outlook:
Failure to hold 94,000 could lead to a drop toward the 91,711–92,122 demand zone. Watch for reaction at demand to find potential reversal opportunities.
⚡Trade Setup Tip:
✅Wait for clean break and retest above 94,500 for bullish continuation
✅Look for longs at 91,711–92,122 with confirmation
✅Use stop-loss carefully to protect against sharp moves
#BTCUSD #BitcoinAnalysis #CryptoTrading #SmartMoneyConcepts #PriceAction #FXFOREVER #CryptoUpdate #SupplyAndDemand #BreakOfStructure #MarketUpdate

BTC - don’t be fooled by the 95,000 hitNow that BTC hit 95,000, many will think it will just go from here.
But not yet as this 95,000 is just a normal retracement and will comfortably settle down to 91,277. The blue line is a copy trend line from Oct 10th to Dec 19th previous move and this current moment is following it nicely. By Friday May 2nd, I suspect we will see a rally that could lead us into 117,000. Only time will tell if I am correct.


btcusdAh, you're likely interested in liquidity in the context of this Bitcoin chart! Here's what we can infer about potential liquidity based on your setpoint:
* Above the Resistance Zone (around 95,878): The red resistance zone often coincides with areas where sellers are likely to have limit orders placed. If the price breaks above this zone, it could trigger those orders, leading to a burst of selling volume and potentially a sharp move downwards. This area could represent a pool of sell-side liquidity.
* Below the Support Level (around 93,919): Similarly, the black support line might attract buyers looking to enter the market or add to their positions. If the price breaks below this level, it could trigger stop-loss orders from buyers, resulting in significant selling pressure and a rapid price decline. This area could represent a pool of buy-side liquidity.
* Areas of Consolidation: The sideways price action within the range defined by your support and resistance levels suggests periods where buying and selling forces are relatively balanced. These periods can build up liquidity as more orders accumulate within that range. A breakout from this consolidation could then trigger a significant move as this built-up liquidity is absorbed.
* "BUY" Signals and Liquidity: Your "BUY" signals might be strategically placed to anticipate moves that could tap into existing liquidity. For example, a buy signal near the support level could be aiming to capitalize on a bounce driven by buy-side liquidity.
In essence, your support and resistance levels are key areas to watch for potential liquidity grabs. A break beyond these levels could indicate a significant influx of volume as resting orders are triggered.
Keep an eye on how the price interacts with these zones and any significant volume spikes that might confirm the triggering of liquidity.
Is there a specific type of liquidity you're interested in, or perhaps how to trade around these levels?

bitcoin bull market topLooking for October 2025 to be the end of this bull market. 1057 days ( doesn't have to be exact days), that's how long it took for the bull run -the last 3 cycles. So, going by that, we've got till October for this bull market to end. Yes, a lot of indicators show bearish signs, and that we might be in a bear market already, but I believe we still have power left in us

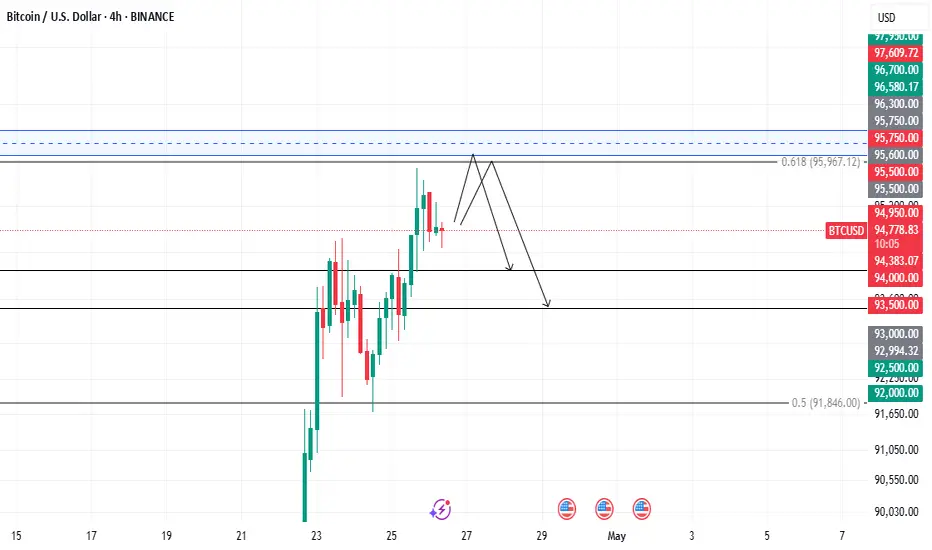
BTCUSD ANALYSIS🚨 BTCUSD Technical Update! 🚨
Traders, pay close attention! 👀
Here’s what the latest 1H chart is showing us:
🔹 Bitcoin is consolidating around 94,700–94,800
🔹 Potential double top structure forming near the 95,600–95,750 zone — MAJOR resistance ahead!
🔹 If Bitcoin fails to break and sustain above this resistance, we could see a sharp drop towards the first support at 94,383 🔻
🔹 A break below 94,000 could accelerate selling pressure — next downside target near 93,500! 🎯
⚡ Plan your trades smartly!
⚡ Wait for confirmations — either breakout or rejection from the resistance zone!
🔥 Volatility Incoming! Stay Alert and Manage Risk Wisely! 🔥
BTCUSD FORECAST 26APRIL 2k25Targeting short : targeting area remark.
Reason : Btcusd has been rally up for more than 8 hours and previous daily candle showing weak bull momentum.

$BTC - Road to $140K#Bitcoin will hit $140K but needs to firstly close above GETTEX:87K and above $109K with a mandatory retest of $106.5K DYOR.
Perfect retest of previous resistance as support backs my idea for the next bull run, although the aforementioned terms are obligatory.

BTC/USD Swing Trade – Ride the Rebound Before the Next Breakout🚀Bitcoin just reminded the world who’s boss. After brushing up against $94K, it’s taking a breath—and for swing traders, that’s the moment to load the slingshot.
We’re not chasing green candles. We’re positioning at smart levels that offer real upside when the next wave kicks off. With institutional flows increasing and volatility offering cleaner setups, the chart tells a story of momentum with room to reload.
📥 Strategic Entry Zones:
$87,000 – Current support just below recent highs; ideal for an early swing
$77,000 – Mid-range pullback and psychological threshold
$62,000 – The ultimate opportunity zone if volatility spikes hard
🎯 Profit Targets:
$100,000 – A clean round number and breakout point
$105,000 – Stretch target aligned with macro bullish continuation
$115,000+ – Ambitious but not impossible—especially if halving hype and ETF flows stay strong
This isn’t just about price—it’s about timing, conviction, and being ready while others hesitate. Remember, Bitcoin doesn't whisper when it moves... it roars.
⚠️ Disclaimer: This content is for informational and educational purposes only and does not constitute financial advice. Cryptocurrency trading carries significant risk and may not be suitable for all investors. Always do your own research and consider speaking with a licensed financial advisor before making trading decisions.

BTCUSD POSSIBLE TRADE SETUPPotential Trade Setup on BTCUSD
The price has successfully retested the $75,000 region however to complete the corrective wave we can expect to see BTC drop further to the $70,00 before another round of bullish runs.
A BUY trade opportunity is best looked at after the full retest of the $71k and $70k region before I begin to buy Bitcoin
However, the SELL opportunity is clear below FWB:65K which can be regarded as 202 extreme dip.
You may find more details in the chart!
Thank you and Trade Responsibly!
❤️PS: Please support with a like or comment if you find this analysis useful for your trading.

BTC IMPRESSESBitcoin continues to impress on the daily chart.
After breaking through both the long-term descending trendline and the key resistance at $88,804, price has now clearly confirmed a higher high – officially shifting the market structure back to bullish. It’s also holding well above both the 50-day and 200-day moving averages, showing strong momentum behind the move.
The breakout came on a surge of volume, validating the move and signaling genuine interest from buyers. While we could see a short-term pause or retest of the $88,804 level, the current strength suggests bulls are back in control – at least for now.

Enhanced Trend Indicator – Bullish Continuation Setup on BTC/USDThis chart highlights a bullish continuation setup on BTC/USD using the Enhanced Trend Indicator – Reversal & Volume Logic (invite-only).
After a period of sideways price action and accumulation, the price began to shift upward with confirmed volume, moving average alignment, and multiple confluence-based green triangle signals. These signals only print when trend, structure, and volume agree — filtering out false entries in low-conviction zones.
Thought Process:
Trend Confirmation – The EMA20/SMA50/SMA200 alignment shifted bullish after reclaiming structure near the $91,500–$92,000 range.
Signal Confluence – Multiple green triangle entries occurred along the rising support zone, showing synchronized strength.
Volume Backing – Breakouts occurred on higher-than-average volume, increasing the quality of each signal. BINANCE:BTCUSDT
Trade Setup (Hypothetical):
Entry Zone: $93,000–$93,200 (confirmed continuation signal on MA reclaim)
Initial Target: $94,500–$95,000 based on prior swing high and trend slope
Stop-Loss Area: Below $91,500 trendline support and MA cluster zone
This setup favors continuation as long as BTC remains above the rising trendline and the moving averages hold structure. A breakdown below $91,500 could invalidate the setup or transition into a consolidation range.
This post is for educational purposes only and does not constitute financial advice. Always do your own analysis and use risk management.

uptrendGiven the current upward trend, it is expected that the continuation of the upward trend will take place according to the specified paths and according to the price behavior in the resistance ranges.

BTC Market Outlook: Bullish Breakout or Bearish Breakdown?This idea analyzes Bitcoin's (BTC) potential market direction using a combination of RSI, MACD, and trend lines, with the 0.6 Fibonacci retracement level as key support. The Relative Strength Index (RSI) is monitored for overbought/oversold conditions, while the Moving Average Convergence Divergence (MACD) highlights momentum shifts and potential crossovers. Trend lines are drawn to identify critical resistance and support zones, with the 0.6 Fib retracement acting as a pivotal support level. A bounce from this level with bullish RSI divergence and a MACD crossover could signal a bull market continuation, targeting new highs. Conversely, a break below 0.6 Fib support, accompanied by bearish RSI and MACD confirmation, may indicate a bear market, with downside targets at lower support zones. Watch for volume spikes and price action at these levels to confirm the trend.

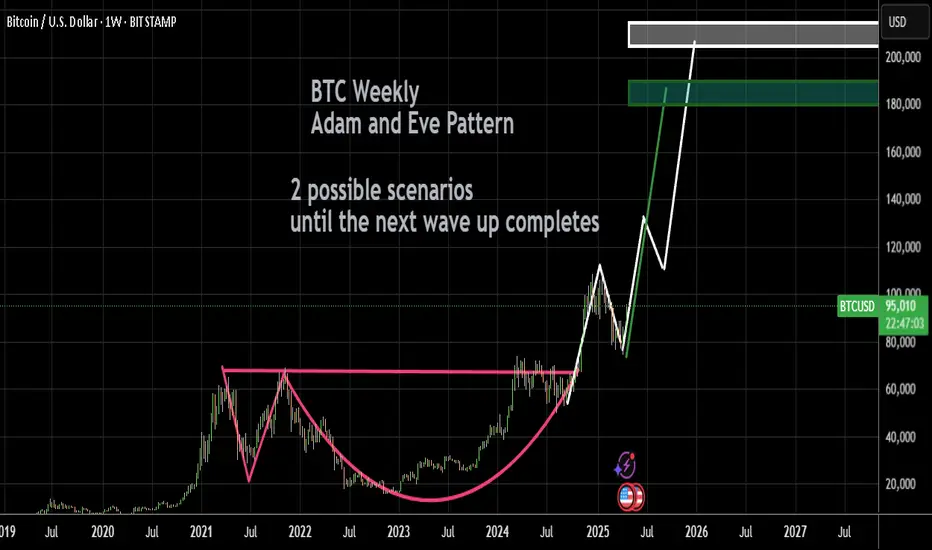
BTCUSD Weekly Analysis Targeting; 94k - 96k, Followed By 109k
BTCUSD Weekly Analysis
Bitcoin is currently trading around $88,638, showing strong recovery momentum after bouncing off the key 61.8% Fibonacci retracement level at $74,412, often referred to as the “golden pocket.” This bounce suggests that buyers are stepping in aggressively at this support zone, which has historically acted as a major turning point in bullish market structures.
On the upside, BTC has now reclaimed the 38.2% retracement level at $87,375, turning it into a short-term support zone. Holding above this level gives Bitcoin a clear path toward the next key resistance at $94,430, followed by a stronger resistance cluster around $96,211, where both Fibonacci and historical horizontal resistance align.
Technically, the weekly chart also confirms a breakout above the descending trendline, adding confluence to the bullish reversal. This move aligns with the Inverse Head & Shoulders pattern seen on the daily chart — a classic bullish formation that typically leads to strong upward continuation.
If BTC continues to hold above $87,000, the next short-term target would be $94,000–$96,000, and if that level breaks with volume, Bitcoin could be gearing up for a retest of its previous highs around $109,000. On the downside, $81,145 (50% retracement) and $74,412 (61.8%) remain critical support levels, with any break below $74K shifting the outlook back to bearish.
The chart structure, key Fibonacci zones, and bullish reversal pattern all point toward continued upside, with BTC needing to maintain above GETTEX:87K to sustain the bullish trend.

BTC latest analysis strategy signalBitcoin has reclaimed the $90K–
92K
zone after a sharp 32% correction from its all-time high, closing the week strongly above this critical area.
As long as price holds above $90,000, the primary bias remains bullish. The $90K–
92K
area now acts as a key support zone, ideal for pullback buying opportunities.
A breakout above $101,000 could trigger a strong acceleration toward the next major targets at $115K–$125K.
A weekly close below the green support zone would invalidate the bullish scenario and suggest caution.

Bitcoin's Next TargetBTC starts the week with a 4H doji, potentially signaling a reversal of the short term retracement from local Hs around $95.4k.
Reclaiming those Hs can easily lead to a retest of Feb's resistance around $98.7k - or even surprise us with a test of $102k.
A loss of momentum and close below GETTEX:92K could signal weakness.