Upcoming uptrend for BitcoinBitcoin’s price appears ready for a significant move upward, and the indicator is about to flash signal that reinforce this bullish outlook. Historically, QSTS has proven effective at identifying key market shifts through its unique blend of quantitative trend strength and sentiment analysis. Recently, it has been showing strengthening bullish momentum, with volume-weighted buy signals emerging across multiple timeframes—often a precursor to sustained upward trends.
What makes this particularly compelling is the confluence of these signals with macro and on-chain dynamics. Post-halving supply constraints, increasing institutional inflows, and mounting interest in spot Bitcoin ETFs are all aligning with QSTS momentum triggers. This convergence suggests that the market is entering a new phase of accumulation and breakout potential. When QSTS prints a buy signal following consolidation periods—especially after sideways price action—it often marks the start of strong bullish legs. If these signals hold, Bitcoin may be gearing up for an explosive move higher very soon.
BEARUSD trade ideas

Bearish FinTech 50 DMA < 200 DMAduring the bear markets I lived through 87,2K, 2008-2010 I had to learn how to detect bear market conditions, the easiest and simplest if when the 50 EMA crashes down through the 200 EMA.
Another indicator of a Bear Market is a flight to quality gold and silver... check that's 2.
We have a head and Shoulders, price is falling down and possibly through the 50 EMA. H & S is #3
The blue line is the 100 DMA (I use DMA or EMA) if this crashes through the 200 that's even more bearish.
This happening means we should not be long, all things being equal I think we will go down.

Bitcoin Bearish Reversal Setup: Rising Wedge Breakdown Targeting1. Entry Point:
Marked around $86,853, this is where a potential short (sell) trade might have been initiated.
2. Stop Loss:
Placed above $88,783, protecting the trade in case the market goes against the position.
3. Target Point (Take Profit):
Aiming down toward $74,443.76, suggesting a large bearish move is anticipated.
4. EMA Indicators:
30 EMA (Red Line) at ~$84,271: Indicates short-term trend.
200 EMA (Blue Line) at ~$83,496: Indicates long-term trend.
Price is currently trading above the 200 EMA but slightly below the 30 EMA, showing mixed short-term momentum.

BITCOIN Sell everything in October!Yep, kind of a clickbait title but it doesn't fail to serve justice to this very important Bitcoin (BTCUSD) chart.
Today's analysis displays in the most illustrative way the extremely tight symmetry between BTC's Cycles and how this can help us time our Sell at the Top of the Cycle and equally have the patience to buy as close to the next Bottom as possible.
As you see, in the past +10 years since the 2014 Bear Cycle, every Cycle has almost identical time ranges/ durations. All three Bear Cycles since then, lasted for approximately 1 year, and both Bull Cycles for almost 3 years (152 weeks, 1064 days to be exact). More specifically, the last two Bear Cycles were exactly 1 year long, the 2018 one started on the week of December 11 2017 and ended on December 10 2018 and the next Bear Cycle started on November 15 2021 and ended on November 07 2022. So it's been December-to-December and November-to-November Bear Cycles respectively.
If this high degree of symmetry continues to hold, counting 1064 days from the last Cycle Bottom o November 07 2022, gives a time estimate for the next Cycle Top on (the week of) October 06 2025. If also that holds for the Bear Cycle, expect an October-to-October duration, with an approximate bottom on October 12 2026.
So Sell everything up to October 2025 and Buy back as we get close to October 2026 is the strategy?
Feel free to let us know in the comments section below!
-------------------------------------------------------------------------------
** Please LIKE 👍, FOLLOW ✅, SHARE 🙌 and COMMENT ✍ if you enjoy this idea! Also share your ideas and charts in the comments section below! This is best way to keep it relevant, support us, keep the content here free and allow the idea to reach as many people as possible. **
-------------------------------------------------------------------------------
💸💸💸💸💸💸
👇 👇 👇 👇 👇 👇

Wyckoff accumulation on BCTAccording to Wyckoff theory, we should get a bullish move on BTC from here.
SL below last low. Targeting at least the high of the Automatic Reaction.

Unveiling Crypto Market Insights - Bitcoin's Descending ChannelGM Market Enthusiasts,
In today’s update, we turn our attention to Bitcoin’s evolving trend. Since the end of February, BTC has been tracing a steady pattern of lower highs and lower lows. Currently, it remains below the 200-day simple moving average , consolidating around the 85K mark — a zone that has served as a resistance in recent days.
The big questions now are:
When will this downtrend lose its grip? At what point might Bitcoin reclaim ground above the 200DMA?
How long do you expect BTC to remain within this descending channel? And when the breakout comes — which direction will it take?
We’d love to hear your thoughts — where do you see Bitcoin heading next?

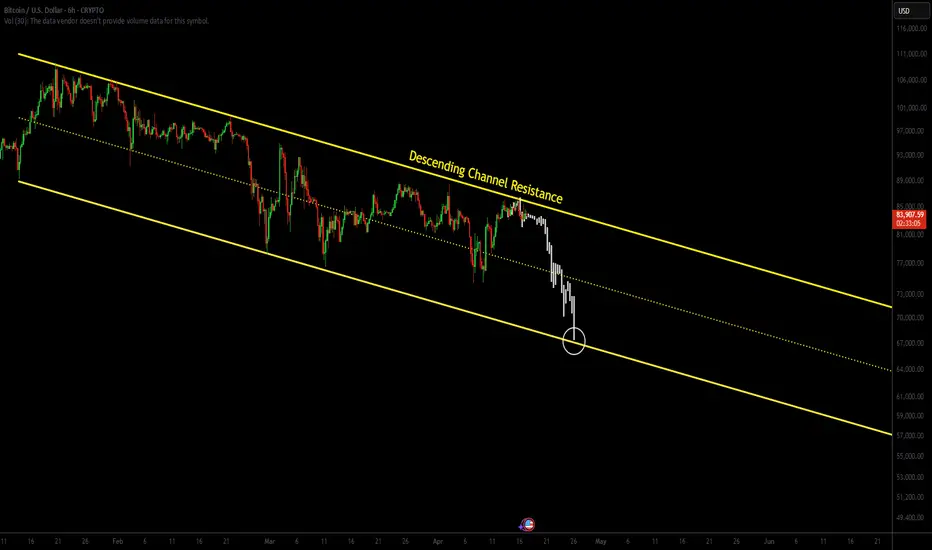
Bitcoin Pressing Against Descending Channel ResistanceIn today’s analysis, we examine Bitcoin’s price action as it continues to respect a descending channel pattern. With current price consolidating at the upper boundary of this channel, traders are now questioning whether BTC will break out or reject and rotate lower.
Key Points Covered in This Article:
- Bitcoin is currently consolidating at resistance of the descending channel
- A break of the recent swing low could lead to a drop to $67,400 support
- Confirmation of bullish breakout requires volume-backed move above channel resistance
Bitcoin is currently pressing into the top boundary of a descending channel, where resistance is holding firm. On the lower time frame, price action has entered a period of consolidation — a key sign of indecision. However, from a structural point of view, resistance remains resistance until broken. A failure to break through the upper boundary could accelerate downside momentum.
Should the current swing low be breached, traders can expect a move toward the lower boundary of this descending channel, situated around $67,400. This level will act as the next significant support, and it may provide a potential entry for reversal plays, depending on how price behaves upon reaching it.
For bullish continuation to occur, Bitcoin must decisively break above the descending channel with strong volume confirmation. Without this signal, any moves to the upside may be short-lived and potentially lead to liquidity grabs before another rotation lower. Traders should stay patient and wait for either a clear breakout or confirmation of further downside before entering positions.
SON OF A BIT PT2: gotcha BIT entry was off in prior short
but i gotcha this time re entry to -18% to -27% stardom
sorry bulls

Bitcoin :: Daily chart Bitcoin ::: Daily Chart Buy setup- wait for breakout (91500 to 92500 )and buy

BTC is in strong support area based Fib RetracementHi again, for a long time I don't share my ideas here, so I'm trying to consistent share my thought here.
Technical
BINANCE:BTCUSD in strong support line based Fib Retracement on $76,113.25 (on daily Timeframe)
The price currently below the EMA 200
MACD still doesn't give the sign to long
BTC Dominance still high (60.39% based on Coinstast )
Macro
Based on similiar correlation with S&P500, it's still give no good sign to bounce back (it maybe going deeper)
About the global economy, US Tariff still give the global uncertainty and cold vibes haha
Summary
If you going long term, maybe you can go buy BTC in small size, is a good price to add the collection
If you going short term, I think it will be go deeper first
Thanks for your time!
I hope everyone have a good time and good health!

BTCUSD next move(expecting a bearish move)(16-04-2025)Go through the analysis carefully, and do trade accordingly.
Anup 'BIAS for BTCUSD (16-04-2025) (MID TERM)
Current price- 83,800
wait for the break-out
"if Price stay below 85,800 then next target is 81800, 79,800 and 76000 above that 88,000.
-POSSIBILITY-1
Wait (as geopolitical situation are worsening )
-POSSIBILITY-2
Wait (as geopolitical situation are worsening)
Best of luck
Never risk 2% of principal to follow any position.
Support us by liking and sharing the post.

BTC Elliott wave analysis 4/19/2025I think now we have come to the Wave B of the Big 4 wave. So I think we might be going down to the micro b for a bit before going up to micro c to complete the C wave around 96000-97000 And then we will going down to the Wave C of big 4 wave around 71,000-69000 before we have the big 5 wave of the Grand Super Cycle

BTCUSDselling BTCUSD
sl 85700
tp 75849
1% risk on each trade
like an follow
short on btc/usd
NOTE: Like in life, risk management
is important if a forex trader wishes to survive.
BTC USD buytradeBTC has broken structure to the upside, so I'm looking for a long trade in 15 minutes after the price reaches the FVG.
BTC vs Nikkei 225 strong match for declineI've been using the Nikkei 225 for at least 2 years to make forecasts as the big players have been involved in the Japanese Carry Trade.
Gains in the Japanese Nikkei 225 equity market have carried onto Bitcoin BTC.
Now I am afraid BTC could collapse from 120k and above to well under 50k. Not just for a short duration but permanently. It will begin with a volatile ABC, but could commence into a deep wave 3 down, where waves before the ABC is wave 1.
You should be considering selling all your Bitcoin BTC and Crypto.
There will be no come back from this.
I'd advise followers to make use of the following SHORT methods.
1. Use Short ETF's were you cannot be scam wicked.
2. Only use European Style Put Options on short durations e.g Derebit.
3. MSTR Option Shorts and Short ETFs will be a good way to capitalize on this volatility.
Be aware that the majority of exchanges are going to go bust from this event.
It would be advisable to solely trade on a ON RAMP exchange or with a reputable Stock Broker that has insurance or Gov payback schemes on your fiat.

BTC/USD - The Bitcoin Cycle TopBTC has recently broken below a key uptrend line that had been guiding price for some time. I’m watching for a potential backtest of that broken trendline, a rather classic move that could set the stage for a final upwards squeeze, possibly printing a quick higher high to trap late longs.
I’m watching the circled area closely as a potential exhaustion zone. Key levels and price action around the trendline will be critical, breaking of upwards trendlines after backtesting may mark the beginning of the larger unwind.
We could see multiple backtests of the broken trendline over time, with the trendline now likely acting as resistance.
Note: I’m publishing this idea simply to have a timestamped record. This post is my way of putting a clear marker in the sand. I’m not looking to debate or go deeper into the reasoning, and I generally won’t be responding to comments.

Bitcoin: The Grand Ascension Blueprint - Ready for Lift-Off!
The Most Important Bitcoin Chart You'll See This Year.. As we said before in pervious idea for enrty in 74,500
and that what happen in one month
Looking at this daily BTC/USD chart, we're witnessing the formation of a powerful technical setup that could define the rest of 2025. This isn't just another prediction—it's a strategic roadmap based on key technical levels that smart money is watching.
📊 What The Chart Is Revealing:
🔷 Perfect Channel Formation
* Bitcoin has established a massive ascending channel (gray boundaries) with textbook precision
* Current price ($77,626) testing the critical lower boundary support
* Previous touch points have all resulted in significant bounces
🔷 Triple Target Trajectory
* TP1: $82,400 - Initial relief target (conservative)
* TP2: $85,700 - Mid-channel equilibrium zone
* TP3: $89,100 - Upper resistance test before potential breakout
🔷 Historical Context Matters
* We're constructively holding above the December 2023 breakout level
* Current consolidation mirrors the pre-pump phase from late 2023
* Blue trendline break served as the first warning of trend change
Why This Pattern Has MASSIVE Implications
⚡ The Timing Effect:
The current position at channel support presents a rare low-risk, high-reward opportunity with clear invalidation points. The pattern suggests accumulation before a potential explosive move toward $130,000 by August-September.
⚡ Macro Alignment:
This technical setup coincides perfectly with post-halving supply dynamics and institutional capital flow patterns. The projected move higher follows the historical post-halving performance cycles.
⚡ Risk Management Precision:
* Invalidation point: Clear break below $74,000 with volume
* Ideal entry zone: $74,800-$75,500
* Risk:reward ratio at current levels: approximately 1:5
he Hidden Message Most Traders Are Missing
This isn't just about price targets—this formation suggests Bitcoin is preparing for its largest percentage gain phase of this cycle. The projected path (purple forecast line) indicates a potential 68% move from current levels in just 90-120 days.
Institutional positioning data supports this view. The methodical stair-stepping pattern in the forecast line suggests strategic accumulation phases between aggressive price advancement.
📊 SEE YOU AFTER 3-4 MONTHS .. FOLLOW ME FOR MORE DETAILS 📊

BTCUSD Sell Signal @ 85100A bearish signal has been triggered for Bitcoin against the US Dollar at the 85,100 level. This indicates a potential trend reversal or correction from recent highs, suggesting sellers may be stepping in at this price point. Traders might consider this an opportunity to short BTCUSD or take profits on long positions. As always, proper risk management and confirmation from additional technical indicators (e.g., RSI, MACD, trendlines) are recommended before taking action.
BTC 12Y trend line that indicates next bear market bottom.Back in december i was posting this idea, indicating bitcoin TOP
There is 12y RSI trend line on 2W time frame. After each RSI touch of this yellow line approx. in 400-680 days new bear market bottom formed.
Next bottom should be around Q1 2026 jan-feb-march.

Telescope Lens: The Final Zoom-InLet me say this loud and clear—this isn’t just another bullish idea.
It’s not a maybe. It’s not a prediction. It’s a warning shot before the eruption.
I’ve seen what’s coming.
Not through speculation, not through recycled charts,
but through the kind of calculated pressure that only Smart Money knows how to load behind the scenes.
You’ve seen me call the impossible.
You’ve watched me go quiet right before the storm.
And now—I'm speaking again.
But this time, I’m not the same trader you used to know.
Things have changed.
The way I see the market has evolved.
This isn’t instinct anymore—it’s Telescope Lens precision.
I don’t just look at price—I pierce through it.
I don't follow trends—I dissect them.
I don't trade setups—I expose the blueprint behind them.
Because what’s loading isn’t small. It’s shift-level.
It's bullish not by structure—but by force.
And when it hits, many will call it luck.
But you? You were warned. You were shown.
So, if you’ve ever doubted me—this is the time to shut that voice down.
And if you’ve followed me for long enough, you know what happens when I speak like this:
Something massive is about to break loose.
And no, I won’t spell it out twice.
This is Telescope Lens mode which means were in a dump mode.

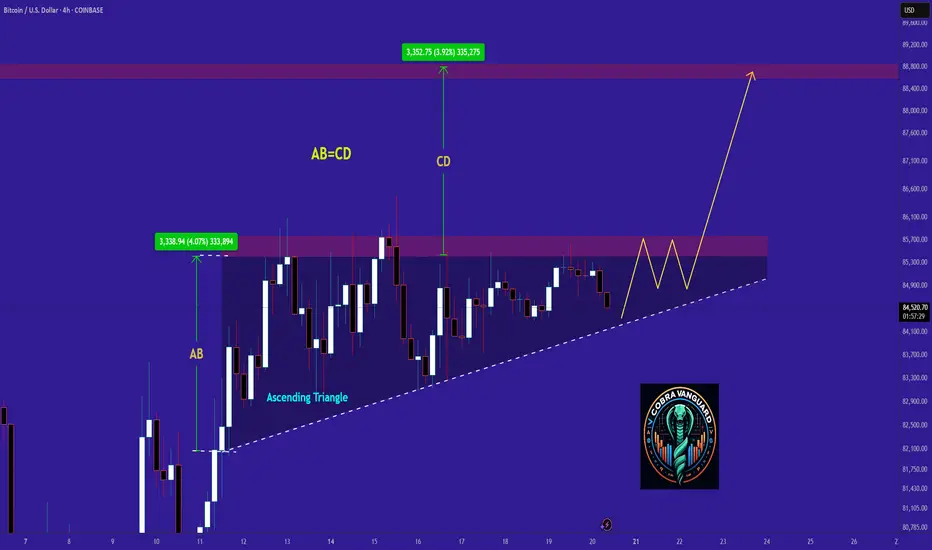
BITCOIN Ready for PUMP or what ?Currently, COINBASE:BTCUSD is forming an ascending triangle, indicating a potential price increase. It is anticipated that the price could rise, aligning with the projected price movement (AB=CD).
However, it is crucial to wait for the triangle to break before taking any action.
Give me some energy !!
✨We spend hours finding potential opportunities and writing useful ideas, we would be happy if you support us.
Best regards CobraVanguard.💚
_ _ _ _ __ _ _ _ _ _ _ _ _ _ _ _ _ _ _ _ _ _ _ _ _ _ _ _ _ _ _ _
✅Thank you, and for more ideas, hit ❤️Like❤️ and 🌟Follow🌟!
⚠️Things can change...
The markets are always changing and even with all these signals, the market changes tend to be strong and fast!!
BTC Approaches Breakout Zone in Ascending Triangle – Key Resist,📈 Chart Overview
Instrument: BTC/USD
Timeframe: Likely 4H or Daily
Indicators Used:
EMA 50 (Red) – 84,924.30
EMA 200 (Blue) – 85,558.47
🔍 Key Technical Observations
1. Ascending Triangle Formation
The chart shows a clear ascending triangle, a bullish continuation pattern.
Flat resistance zone: Around $88,700–$89,000.
Higher lows forming a solid upward sloping trendline, suggesting increasing buying pressure.
2. Price Above Key EMAs
Current price: $88,779.43, which is above both the 50 EMA and 200 EMA.
This indicates bullish momentum as price breaks above dynamic resistance levels.
3. Volume Consideration (Missing)
While volume is not visible on the chart, an ideal breakout from an ascending triangle should be accompanied by increasing volume to confirm validity.
🔄 Possible Scenarios
✅ Bullish Breakout
A confirmed breakout above $89,000 with strong volume can lead to a measured move toward:
Target = Triangle height ≈ $13,000 → Potential target: $101,500 – $102,000
Next resistance levels to watch: $92,000, $95,000, and $100,000 psychological zone.
❌ Fakeout or Rejection
If BTC gets rejected at resistance, watch for:
Retest of support trendline (~$86,000).
EMA 50 and 200 as dynamic support around $84,900–$85,500.
Breakdown below the trendline may signal a short-term correction to $80,000–$82,500.
📊 Conclusion
BTC is at a crucial decision point. The ascending triangle suggests bullish potential, but a breakout confirmation is essential. Price is above both major EMAs, signaling strength, but a rejection from resistance could invite short-term bears.

BTC Potential Breakout, Daily DivergenceBTC on the daily has the opportunity to expand way upwards over the next month - a divergence on the daily evidently takes longer to play out but RSI could easily reach 80 off the back of the structure.
I have been shorting, confidently, for a good few weeks now, with longs in between, but I'm starting to feel like I should flip long.
Solana is also trying to reclaim the daily/weekly range - things to think about for sure.
Good luck out there!
