BTC BUYBTC BUY. BTC Breakout. We have a lagging line close above the ichimoku pro on the daily as well as a candle close. Strong breakout possible. We're still waiting for a plot line close for entry.
BEARUSD trade ideas

BTC/USD) breakout up trand analysis Read The ChaptianMr SMC Trading point update
bullish analysis of Bitcoin (BTC/USD) on the 4-hour timeframe, showing a potential breakout and rally scenario. breakdown:
---
1. Market Structure:
Downtrend Channel: Price has been moving within a falling channel.
Double Bottom Pattern: Marked by two green arrows — a bullish reversal signal.
Breakout Attempt: Price is testing the upper trendline and 200 EMA (~$83,952), suggesting possible breakout.
---
2. Key Zones:
FVG (Fair Value Gap): Around $78,678 — a demand zone where price could retest before moving higher.
Breakout Confirmation Zone: ~$85,130 — breaking above this with volume signals strength.
Target Point: $95,206 — an upside target projecting ~31.77% gain from the breakout.
---
3. Indicators:
200 EMA: Currently acting as resistance. Break above it confirms bullish momentum.
RSI: Around 60 — pointing upward with bullish divergence from recent lows, showing increasing buying pressure.
---
4. Scenarios:
Scenario 1 (Bullish Continuation):
Breaks above trendline and 200 EMA.
Retest (optional) and then heads toward $95,206 target.
Scenario 2 (Retest First):
Price dips into the FVG/demand zone.
Finds support and launches upwards, confirming a strong base.
Mr SMC Trading point
---
Summary of the Idea:
This is a buy setup on breakout or on pullback:
Aggressive Entry: Break and close above $85,130.
Safe Entry: Pullback into $78,678 area (FVG).
Target: $95,206
Risk Zone: Below $78,000 (invalidates bullish structure).
Pales support boost 🚀 analysis follow)

What's Next For Bitcoin?Well now that Bitcoin broke major res all it needs to continue higher is a normal retrace to give TIME for the EMAs (Daily TF) to sync to the Upside and from then on the sky is the limit. Expect a normal retrace to the area FWB:83K - $84k on the Daily to continue higher . Bitcoin still NOT out of the woods until it prints a higher low. So far is looking very good again Weekly and Daily.
Note: If Bitcoin moves a bit higher (90k) before it retraces that will be much...much better.

This BTC Trade went Flying!! My Original Risk to Reward (RR) for this trade was 1;18 but the move was so crazy that I never put a Target Price (TP) on it. My Stop Loss (SL) was at BE after since I reached 1;5 RR. This trade eventually now is giving me a whopping 1;38 RR. I have booked 80% partially in phases. I will let the rest float and continue. My weekly target is around 97,000.

BTC/USDSomething like this makes the most sense from manipulation perspective.
I'm sure much was learned from the 2020 crash.
Say you build a shelf for your garage, hindsight says could've used screws instead of nails here and should've clamped there, wood glue, different joint style, etc etc etc... but the finished product won't look significantly different or have any change in functionality.
Sharp dive somewhere in the 40k region is my guess.

BTC/USD Eyes $109K After Bullish Breakout!!🧠 Chart Type and Indicators:
Chart Type: Candlestick
Indicators Used:
EMA 50 (red line): 85,335.18
EMA 200 (blue line): 85,657.29
🔍 Technical Pattern Analysis:
Pattern Identified: Ascending Triangle
The price has formed higher lows (ascending trendline support) while repeatedly testing a horizontal resistance zone (~$88,000), forming an ascending triangle.
This is typically a bullish continuation pattern when it occurs after an uptrend, though in this context, it's forming after a consolidation, giving more significance to the breakout.
🚀 Breakout Confirmation:
The price has broken above the horizontal resistance and is currently trading at $92,766.51.
Volume is not visible but should be increasing during a valid breakout.
Both EMAs have been decisively breached to the upside, signaling momentum shift in favor of bulls.
🧩 Key Levels:
Support Zone (Post-Breakout Retest): ~$88,000
Previously a resistance zone, now likely to act as support.
Immediate Resistance: ~$96,000
Historical resistance zone shown on the chart with a horizontal black line.
Extended Target (measured move): ~$109,420
Based on the height of the triangle projected from the breakout point.
📈 Price Action Forecast:
Two possible scenarios (depicted with arrows on the chart):
Bullish Continuation:
A retest of the $88,000 zone followed by continuation to $96,000, then $109,420.
Short-Term Pullback:
Price may dip to retest the breakout zone (~$88,000), consolidate, then rally higher.
✅ Bullish Signals Summary:
Breakout from a bullish ascending triangle.
EMAs crossed and price holding above them.
Clear higher highs and higher lows formation.
Momentum suggesting further upside.
🧨 Risks to Watch:
False Breakout Risk: If the price fails to hold above $88,000 and falls back into the triangle range.
Macro Factors: Bitcoin remains sensitive to macroeconomic news and regulations that could disrupt technical setups.

$BTC Is Bullish Again — Momentum Building?Bitcoin ( BITSTAMP:BTCUSD ) is back with bullish momentum — and the charts are starting to show real strength.
🟢 Key bullish signals:
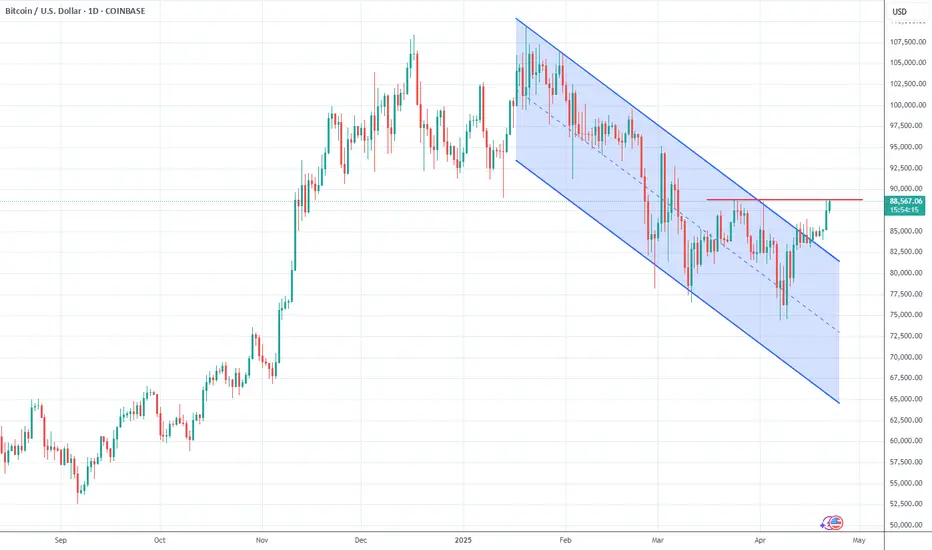
• Breakout above recent bearish channel resistance on daily chart
• Strong volume confirmation
🧠 Sentiment is shifting — fear is cooling off slighthly, and traders are eyeing higher targets.
📍 What I'm watching next:
• FWB:88K level is double top pattern neckline. Or there is a possibility that the price would bounce from the level and make another try to break it while forming head and shoulder pattern. We will see. But either way the level acts as neckline and the break would confirm a bullish move.
But let’s not forget: CPI data & macro events can still shake the market short term. Stay sharp.
Are you riding the wave or waiting for a retest?
Let me know your game plan below 👇
btc wOpen . bullish and not finished . watch and preparethe weekend was finished with a pump through all resistance zones. all SL accumulated, done with.
so now, bullish wOpen. too high to LONG,
a return to wOpen - sweep low - during a nice session timing, that be great.
otherwise, wait for the progress of upside and prepare to find the short entry.

BTC Potential Breakout, Daily DivergenceBTC on the daily has the opportunity to expand way upwards over the next month - a divergence on the daily evidently takes longer to play out but RSI could easily reach 80 off the back of the structure.
I have been shorting, confidently, for a good few weeks now, with longs in between, but I'm starting to feel like I should flip long.
Solana is also trying to reclaim the daily/weekly range - things to think about for sure.
Good luck out there!

BTCUSD Eyes Liquidity Sweep as Bulls Push Into Supply ZonesBTCUSD DAILY TECHNICAL ANALYSIS 📊
OVERALL TREND
📈 UPTREND — Momentum has surged, with multiple bullish candles breaking out above prior consolidation. Structure suggests a bullish continuation unless rejected at key resistance.
📉RESISTANCE ZONES
🔴 109,618.40 — PIVOT HIGH | Resistance Level
🔴 107,877.89 — SELL ORDER II
🔴 104,355.29 — SELL ORDER I
📈SUPPORT ZONES
🟢 102,576.04 — EXIT BUY | TP 4
🟢 96,169.15 — BUY ORDER | TP 3
🟢 92,012.50 — BUY ORDER | TP 2 | Mid-Pivot
🟢 86,027.66 — BUY ORDER | TP 1
🟢 79,908.44 — BUY ORDER II
🟢 76,167.19 — BUY ORDER I
🟢 74,406.60 — PIVOT LOW| Support Level
📊OSCILLATOR SIGNALS
RSI: 67.98 — Neutral, approaching overbought
MACD: 1,629.47 — 📈 Bullish crossover
Momentum: 10,006.19 — 📈 Strong upward push
Stoch RSI: 100.00 — 🔄 Extremely overbought, caution warranted
Williams %R: −5.30 — 🔻 Sell signal (overbought territory)
📈MOVING AVERAGES ALIGNMENT
All major EMAs & SMAs (10 through 200) are flashing BUY
HMA (9): 92,191.54 — supports current bullish thrust
Ichimoku Base: 84,535.45 — below price, further confirms bullish bias
🤓STRUCTURAL NOTES
BTCUSD has cleared a long-term pivot range with conviction — first time in over 2 months Price now testing supply zone between 102K and 104K
Break above 104K could trigger acceleration toward 107.8K and possibly 109.6K
Pullback scenarios would likely retest 96.1K or 92K (TP zones 2 & 3)
TRADE OUTLOOK 🔍
📈 Long bias remains strong above 92,012 with targets toward 107.8K and 109.6K
📉 Short-term profit-taking or rejections possible in 102.5K–104.3K zone
👀 Watch for confirmation of breakout or rejection from dynamic resistance at 109.6K
🧪STRATEGY RECOMMENDATION
CONSERVATIVE BULLISH PLAY:
— Entry: 92,012.50
— TP Targets: 96,169 / 102,576 / 104,355
— SL: Below 86,027
AGGRESSIVE SWING SCALP:
— Sell Orders @ 104,355 or 107,877
— TP: 96,169 / 92,012
— SL: Above 109,618
“Discipline | Consistency | PAY-tience™”

BTC/USD BUY zone H4 chart analysisChart Analysis Summary (BTC/USD - 4H)
Market Structure:
Downtrend channel broken to the upside.
Price action shows a bullish breakout with a potential rally ahead.
---
Entry Point:
Buy Entry: Around $87,449
---
Targets:
Take Profit 1 (TP1): $91,500 (First marked resistance level on chart)
Final Target (TP2): $95,000 (Second marked resistance level)
---
Support and Resistance Levels:
Support:
S1: $85,000 (recent breakout zone, now acting as support)
S2: $82,500 (previous price floor)
S3: $78,000 (deep retracement zone)
S4: $74,000 (major support base)
Resistance:
R1: $88,500 (minor resistance just above entry)
R2: $91,500 (TP1)
R3: $95,000 (Final Target)
R4: $99,500 (upper extended resistance zone)
R5: $102,000+ (top of the long-term range)
---
Suggested Post Caption (for client):
> BTC/USD 4H Analysis:
Entered a long position at $87,449 after breakout confirmation.
TP1: $91,500
Final Target: $95,000
Support Zones: 85,000 | 82,500 | 78,000 | 74,000
Resistance Levels: 88,500 | 91,500 | 95,000 | 99,500+
Watch for price reaction around $88.5K — bullish momentum expected to push towards $91

Will XRP catch up with BTC and give us a 22% return?XRP has turned bullish after triggering an inverse head and shoulders pattern, suggesting prices could rise by up to 22 percent. Ripple now looks to catch up with Bitcoin and several altcoins that have already posted similar gains. Watch the video for full details and share your thoughts in the comments.
This content is not directed to residents of the EU or UK. Any opinions, news, research, analyses, prices or other information contained on this website is provided as general market commentary and does not constitute investment advice. ThinkMarkets will not accept liability for any loss or damage including, without limitation, to any loss of profit which may arise directly or indirectly from use of or reliance on such information.

BITCOIN RESISTANCE AHEAD|SHORT|
✅BITCIN is going up now
But a strong resistance level is ahead at 94,900$
Thus I am expecting a pullback
And a move down towards the target at 91,000$
SHORT🔥
✅Like and subscribe to never miss a new idea!✅
Disclosure: I am part of Trade Nation's Influencer program and receive a monthly fee for using their TradingView charts in my analysis.

Bitcoin Elliott Wave AnalysisHello friends
On the Bitcoin chart, we see the formation of a complete Elliott wave pattern. These waves from 1 to 3 or C are quite clear and we can even count its sub-waves.
Now a 3-wave ABC has formed. We cannot be exactly sure that this is a complete zigzag because wave C can be extended and the price will fall further.
But we consider it wave 4 assuming that this zigzag is completed.
So we will wait for the formation of an upward wave in the form of wave 5.
The target is first $86,500 and then $88,000.
Good luck and be profitable.

Taking some profits expect some resistance at 92500Looking good so far. Got through the cloud. Taking profits and wait to see if it gets to 92500 and what it does from there. Volume getting low.

Bitcoin hits $90K for first time since MarchBitcoin has climbed above the $90K level for the first time since early March. Is this an indication of risk appetite improving, or are investors buying Bitcoin for the same reason they are buying gold? In any case, as traders, we care about the HOWs and WHEREs more than the WHYs.
With that in mind, it is worth keeping an eye on the next areas of potential support and resistance to see whether Bitcoin will break them.
Initial resistance comes in the area between $90,000 to $91,900. In this range, you have prior support meeting the 50% retracement level of the downswing from the January high. Above this, the 61.8% Fibonacci level is at $96K.
Support levels to watch now include the $88,500-$88,800 area, which was resistance previously and where the 200-day average comes into play. Below that, you have the point of origin of this week's breakout near $85,000.
By Fawad Razaqzada, market analyst with FOREX.com

Bullish rise?The Bitcoin (BTC/USD) is falling towards the pivot and could bounce to the 1st resistance which is slightly below the 61.8% Fibonacci retracement.
Pivot: 81,863.58
1st Support: 76,689.89
1st Resistance: 94,753.96
Risk Warning:
Trading Forex and CFDs carries a high level of risk to your capital and you should only trade with money you can afford to lose. Trading Forex and CFDs may not be suitable for all investors, so please ensure that you fully understand the risks involved and seek independent advice if necessary.
Disclaimer:
The above opinions given constitute general market commentary, and do not constitute the opinion or advice of IC Markets or any form of personal or investment advice.
Any opinions, news, research, analyses, prices, other information, or links to third-party sites contained on this website are provided on an "as-is" basis, are intended only to be informative, is not an advice nor a recommendation, nor research, or a record of our trading prices, or an offer of, or solicitation for a transaction in any financial instrument and thus should not be treated as such. The information provided does not involve any specific investment objectives, financial situation and needs of any specific person who may receive it. Please be aware, that past performance is not a reliable indicator of future performance and/or results. Past Performance or Forward-looking scenarios based upon the reasonable beliefs of the third-party provider are not a guarantee of future performance. Actual results may differ materially from those anticipated in forward-looking or past performance statements. IC Markets makes no representation or warranty and assumes no liability as to the accuracy or completeness of the information provided, nor any loss arising from any investment based on a recommendation, forecast or any information supplied by any third-party.

BITCOIN - Bullish Double BottomHello Traders !
The BTC price formed a double bottom pattern.
Currently, The neckline is broken !
So, I expect a bullish move🚀
______________
TARGET: 88700🎯

BTC/USD Price Action Update – April 22, 2025📊BTC/USD Price Action Update – April 22, 2025
🔹Current Price: 88,162.24
🔹Timeframe: 15M
📌Key Demand Zone (Support):
🟢88,157–88,460 – Clean Breaker Block (ideal for bullish re-entry on retest)
🟢85,500–86,500 – Higher Timeframe Demand Zone (strong base for major bullish leg)
📌Key Resistance Level:
🔴88,778 – Short-Term Structural High (key breakout point)
📈Bullish Outlook:
Price is consolidating below the 88,778 resistance. A clean candle break and close above this level can open the door to a bullish continuation, targeting the 89,500–90,000 range. Ideal entry on a pullback to 88,157–88,460 if demand holds.
📉Bearish Outlook:
If price fails to break and hold above 88,778, watch for signs of rejection. A bearish break below 88,157 could lead to a deeper retracement into the 85,500–86,500 zone.
⚡Trade Setup Tip:
✅Wait for a confirmed break and retest of 88,778
✅Watch price action at 88,157 for continuation or rejection
✅Use a tight SL and manage risk around news volatility
#BTCUSD #BitcoinTrading #CryptoPriceAction #SmartMoneyConcepts #BreakOfStructure #ForexAndCrypto #IntradayTrading #FXFOREVER #MarketUpdate #SupplyAndDemand #BitcoinUpdate

BITCOIN Free Signal! Sell!
Hello,Traders!
BITCOIN made a breakout
Of the long-term falling
Resistance line and then
Hit a horizontal resistance
Level of 88,860$ so we will
Be expecting a local pullback
From the level which means
We can enter a short trade
With the Take Profit of 85,297$
And the Stop Loss of 89,061$
Sell!
Comment and subscribe to help us grow!
Check out other forecasts below too!
Disclosure: I am part of Trade Nation's Influencer program and receive a monthly fee for using their TradingView charts in my analysis.

BTC ready to break out!!!!
Entry
Wait for daily candle confirmation
Price above Moving averages
All 4 timeframes showing bullish momentum
Enter on confirmed bullish daily close
Risk
Stop below recent swing low
Risk 1-2% capital
Size accordingly
Targets
First resistance level at 98k
1.5x measured move
Major psychological level
or floating profit
Management
Confirm daily close before entry
Move stop to breakeven after Target 1
Scale out at targets

BITCOIN NEXT MOVES!Bitcoin’s Next Move
In the long run, it's clear—Bitcoin is the new digital gold. Any dip at this stage is a potential opportunity. With over 7 years of experience in Bitcoin analysis, I believe in the bigger picture and long-term value.
If you'd like me to analyze or give insights on any other coin, feel free to ask. And don’t forget to follow for more crypto updates and analysis!

Bitcoin will return to the moon!!BTC/USD 1D - Well as you can see price has played out exactly as we predicted yesterday providing us with an amazing push to the upside. I do however want to see price correct itself before the next push up.
I have gone ahead and marked out the order block I have in mind that I would like to see price come and clear before it continues in this hawkish way. I feel this could be a great area to get involved in those longs from.
As we know there are some great prospects for BTC so its important that we are always looking for key areas of interest for us to buy in from with this market being a bullish one.
