BTC short BTC/USD is testing the upper boundary of a rising channel near $88,000. Price action shows a potential rejection from previous resistance. Bearish scenario highlighted with a possible move back toward the lower trendline zone near $70,000. Volume remains steady. Watch for confirmation.
BEARUSD trade ideas


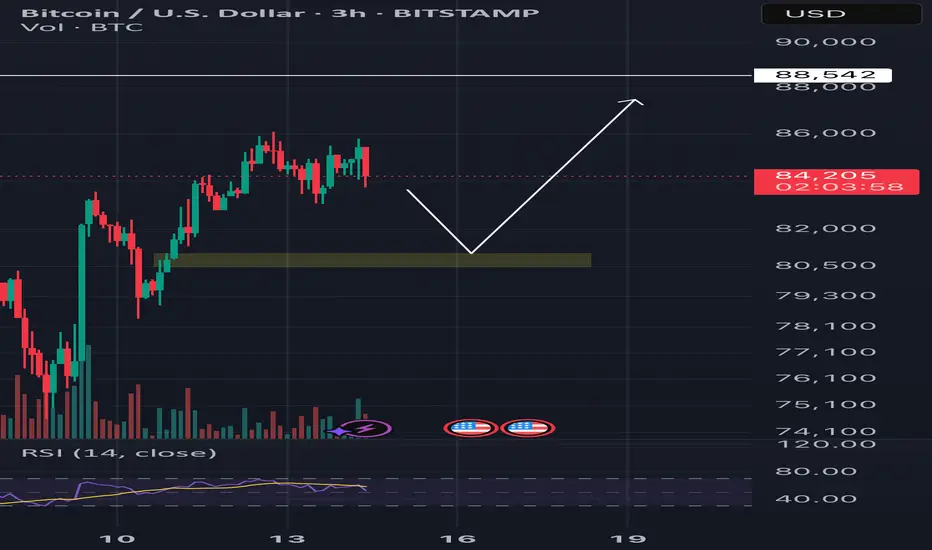
Bitcoin's Technical Breakout: Aiming for $92K as Bulls Eye TrendAs of April 12, 2025, Bitcoin (BTC) is trading at approximately $83,680, near to the previous close. The cryptocurrency has recently experienced a surge, with the intraday high reaching $84,138 and the low at $82,804.
Technical Analysis:
Trend Channel Dynamics: Bitcoin has broken above a descending trend channel, a key technical indicator suggesting a potential shift from bearish to bullish momentum. This breakout is significant as it indicates increased buying interest and a possible reversal of the prevailing downtrend.
Resistance and Target Levels: The immediate resistance is observed around $87,000, where key moving averages converge. A sustained close above this level could pave the way for Bitcoin to test the $92,000 mark, aligning with the upper boundary of the previous trend channel. This level is crucial as it represents a potential area of strong selling pressure.
Moving Averages Analysis: The 50-day Simple Moving Average (SMA) stands at approximately $85,000, while the 200-day SMA is around $87,200. Currently, Bitcoin's price is trading below both, indicating a bearish trend. However, the recent breakout above the trend channel suggests a potential shift towards bullish momentum.
Relative Strength Index (RSI): The 14-day RSI is at 50, indicating neutral market conditions without clear overbought or oversold signals. This suggests that Bitcoin has room for further upward movement before reaching overbought territory.

Time for a Bitcoin pull back?Finally bitcoin broke out of its consolidation/ down trend.
it looks like we could get lucky and have a nice little pullback to the green box.
If we are so lucky, buy with all you have. It may be the last time you see this price for a long time. When you see it next you probably wont want to touch Bitcoin with a 10 foot pole.

Bitcoin short from 95500$Waiting for 95.5k npoc level and i am entering short , target 91k and 86k.
Lets see what this pump brings on.
We can also see 98k npoc close , if that does more agressive on shorts.

BTC: Bull Trap? Rally?Very interesting things are happening. From the 4-Hour chart to the 30-minute chart, although there are parallel patterns rising one after the other, none of them have worked yet. The price continues to rise despite the fact that Japan and Mexico have put the US on the brink regarding tariffs. We are experiencing one of the moments when classical technical analysis is helpless.
I say hold on tight when it starts to fall, the target may come up to 78,000. The Inverted Shoulder Head Shoulder on the daily is winking from the horizon, as if saying I don't recognize flag patterns.

UPDATE ON BTC ANALYSISBTC/USD 1D - Well as you can see price has played out exactly as we predicted yesterday providing us with an amazing push to the upside. I do however want to see price correct itself before the next push up.
I have gone ahead and marked out the order block I have in mind that I would like to see price come and clear before it continues in this hawkish way. I feel this could be a great area to get involved in those longs from.
As we know there are some great prospects for BTC so its important that we are always looking for key areas of interest for us to buy in from with this market being a bullish one.
I will keep you all posted on how this market places out over the coming days, but a big well done to anyone who may have taken advantage of the last post on this pair and profited!

BUY Z DIP ON BTCWe're seeing a clear divergence on Bitcoin's chart, signaling a potential reversal at a strong support level. As the famous quote goes, "Buy when there's blood on the streets." Now is the time to take advantage of this dip, as these are the moments where the best opportunities arise. Don't miss out—this could be the entry you've been waiting for! 📉📈
#Bitcoin #BuyTheDip #CryptoOpportunity #Divergence #BTC

Bitcoin(BTC/USD) Daily Chart Analysis For Week of April 18, 2025Technical Analysis and Outlook:
During the price movements observed throughout the week, Bitcoin has remained close to the previous Mean Support level of 85200 and appears poised to initiate an upward breakout, targeting the newly developed Mean Resistance level of 86400. This breakout may facilitate a retest of the completed Interim Coin rally at 88400, with additional expansions of targets also being a possibility. It is critical to acknowledge that potential for downward momentum may arise from a rechallenge of either the Interim Coin Rally at 88400 or the Mean Resistance at 86400.

BTC Bullish But Needs to RetestThe market had a selloff and is about to break highs in the upcoming months!
The current coming phase will be the mania phase, most people think the bull run is over, but it is not over just yet 🙂 #trustmebro
Bitcoin has a level at 81,100 to retest and will fly until June 2025.
This will sound absurd, but BTC to 854,000! There are big institutions sell orders at that level.
XRP - $54
HBAR - $50.26
LTC - $1800
DOT - $240
ETH - $8000
Just In: Bitcoin ($BTC) Reclaims $90,000 The world's renown digital asset Bitcoin ( CRYPTOCAP:BTC ) surged nearly 4% today to reclaim the $90k resistant zone, amidst breaking out of a bullish symmetrical triangle pattern enroute to $100k.
Bitcoin for almost 1 month now has been swinging within the $80k price range, since losing it's $100k resistant in the month of February, 2025 but with increasing momentum a move to the $100k resistant doesn't seem far fetch because CRYPTOCAP:BTC has already broken the ceiling of the symmetrical triangle.
With the 4-hours RSI at 79, we may experience a respite before the major leap to $100k price point. Notable firms like Micro strategy and Michael Saylor the CEO were integral in this price movement.
The company purchased 6,556 CRYPTOCAP:BTC for ~$555.8 million at ~$84,785 per bitcoin and has achieved CRYPTOCAP:BTC Yield of 12.1% YTD 2025. As of 4/20/2025, Micro strategy holds 538,200 CRYPTOCAP:BTC acquired for ~$36.47 billion at ~$67,766 per bitcoin.
Notably, financial bodies like Standard Chartered Bank says Bitcoin ( CRYPTOCAP:BTC ) could reach a new all-time high due to concerns over the Federal Reserve's independence.
As of the time of writing, CRYPTOCAP:BTC is up 3.70% currently trading at $90,715 per CRYPTOCAP:BTC setting the coast for $100k resistant.
However, on bearish tone, should CRYPTOCAP:BTC fail to pull up that stunt, a price correction might send CRYPTOCAP:BTC back to FWB:83K support.

BTCUSD Weekly Analysis Targeting; 94k - 96k, Followed By 109k
BTCUSD Weekly Analysis
Bitcoin is currently trading around $88,638, showing strong recovery momentum after bouncing off the key 61.8% Fibonacci retracement level at $74,412, often referred to as the “golden pocket.” This bounce suggests that buyers are stepping in aggressively at this support zone, which has historically acted as a major turning point in bullish market structures.
On the upside, BTC has now reclaimed the 38.2% retracement level at $87,375, turning it into a short-term support zone. Holding above this level gives Bitcoin a clear path toward the next key resistance at $94,430, followed by a stronger resistance cluster around $96,211, where both Fibonacci and historical horizontal resistance align.
Technically, the weekly chart also confirms a breakout above the descending trendline, adding confluence to the bullish reversal. This move aligns with the Inverse Head & Shoulders pattern seen on the daily chart — a classic bullish formation that typically leads to strong upward continuation.
If BTC continues to hold above $87,000, the next short-term target would be $94,000–$96,000, and if that level breaks with volume, Bitcoin could be gearing up for a retest of its previous highs around $109,000. On the downside, $81,145 (50% retracement) and $74,412 (61.8%) remain critical support levels, with any break below $74K shifting the outlook back to bearish.
The chart structure, key Fibonacci zones, and bullish reversal pattern all point toward continued upside, with BTC needing to maintain above GETTEX:87K to sustain the bullish trend.

BTC KNOCKING ON HEAVEN'S DOORBitcoin is really knocking on the door of major resistance here, testing the key level at $88,804 for the second day in a row. What makes this even more notable is the backdrop – equities have been under pressure, yet Bitcoin is showing strong divergence and relative strength.
We saw a breakout through descending resistance yesterday, backed by a meaningful increase in volume – a solid signal that buyers are stepping up. Price is comfortably holding above the 50-day moving average, and the 200-day MA is now flattening out just below resistance, giving bulls a potential momentum shift.
A daily close above $88,804 would break the bearish market structure with a higher high and open the door to a more extended move. For now, this is an encouraging chart.

April 17 Bitcoin Bybit chart analysisHello
It's a Bitcoinguide.
If you have a "follower"
You can receive comment notifications on real-time travel routes and major sections.
If my analysis is helpful,
Please would like one booster button at the bottom.
This is the Bitcoin 30-minute chart.
Nasdaq indicators will be announced at 9:30 in a little while.
The purple finger section on the left
is connected to the short->long switching section that was performed on the 16th.
* When the blue finger moves,
Bidirectional neutral
Short->long switching strategy or long waiting if it goes down right away.
1. 85,728.6 dollars short position switching / cut-off price when orange resistance line is broken
2. 84,595.8 dollars long position switching / cut-off price when green support line is broken
3. 86,871.5 dollars long position 1st target -> Good 2nd target
Today's 12-hour chart MACD dead cross is an ignoring strategy. Check if the purple support line deviates from the current position,
and from the 1st section of the green support line deviates,
even those who have been holding long positions since yesterday can operate at the same stop loss price.
If the short position entry section at the top comes down without touching,
the 2nd section at the bottom is the final long waiting section (6+12 pattern),
and if the rebound is not good in this section and it is pushed,
it may continue to fall to the 3rd section at the bottom due to the pressure of the 12-hour chart MACD dead cross.
Up to this point, please use my analysis article only for reference and use,
and I hope you operate safely with the principle trading and stop loss price.
Thank you.

BTCUSD What Next? BUY!
My dear subscribers,
BTCUSD looks like it will make a good move, and here are the details:
The market is trading on 84459 pivot level.
Bias - Bullish
Technical Indicators: Both Super Trend & Pivot HL indicate a highly probable Bullish continuation.
Target - 84791
About Used Indicators:
The average true range (ATR) plays an important role in 'Supertrend' as the indicator uses ATR to calculate its value. The ATR indicator signals the degree of price volatility.
Disclosure: I am part of Trade Nation's Influencer program and receive a monthly fee for using their TradingView charts in my analysis.
———————————
WISH YOU ALL LUCK

BTC/USDTBINANCE:BTCUSDT
CRYPTOCAP:BTC is respecting my levels perfectly 📈 88K target hit ✅
We’ve just tapped into a major resistance zone—so a short-term pullback could be on the table 📉⚠️
#Altcoins might see a bit of cooling off too, but if BTC manages a clean retest around the 85K–85.5K range, that’d be a bullish confirmation 📍
"Disclaimer : Not Financial Advice"

Bitcoin AnalysisBitcoin is currently moving within a defined price channel, and at the moment, it is trading near the top (resistance) of the channel.
This area often acts as a supply zone, where sellers tend to step in. Therefore, it may be a good opportunity to consider a short position, especially if it's supported by confirmation signals like divergence, reversal candlestick patterns, or other technical resistances.
As always, don’t forget to apply proper risk management, set your Take Profit levels, and consider Risk-Free strategies in case the market turns unexpectedly — especially in the high-volatility crypto environment.

Bitcoin Getting Ready To Bounce AgainLooking good....looking good. Bitcoin is setting up one last time to test and try to break res line of $87600 . Within the next 12 1hr candles (if not sooner) it should start moving UP. It would be nice to see it drop fast to get rid off all those Long stop loss in the GETTEX:82K area then bounce quickly to pick the power needed to go and break the $87600 res line. After that move is printed and tested the $87600 res line it will pullback and if it doesn't print a new lower low then the new Daily and Weekly uptrend direction will be confirmed. Buckle up ladies and gentlemen we are heading for another wild ride.

Bitcoin weekly buy signalI meant to share this earlier, but considering the current state of retail, it might not make much of a difference.
Bitcoin has recently formed a solid bottom on the Market Cipher B indicator. It's evident that price actions across all markets have been heavily manipulated. It's disheartening to witness Bitcoin being so tightly controlled. Liquidity seems to have been drained from every asset. The influence of market makers is pervasive across all assets.
Stay vigilant, Bitcoin should be on the move.

Weekly plan for BitcoinMarked the important levels in this video for this week and considered a few scenarios of price performance
At local correction I expect to see price support at the levels of 84k and 82k
Write a comment with your coins & hit the like button, and I will make an analysis for you
The author's opinion may differ from yours,
Consider your risks.
Wish you successful trades! MURA

Bitcoin (BTC): Next Zone of Rejection Has Been Approached!After a strong dominance from buyers, the price has been led to our next zone of rejection, which stays between the neckline and the 100EMA line.
We are going to look for any signs of weakness near this zone from where we expect another wave of downward movement to happen, just like we had when we broke the neckline zone the first time!
Swallow Academy

BTC Followed Our Plan As UsualBTC as usual followed our plan so perfectly. In MINDS also i reminded everyone about this move. Now can book nice profits here and stay tuned for our next Update

Consolidation Divergence - Range Trading StrategyLast week, BTC continued to oscillate in the 83K-86K range. Technically, the daily MACD showed increasing volume but a deviation from the price. At the same time, the Bollinger Bands narrowed sideways, and the market entered a typical "pre-breakout momentum" stage.
Before an effective breakthrough, you can rely on the range to sell high and buy low, strictly set stops, and pay close attention to changes in volume and energy and confirmation of the breakthrough direction.
BTCUSD
sell@86500-85500
tp:84500-83500
buy@83000-84000
tp:85000-86000
I hope this strategy will be helpful to you.
When you find yourself in a difficult situation and at a loss in trading, don't face it alone. Please get in touch with me. I'm always ready to fight side by side with you, avoid risks, and embark on a new journey towards stable profits.
