BTCUSD | Bearish Rejection from Order Block Zone | Choch Confirm📉 BTCUSD – 30M SMC Breakdown | April 30, 2025
Bitcoin just printed a clean bearish reaction from a high-probability supply zone, aligned with Smart Money tactics.
📍 Technical Breakdown:
Order Block (OB) marked clearly near 95,474 – 95,756, sitting in a premium price zone.
Price returned to this OB after a previous Change of Character (Choch) to the downside — a clear signal of distribution.
The Strong High remains intact — no structural break = institutional control still active.
Rejection wicks and slow momentum near the OB confirm buyer exhaustion.
🎯 Setup Breakdown:
Entry Zone: 95,474 – 95,756
SL: Above 95,800 (invalidates OB)
TP Zone:
TP1: 94,600
TP2: 94,000
TP3: 93,480 (next liquidity pool near the Weak Low)
Risk:Reward ~ 1:3.5+
🧠 Smart Money Insight:
This is where retail traders start buying the breakout — but Smart Money knows better.
They set traps in the OB, then reverse price for maximum stop hunts.
🔁 Market Psychology:
Choch = shift in sentiment
Price retesting OB = liquidity hunt
Weak Low = magnet for future price sweep
This short setup aligns with mitigation + manipulation + distribution.
📌 What to Watch:
If price fails to break Strong High → short bias remains
If we break below 94,600 → hold for full TP at 93,480
Re-entry possible on LTF pullbacks into new internal OBs
🧠 Execution Note:
Be patient — price might dance in OB before melting. Let it reject, confirm, and flow.
🔥 Final Word:
This setup is clean, logical, and follows institutional flow. If you missed the first touch, wait for a lower-timeframe pullback entry.
Smart traders don’t chase price — they let it come to them. 🧘♂️📉
🗣️ Comment “BTC BEAR ZONE” if you caught this short setup.
📥 Save this post — real case study for Smart Money traders.
📡 Share this with your trading group — gems like this don’t show up daily.
BEARUSD trade ideas

Bitcoin at Bull-Bear Crossroads: Fear vs GreedCurrently, the price of BTC continues to be tested within the range of 95,500-96,000. The support level below shows a trend of gradually moving upwards, which is in line with the technical feature of "higher lows", indicating that the current market is in a bullish correction stage. The overall trend is moderately bullish, and there is still some upward potential in the short term as no overbought signal has emerged yet.
In terms of technical indicators, the Bollinger Bands show that the price is closely following the middle band, and both the upper and lower bands are continuously narrowing, which means that the market is about to make a directional choice. The upward momentum of the MACD indicator above the zero axis is constantly increasing, but we need to pay close attention to the potential risk of a bearish divergence at the top to prevent a trend reversal.
In terms of time periods, the ascending channel at the 4-hour level remains intact. If there is a short-term pullback, the support level near 86,000 is worthy of key attention. At the 1-hour level, the upward oscillation structure has not been damaged. If it can effectively break through the resistance level of 96,000, it is expected to open up a new round of upward space; conversely, the price may fall back to 94,000 to seek support.
Regarding the current short-term trading strategy, the price of BTC is maintained at the high end of the oscillation range. So, before there is a breakdown of the range, we can continue to initiate short positions first. After the price retraces to the low point, we can go long again and look for a rebound opportunity.
BTCUSD
sell@95000-95500
tp:94000-93500
Investment itself is not risky; it is only when investment is out of control that risks occur. When trading, always remember not to act on impulse. I will share trading signals every day. All the signals have been accurate without any mistakes for a whole month. No matter what gains or losses you've had in the past, with my help, you have the hope of achieving a breakthrough in your investment.


"BTCUSD | Smart Money Discount Play | Watch the Liquidity Trap"⚡ BTCUSD Analysis - 1H Timeframe | April 27, 2025
📊 Price Action Summary:
BTC has tapped perfectly into the Discount Zone after orchestrating a clean liquidity sweep below the prior lows.
🔥 Key Moves:
Liquidity Grab: We can clearly see those liquidity spikes — textbook fakeout behavior.
ChoCH (Change of Character): After the liquidity sweep, a strong bullish shift (ChoCH) appears, signaling a potential reversal.
Strong Low Created: This strong low within the discount zone is now protected by Smart Money players.
🧠 What's Actually Happening Behind the Scenes:
Retail traders: "It's breaking down! Sell everything!" 🚨
Smart Money: "Thanks for your liquidity. We’re loading up. 🛒"
🧩 Why This Setup Matters:
BTC swept liquidity, trapping sellers.
We saw a bullish change of character — proof of demand stepping in.
Entry opportunity now exists inside the yellow Discount Zone, where risk is minimized and upside is juicy.
🎯 Trade Setup Idea:
Entry: Inside the Discount Zone AFTER confirmation.
Stop Loss: Below the strong low (~93,455) — surgical precision.
Take Profit Zones:
Weak High (~94,500) for first scale-out 🎯
Strong High (~95,773) for the real bag 🚀
💬 Pro Tip:
"Smart Money buys red and sells green. Retail does the opposite."
Watch how BTC reacts around the ChoCH — this is where the BIG BOYS decide the next move. 🧠🔍
🚀 Summary:
✅ Liquidity sweep complete
✅ Change of character confirmed
✅ Discount zone respected
✅ Probability favoring upside expansion
🧘♂️ Be patient, wait for confirmations, and execute with sniper discipline.
✍️ Save this chart, journal it, and study how liquidity manipulation looks in real-time!
➡️ Comment "BULL MODE" if you’re positioning inside the Discount Zone!
➡️ Tag a trader who still thinks markets move randomly. 😂📉📈

BTCUSD:Adopt range trading before the breakout.Given that a number of important data are about to be released intensively, the market volatility is rising sharply. Before a clear breakout signal in the price is formed, it is recommended that within the range of $93,000 - $96,000, the range trading strategy be flexibly applied: sell at highs, and then buy at lows to build positions when the price drops back to the support level, so as to seize the band trading opportunities in the volatile market. At the same time, strictly control the position size to prevent the risk of sudden and significant fluctuations triggered by the data release.
BTCUSD
buy@93000-93500
tp:95000-95500
sell@96000-95500
tp:94000-93500
In the future, we will continue to monitor the market changes and update the trading strategies in real time.
I am committed to sharing trading signals every day. Among them, real-time signals will be flexibly pushed according to market dynamics. All the signals sent out last week accurately matched the market trends, helping numerous traders achieve substantial profits. Regardless of your previous investment performance, I believe that with the support of my professional strategies and timely signals, I will surely be able to assist you in breaking through investment bottlenecks and achieving new breakthroughs in the trading field.

Bitcoin (BTC): Zone Broken | Bollinger Bands Expanded | Fakeout?Bitcoin has recently broken the major neckline zone, which was supposed to be a zone of ideal shorting position, but buyers overtook that area.
What we are seeing is a possible momentum catch that can happen, which means we might expand to upper zones further and further but at one point price will have a sharp fall, which usually happens when the Bollinger Bands' upper side is being tested so many times.
Ideally, we need to see a form of fakeout happen near current zones which then would give us a good move to lower zones but as of now, we are not seeing any signs of weakness so we wait for it and meanwhile, we look for Break of Structures to form and keep an eye on Bollinger Bands at the same time.
Swallow Academy

Bitcoin $45k in 45 Days. Believe it or Watch It!Sometime people don't believe predictions because they need proof. Watch and learn people. Don't get caught holding the bag. Just ride the waves. No ema no alerts just market structure. I trade for fun and accuracy. This is a discipline sport so please watch and act accordingly. But this will play out exactly as expected. Go USA! #blackrock


BTCBTC needs more upside above 100K and then will see the reaction.
Disclosure: We are part of Trade Nation's Influencer program and receive a monthly fee for using their TradingView charts in our analysis.

BTC heads up at 95.2k: Covid Stimulus Fib should cause a DipBTC has been running nicely with risk-on sentiment.
Nearing a significant Covid fib at 95,176.28 (Coinbase).
Covid Stimulus nodes resonate most with monetary policy.
It is PROBABLE that we Orbit it a few times.
It is POSSIBLE that we get Rejected completely.
It is PLAUSIBLE to blow through it then come back.
If EXACT Rejection, look to sister fib below at $89,592.30
If ORBIT Capture, look to get flung in either direction.
If BREAK Easily, pay more attention to the Genesis fibs .
.
The other major fib series for BTC, the "Genesis Sequence":
These two sequences, the Genesis and Covid fibs, helped call "the TOP":
They also called the dip/bounce at 75k:
==============================================================

BTC PlanContext:
🔵 Open Interest is slightly increasing → healthy position building (likely shorts).
🔵 Top Traders Ratio is decreasing → top traders are positioning short.
🔵 CVD Spot & Futures are declining → no real spot buying support behind the price.
🔵 Funding Rate is neutral → no immediate short squeeze risk.
🔵 Optical Liquidity Map shows a cluster of short liquidations slightly above current price → possible liquidity grab.
Technical Structure:
🔵 Bounce on the Reload Zone (61.8%-78.6%) → normal technical reaction.
🔵 Possible Liquidity Grab just above 95k to clear weak shorts.
🔵 After the grab, expecting a strong rejection to the downside, targeting the CME Gap around 91–92k.
Scenario:
📈 Small upside move to grab liquidity around 95.5k–96k.
📉 Then bearish continuation toward the CME Gap (~91–92k).
Invalidation:
🚫 If strong spot buying steps in and price holds above 96k with strong volume → scenario invalidated.
✅ Otherwise, bearish continuation remains the main probability (70%–75%).

$BTC Rejected at .618 Fib - Correction Coming!Textbook rejection at the .618 Fib for CRYPTOCAP:BTC
Now on its way to retest the 200 and 50DMA as expected.
If that does not hold, we’ll go back to my original inverse head & shoulder idea ~$78k.
This will be the catalyst for Bitcoin’s next leg up to $130k end of June.

Potential Bearish, Resistance Zone with Targets at 91,700 88,700
Current Situation: The price is consolidating below a clear resistance zone around 96,000.
Price Action: The chart suggests a possible range movement within the resistance zone before a potential breakdown.
Targets:
Target 1: Around 91,700 — a minor support level.
Target 2: Around 88,500 — a stronger support zone aligned with the previous breakout area.
Indicators: The Ichimoku Cloud shows some future support, but it's thin, hinting that a breakdown could happen if momentum increases.
Bias: Bearish below resistance, aiming for Target 1 and potentially Target 2 if selling pressure grows.

Bitcoin bulls are on the offensive; is a correction ahead?Monthly bullish outside candle
Versus the US dollar (USD), Bitcoin (BTC) is poised to snap a two-month decline and pencil in a bullish outside candle on the monthly chart (textbook engulfing candles focus on the candle’s real bodies rather than upper/lower wicks). Additionally, it is important to observe that the Relative Strength Index (RSI) failed to break the neckline of a double-top pattern, circling above the 50.00 level and indicating bullish interest.
Daily support calls for attention
Across the page on the daily timeframe, since coming within a stone’s throw of testing support at US$73,575, BTC/USD bulls have been on the offensive. Running above the 200- and 50-day simple moving averages at US$81,139 and US$86,425, respectively, as well as trendline resistance (taken from the all-time high of US$109,580) and resistance from US$88,622 (now possible support), this has unearthed the widely watched US$100,000 barrier as a possible upside target.
With monthly flow on the verge of establishing a bullish outside candle, and scope for additional outperformance evident on the daily chart to at least US$100,000, a retest of US$88,622 as support could prompt a bullish scenario. Consequently, a possible downside move in the short term might be on the table before targeting US$100,000 as per the red arrows.
H1 ascending channel in view
On the H1 chart, price action has been carving out an ascending channel since last week, taken from US$91,713 and US$94,676. This has helped identify slowing momentum, visible through price action, which was unable to reach the upper channel on two occasions (red circles). Decreased appetite for higher levels can also be observed through the RSI trending lower since hitting highs of 82.00.
Given the above chart studies, I feel a breakout beneath the current H1 channel would help reinforce the possibility of downside towards at least H1 support at US$89,677, conveniently sited nearby daily support mentioned above at US$88,622. And, assuming a move lower to the said support area, I would then expect bulls to attempt to make a stand and aim at higher levels: at least US$100,000.
Written by FP Markets Chief Market Analyst Aaron Hill

Weekly-Analysis:Bitcoin (BTC)–Issue 275 (Free access)The analyst believes that the price of BTCUSD will increase within the time specified on the countdown timer. This prediction is based on a quantitative analysis of the price trend.
___Please note that the specified take-profit level does not imply a prediction that the price will reach that point. In this framework of analysis and trading, unlike the stop-loss, which is mandatory, setting a take-profit level is optional. Whether the price reaches the take-profit level or not is of no significance, as the results are calculated based on the start and end times. The take-profit level merely indicates the potential maximum price fluctuation within that time frame.

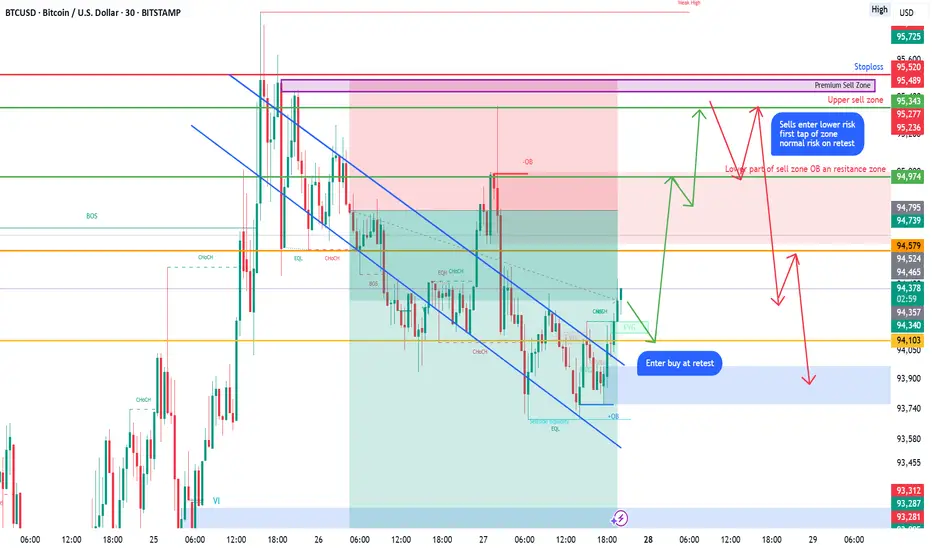
BTC set upBTC Outlook Update 📈🔎
Currently running risk-free on buys from the channel breakout — always a good spot to be in. 🛡️
I've already set up for potential re-entries targeting my main sell zone. 🎯
Original TP is sitting around the 61.8% fib retracement, close to a key bearish order block. Watching closely to see if price breaks through for more upside or rejects for a reversal. 🔥
The premium sell zone is built off FVG + resistance — waiting on clear confirmation before any sells. No rush to force trades between zones without strong confluence. 🧠
Also shared this setup with my members — open to any feedback, different perspectives, or things you spot that could help sharpen the plan! 👀👇
#CryptoTrading #BTCAnalysis #PriceAction
TARGET SUCCESSFUL
This chart displays a successful bullish breakout on Bitcoin (BTC/USD) from the previous consolidation range.
Key Levels & Zones:
-Resistance Zone: Around 95,576, which was clearly broken with strong bullish momentum.
Support Level: Maintained around 93,592, where price previously bounced from.
Fair Value Gap (FVG): Efficiently filled, providing the base for the bullish rally.
Target Achieved: The price decisively hit and exceeded the projected target of 95.576, confirming the bullish setup.
Market Sentiment: Strong bullish bias with volume surge, indicating continued interest above resistance.
Conclusion: The breakout and target completion validate the strength of the structure and buyer control in this range. Further bullish continuation could be expected if momentum sustains.

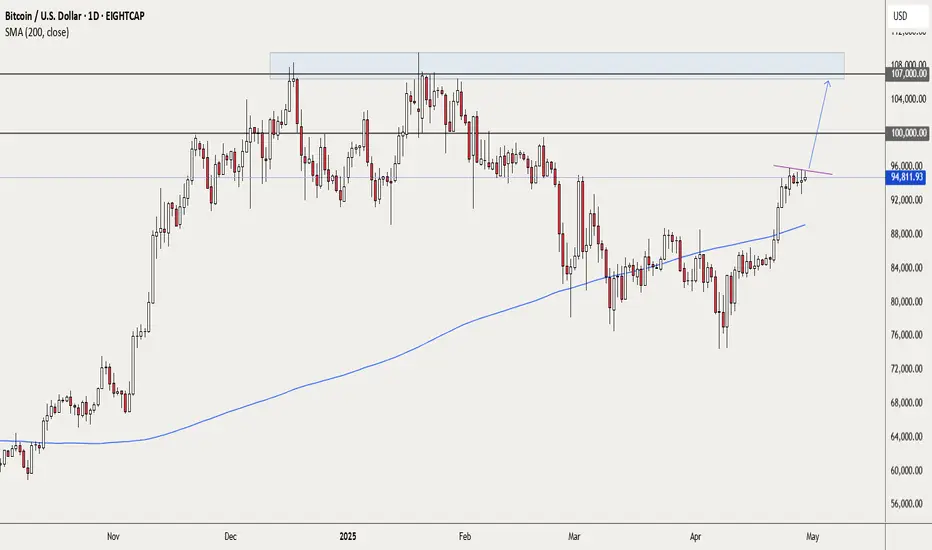
BTCUSD - best to wait a bit for a possible breakoutIf you are not already long on BTC, I would suggest exercising some patience. As my trendline indicates, we have had a few recent attempts to break higher. We have no idea if we will get that breakout or will price decline again. My approach would be to wait for a daily candle that closes above the trendline.
If that happens, I would place a pending long trade above the high of that breakout candle, stop placement below the recent swing low and 1st target at the round number 100,000.
Depending on the price action, a second target around 107,000 also looks possible.
This is not a trade recommendation; it’s merely my own analysis. Trading carries a high level of risk, so only trade with money you can afford to lose and carefully manage your capital and risk. If you like my idea, please give a “boost” and follow me to get even more. Please comment and share your thoughts too!!
It’s not whether you are right or wrong, but how much money you make when you are right and how much you lose when you are wrong – George Soros
Bitcoin Monthly TargetsBitcoin BTC 4-year cycle is set to conclude within the golden ratios, using both the 2010 and 2022 lows as reference points. Based on historical patterns, the projected target range is 127K - 143K, aligning with previous cycle behavior.


(BTC/USD)1H Chart Analysis –Bullish Breakout Setup Toward 98,000Technical Breakdown:
🔹 EMA 9
📉 Orange line (EMA 9 close): $93,233.68
➡️ Price is above EMA, showing bullish strength.
📦 RBR Zone (Rally-Base-Rally)
🔵 Zone: ~$92,000 - $93,000
🛡️ Acts as a support area — price could bounce here if it dips.
🚧 Resistance Zone
📍 Just above current price
📈 A breakout above this zone may trigger a bullish run.
🎯 Target Point: $98,000
🚀 Potential gain: +7.09%
📊 Strong upside target if breakout holds.
🛑 Stop Loss: $90,314.13
⚠️ Placed just below the RBR zone to minimize risk.
Trade Idea Summary:
🔽 Entry: On breakout above resistance
🎯 Target: $98,000
🛑 Stop Loss: $90,314.13
📈 R:R Ratio looks favorable

Bitcoin: Short-Term Bullish, but Herd Mentality ReturnsAfter reaching my 75K target, Bitcoin started to recover nicely. In its comeback, it delivered two important bullish confirmations:
➔ First, it broke above the descending trendline around 84K.
➔ Then, it made a small consolidation, followed by a new leg up that pushed the price above the critical 92K technical zone — also reclaiming the psychological 90K mark.
At the time of writing, the price holds well above horizontal support. From a technical perspective, as long as the 90-91K area remains intact, we can expect higher prices. The next big resistance is around 100K, and if support holds, we might see Bitcoin testing that zone again in the coming days.
Speculators could look to buy dips as long as the structure stays healthy.
My take:
Even though the setup looks technically decent, I'm personally staying out for now. Once again, the crowd is shouting that "the correction is over" and "it's time to buy" — a classic red flag in market psychology.

Buy@92000 - 93000 TP 95000 - 96000 - 9700096000: This is the resistance level near the upper trend - line of the current ascending wedge. The price has tested this area several times but failed to break through effectively, indicating strong selling pressure at this level 💥.
97500: It is a higher - level resistance target. If the price can strongly break through the 96000 resistance level and continue to rise, it may test this level 🎯.
⚡⚡⚡ BTCUSD ⚡⚡⚡
🚀 Buy@92000 - 93000
🚀 TP 95000 - 96000 - 97000
Accurate signals are updated every day 📈 If you encounter any problems during trading, these signals can serve as your reliable guide 🧭 Feel free to refer to them! I sincerely hope they'll be of great help to you 🌟
