Pan cake or pin cake?????I have no idea about fundamental, but I am thinking its enough moment to upside, need correction long way down to 60k area. retest is must to consider a healthy market. And it might be slow down for the rest of the year until the bull run starts again in winter, you know winter is coming. hahahaha
BEARUSD trade ideas

BITCOIN BEARS ARE STRONG HERE|SHORT
BITCOIN SIGNAL
Trade Direction: short
Entry Level: 95,374.46
Target Level: 87,760.19
Stop Loss: 100,463.39
RISK PROFILE
Risk level: medium
Suggested risk: 1%
Timeframe: 9h
Disclosure: I am part of Trade Nation's Influencer program and receive a monthly fee for using their TradingView charts in my analysis.
✅LIKE AND COMMENT MY IDEAS✅

Bitcoin - All Time Highs Are Inevitable!Bitcoin ( CRYPTO:BTCUSD ) is still massively bullish:
Click chart above to see the detailed analysis👆🏻
Despite the correction of about -30% which we have been seeing lately, Bitcoin remains in a bullish market. Even if we see another drop of about -20%, this will still just turn into a textbook bullish break and retest and either way, new all time highs will follow on Bitcoin.
Levels to watch: $70.000, $400.000
Keep your long term vision,
Philip (BasicTrading)

BTCUSD:Wait for a breakthroughToday, the price of BTC strongly broke through the threshold of $93,000. Subsequently, it started a rebound trend. After consolidating near $95,500, it failed to further break through the resistance level of $96,000 and dropped back to around $94,000. It may fall again and break below the support level of $93,000.
The breakthrough of these two key price levels will serve as an important dividing line for the subsequent trend of BTC, indicating the direction of its future price movement.
Special Reminder: A number of important economic data will be intensively released this week, and market volatility is likely to increase significantly. It is recommended that everyone trade with caution and strictly control risks.
I am committed to sharing trading signals every day. Among them, real-time signals will be flexibly pushed according to market dynamics. All the signals sent out last week accurately matched the market trends, helping numerous traders achieve substantial profits. Regardless of your previous investment performance, I believe that with the support of my professional strategies and timely signals, I will surely be able to assist you in breaking through investment bottlenecks and achieving new breakthroughs in the trading field.

BTC Breaks Out Above Key Resistance Bullish Momentum AcceleratesClassic Technical Breakout:
Bitcoin has surged past the critical $91,607 resistance level, which had capped its upside since February. This breakout marks a major shift in market momentum.
Broader Bullish Structure:
The move confirms a larger bullish structure, defined by a consistent pattern of higher lows and higher highs since the March lows, signaling strong market health.
Accumulation Zone Cleared:
Bitcoin’s breakout from the well-established $76,000–$92,000 accumulation zone further strengthens the bullish outlook, highlighting robust underlying demand.
Road to Six Figures:
Now trading above key psychological and technical levels, Bitcoin appears poised for a potential move toward six figures and a retest of all-time highs above $108,000 — as long as it holds above the breakout zone.
Conclusion:
Momentum is clearly favoring the bulls. Bitcoin’s breakout could mark the beginning of its next major rally phase. 🚀📈
#Bitcoin #BTC #Crypto #Breakout #TechnicalAnalysis #Bullish #Resistance #CryptoMarket #MarketUpdate

BTCUSD:Ascending Wedge Trend and StrategiesI. Trends and Patterns
From the 4 - hour chart, BTCUSD has shown complex volatility characteristics recently:
1.Consolidation phase: The price oscillated within a narrow range in the early stage, forming a rectangular consolidation pattern. The forces of bulls and bears were relatively balanced, and there was a strong wait - and - see sentiment in the market.
2.Breakout and current pattern: After breaking through the consolidation range, the price moved upward, indicating that the bulls were dominant in the short term. However, it has now entered an ascending wedge pattern - which is a common reversal signal in technical analysis.
- Pattern characteristics: Although the price has been making short - term new highs, the upward slope has gradually flattened, suggesting that the bullish momentum is fading and the bearish momentum is gradually accumulating. Be vigilant against the risk of trend reversal.
II. Key Support and Resistance Levels
S1: $93,000. It is near the lower trend line of the ascending wedge and also a previous pullback low. If the price drops, this could form a strong support. If it is broken, it may open up a downward space, and we need to be vigilant against trend reversal.
S2: $91,500. It is the upper edge of the previous consolidation range. If the price drops significantly, this may form a secondary support to slow down the decline.
R1: $96,000. It is near the upper trend line of the ascending wedge. The price has tested it several times without a valid breakthrough, indicating strong selling pressure here and a significant short - term suppression effect.
R2: $98,000. It is a higher - level resistance target. If the price breaks through $96,000 strongly and holds above it, it may further rise to this level.
III. Trading Strategy Recommendations
1.Bullish strategy:
- Entry conditions: The price finds support near $93,000 (such as the appearance of bullish candlestick patterns like hammer candlesticks), and does not break below this level.
- Target price: $96,000 (testing the upper wedge), and if broken, look towards $97,500.
- Stop - loss setting: Break below $92,500 (below the lower edge of the support level).
2.Bearish strategy:
- Entry conditions: The price effectively breaks below the support level of $93,000 (such as closing below it for two consecutive candlesticks), or encounters resistance and falls back near $96,000 (the appearance of bearish patterns like shooting star candlesticks).
- Target price: $91,500 (the upper edge of the previous consolidation), and if it further drops, it can look towards $86,000.
- Stop - loss setting: Break above $96,500 (above the upper wedge).
3.Risk warnings:
- The reversal signal of the ascending wedge needs to be verified with trading volume (for example, if there is a significant increase in volume during the breakout, the signal is more reliable).
- Pay close attention to fundamental factors such as the expected Fed policy and regulatory dynamics of cryptocurrencies. Be vigilant against breakout movements triggered by unexpected news.
IV. Conclusion
Currently, BTCUSD is in a critical observation period of the ascending wedge. Technical analysis shows that the bullish momentum is waning, and it faces a directional choice in the short term. Aggressive traders can lightly test the waters near support/resistance levels, while conservative traders are advised to wait for clear breakout signals (such as a volume - based breakout of the upper wedge or an effective breakdown of the lower wedge) before entering the market. At the same time, strictly control positions and stop - losses to avoid volatility risks before the pattern is confirmed.

BTC Approaching Daily Supply ZoneThis is not the right time to be bullish on Bitcoin BINANCE:BTCUSDT

"BTC Just Triggered ChoCh! Are You Ready For The Next Big Play?"⚡ BTCUSD Analysis - 15M Timeframe | April 28, 2025
📈 What's Happening:
BTC hunted liquidity above the previous highs (notice those $$$ grabs 🔥).
A sharp sell-off followed = Clear ChoCh (Change of Character) printed.
Price is now marching back into the Fair Value Gap sitting right inside the Premium Zone.
🚨 Critical Levels Highlighted:
Strong High = Ultimate invalidation for bears if price closes above.
Fair Value Gap (FVG) = First supply area.
Order Block (OB) = Deeper, higher probability short zone.
🧠 Key Observations:
Smart Money grabbed liquidity to trap breakout buyers.
Now price retraces into the imbalance = prime sniper setup.
🎯 2-SCENARIO PLAN:
Plan A — Short Setup (Main Bias):
✅ Wait for rejection signs inside FVG or OB.
✅ Trigger short entries only after bearish structure forms (M5 or M1 timeframe).
✅ TP1 = Previous minor low. TP2 = Weak Low (~92,800 zone).
✅ SL = Above Strong High (~95,400).
Plan B — Breaker Play (Alternative):
✅ If price smashes through OB + Strong High with strength, flip bias.
✅ Look for bullish Breaker structure (retest + continuation).
✅ Target fresh liquidity zones above.
📊 Risk Management Tip:
"React to confirmation, not prediction. Let price prove itself before you jump."
🧘♂️ Summary:
✅ Liquidity swept
✅ ChoCh confirmed
✅ Premium Zone retest incoming
✅ High Risk-Reward opportunity forming
🔥 This is where patience = profits.
➡️ Mark this setup, and let's trade like Smart Money, not like retailers.
➡️ Comment "PATIENT SNIPER" if you’re waiting for the perfect trigger!

btc on bullish move#BTCUSD price have now fully at third pattern which possible move will reach 96300 for price reverse.
Above 95376 have strong bullish range which will reach 96300 for sell retracment, stop loss 95500.
If the third pattern holds strong above 96300 then bullish may continue to move till 98k.

BTC - don’t be fooled by the 95,000 hitNow that BTC hit 95,000, many will think it will just go from here.
But not yet as this 95,000 is just a normal retracement and will comfortably settle down to 91,277. The blue line is a copy trend line from Oct 10th to Dec 19th previous move and this current moment is following it nicely. By Friday May 2nd, I suspect we will see a rally that could lead us into 117,000. Only time will tell if I am correct.

BTC Potential Breakout, Daily DivergenceBTC on the daily has the opportunity to expand way upwards over the next month - a divergence on the daily evidently takes longer to play out but RSI could easily reach 80 off the back of the structure.
I have been shorting, confidently, for a good few weeks now, with longs in between, but I'm starting to feel like I should flip long.
Solana is also trying to reclaim the daily/weekly range - things to think about for sure.
Good luck out there!

97K and 88KMorning folks,
So picture almost has not changed since our last talk. Now we get great setup on monthly chart with upside potential starting from 110K and up to 127K. And our task now is to join this coming action.
It would be great to get a pullback, but the shape of intraday market has changed slightly and it seems that BTC is forming 3-Drive "Sell" with target around 97K. Hopefully this pattern will trigger the pullback that we need.
If it happens, then the next area that we will be watching is around 88-90K, which is nice support area .
That's being said, our strategy for now is action to ~97-97.3K first and pullback to 88-90K second.
I mark this update as "bullish" due to our first point, but you've got the idea.

BTC/USD Price Action Update – April 28, 2025📊BTC/USD Price Action Update – April 25, 2025
🔹Current Price: 94,039.17
🔹Timeframe: 15M
📌Key Demand Zones (Support):
🟢93,331.61–93,464.50 – Immediate Intraday Demand (potential bullish continuation zone)
🟢92,901.29–93,042.00 – Deeper Demand Support (stronger reaction expected if tapped)
📌Key Resistance Level:
🔴94,518.29 – Short-Term Target Resistance
📈Bullish Outlook:
Price has shown strong recovery from the demand zones. Holding above 93,331 keeps the bullish structure intact. A clean break and retest can push price toward 94,518. Watch for bullish engulfing or BOS for confirmation.
📉Bearish Outlook:
If price breaks below 93,331, expect a deeper pullback into 92,901–93,042. Loss of 92,900 could indicate short-term bearish momentum.
⚡Trade Setup Tip:
✅Look for long setups on bullish reaction at 93,464 or 93,042
✅Manage trades carefully near 94,500 resistance
✅Use tight stop-loss for scalps below demand zones
#BTCUSD #BitcoinTrading #CryptoAnalysis #SmartMoneyConcepts #SupplyAndDemand #IntradayTrading #BreakOfStructure #BTCScalping #CryptoUpdate #FXFOREVER #ForexAndCrypto

Bearish reversal?The Bitcoin (BTC/USD) is reacting off the pivot and could drop to the 1st support.
Pivot: 94,852.52
1st Support: 88,147.57
1st Resistance: 106.444.58
Risk Warning:
Trading Forex and CFDs carries a high level of risk to your capital and you should only trade with money you can afford to lose. Trading Forex and CFDs may not be suitable for all investors, so please ensure that you fully understand the risks involved and seek independent advice if necessary.
Disclaimer:
The above opinions given constitute general market commentary, and do not constitute the opinion or advice of IC Markets or any form of personal or investment advice.
Any opinions, news, research, analyses, prices, other information, or links to third-party sites contained on this website are provided on an "as-is" basis, are intended only to be informative, is not an advice nor a recommendation, nor research, or a record of our trading prices, or an offer of, or solicitation for a transaction in any financial instrument and thus should not be treated as such. The information provided does not involve any specific investment objectives, financial situation and needs of any specific person who may receive it. Please be aware, that past performance is not a reliable indicator of future performance and/or results. Past Performance or Forward-looking scenarios based upon the reasonable beliefs of the third-party provider are not a guarantee of future performance. Actual results may differ materially from those anticipated in forward-looking or past performance statements. IC Markets makes no representation or warranty and assumes no liability as to the accuracy or completeness of the information provided, nor any loss arising from any investment based on a recommendation, forecast or any information supplied by any third-party.

Bitcoin - Successful Bullish Price ActionLovely bullish draw into discount but the question i am asking myself now is how long will we see conditions like this for?
From Wednesday, we have been rangebound with little to no movement inside of the balanced price range so the prices to keep an eye out on will be the breakout points @ $91,685 - $95,976 going forward this week.

Bitcoin most probable scenario for mai 2025If the market is bullish most probable scenario would be that we go test the blue band as support, before further continuation to the upside.
important levels who where resistances
tend to get tested as support


BTCUSD 1H FORECASTHello guys, I hope you are well let me tell you that the BTC prediction we made in the weekly outlook forecast will be the possible same move

We can see a little drop to hit 100SMA Bitcoin many times have bounce from the 100 SMA 1H. Are we gonna see that he will bounce one more time this time??.

Bitcoin .618 and two legs Up .crossroads time againthe chart posted of bitcoin . I was looking for a 72500 print it was at 74544 instead sometimes you miss things but now we have two legs up or 1/2 1/2 Not sure yet But will sit and wait . I would NOT want to see it ever go back under79910 ever if it did we will decline well below 74500

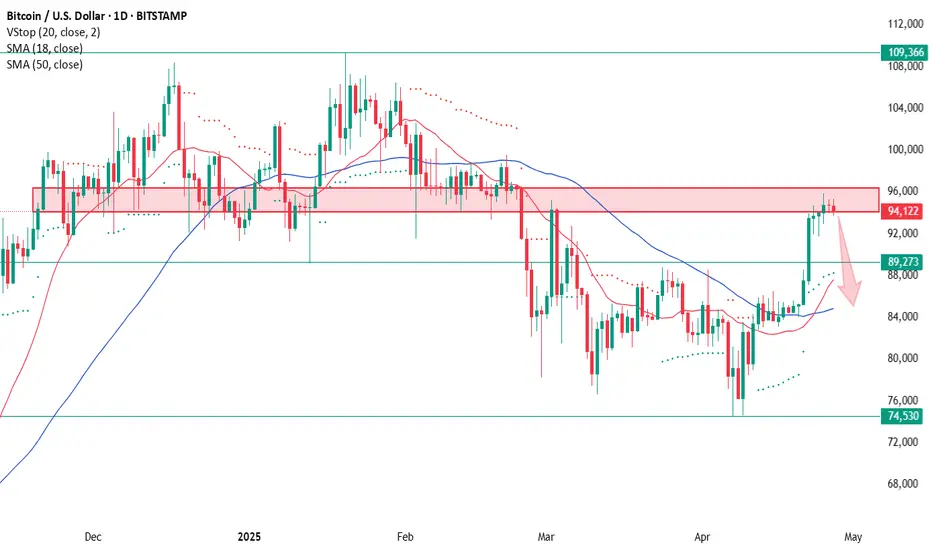
Resistance Test: Close Longs and Wait for SetupsWe've reached the zone from where a strong sell-off started back at the end of February. This area is now acting as resistance, and as we approach it, it makes sense to lock in longs — if you were holding any.
I’m not planning to short on a potential pullback; I'd rather wait for a deeper correction and then look for new long setups. The asset remains in an uptrend on the weekly chart, and as long as we stay above 74,500, I don't see any reason for confident short trades.
📝Trading Plan:
Long entries:
1. After a pullback — watching for bullish candlestick confirmations.
2. On a strong breakout above 96,300.
BTCUSD: Will Go Up! Long!
My dear friends,
Today we will analyse BTCUSD together☺️
The price is near a wide key level
and the pair is approaching a significant decision level of 94,137.25Therefore, a strong bullish reaction here could determine the next move up.We will watch for a confirmation candle, and then target the next key level of 94,804.43.Recommend Stop-loss is beyond the current level.
❤️Sending you lots of Love and Hugs❤️

BITCOIN/U.S.DOLLAR01) It looks that, bitcoin is currently following AB:CD pattern on daily and weekly time frame.
02) Show a strong reverse from fib golden numbers of retracement with the alignment of bullish trend line.
03) Showing divergence on daily time frame.
04) Break the downtrend resistance line with strong volumes.
05 Creating first wave of Elliot wave, after breaking downtrend line on daily time frame.
Target1 : 109,300
Target2 : 134,722
Stop Loss : 83,000
