Bearish reversal?The Bitcoin (BTC/USD) is reacting off the pivot and could drop to the 1st support.
Pivot: 94,852.52
1st Support: 88,147.57
1st Resistance: 106.444.58
Risk Warning:
Trading Forex and CFDs carries a high level of risk to your capital and you should only trade with money you can afford to lose. Trading Forex and CFDs may not be suitable for all investors, so please ensure that you fully understand the risks involved and seek independent advice if necessary.
Disclaimer:
The above opinions given constitute general market commentary, and do not constitute the opinion or advice of IC Markets or any form of personal or investment advice.
Any opinions, news, research, analyses, prices, other information, or links to third-party sites contained on this website are provided on an "as-is" basis, are intended only to be informative, is not an advice nor a recommendation, nor research, or a record of our trading prices, or an offer of, or solicitation for a transaction in any financial instrument and thus should not be treated as such. The information provided does not involve any specific investment objectives, financial situation and needs of any specific person who may receive it. Please be aware, that past performance is not a reliable indicator of future performance and/or results. Past Performance or Forward-looking scenarios based upon the reasonable beliefs of the third-party provider are not a guarantee of future performance. Actual results may differ materially from those anticipated in forward-looking or past performance statements. IC Markets makes no representation or warranty and assumes no liability as to the accuracy or completeness of the information provided, nor any loss arising from any investment based on a recommendation, forecast or any information supplied by any third-party.
BEARUSD trade ideas

Bitcoin - Successful Bullish Price ActionLovely bullish draw into discount but the question i am asking myself now is how long will we see conditions like this for?
From Wednesday, we have been rangebound with little to no movement inside of the balanced price range so the prices to keep an eye out on will be the breakout points @ $91,685 - $95,976 going forward this week.

BTC/USD) Short Setup: Triple Top Formation Targeting 86,023 USD You’re seeing a potential Head and Shoulders structure (or at least a triple top) — with the orange circles marking failure to break higher around $95K.
The neckline (support) is slightly diagonal down toward the $94K region.
A breakdown is anticipated once the neckline fails.
2. EMAs Interaction:
30 EMA (red) is currently flattening, showing weakening momentum.
200 EMA (blue) is far below, around 88,181 USD, acting as a major support zone — and it aligns with the projected EA TARGET POINT.
EMA compression usually precedes a strong move.
3. Zones and Key Price Levels:
Entry Point: ~95,145.60 USD → high-probability short sell.
Stop Loss: ~96,000–96,957 USD → protects against unexpected breakout.
Target: ~86,023 USD → aligns with past accumulation zone and EMA200.
4. Risk/Reward Ratio:
Potential reward is about 9–10%.
Risk (from entry to stop) is about 1–2%.
Excellent Risk/Reward (>4:1).
5. Momentum and Volume (implied, not shown):
Given the topping pattern and lack of higher highs, buying momentum is weakening.
If volume increases on a breakdown, confirmation will be strong.
📊 Strategic Points:
Aspect Analysis
Trend Still bullish, but topping signs visible
EMA Behavior Short-term EMA flattening, long-term EMA rising slowly
Pattern Formed Triple Top / Head and Shoulders
Risk/Reward Very good (>4:1)
Recommendation Short bias around entry level, with strict stop-loss
⚡ Quick Trading Plan:
Entry: Short at ~$95,145
Stop Loss: ~$96,000–96,957
Target: ~$86,023

Bitcoin About to Repeat 2021 ? Major Crash Incoming?🚨 Bitcoin About to Repeat 2021? Final Pump Before Major Crash Incoming! 🚨
Bitcoin’s current price action is reflecting classic Smart Money Concepts (SMC) and ICT methodologies — and the structure is almost identical to what we saw at the 2021 bull market top.
✅ Here's what I'm expecting based on SMC/ICT principles:
Final liquidity sweep above relative equal highs (targeting $110K–$130K 🚀), just like the final pump in 2021
Displacement and Market Structure Shift (MSS) to signal a confirmed reversal 📉
Distribution phase where smart money offloads their positions onto trapped retail buyers
This fractal behavior and liquidity engineering mirrors how the market topped in 2021 before the brutal bear market began.
🔮 Key Smart Money Signs to Watch:
Liquidity grabs above highs (inducement traps) 🔥
Premium array setups at major order blocks 🏦
Bearish BOS and MSS confirmation 🛑
Fair Value Gaps (FVGs) acting as magnets after the reversal ⚡
🧠 Reminder:
"If you understand where the liquidity is, you understand where the market is going." — ICT
History doesn't repeat, but smart money strategies often do.
💬 What do you think? Will Bitcoin repeat the 2021 trap and collapse after new highs? Let’s discuss below! 👇🔥
#Bitcoin #BTC #Crypto #BTCUSD #SMC #SmartMoney #SmartMoneyConcepts #ICT #Liquidity #MarketStructure #TradingView #OrderFlow #BearMarket #CryptoTrading

BTCUSD 1H FORECASTHello guys, I hope you are well let me tell you that the BTC prediction we made in the weekly outlook forecast will be the possible same move

We can see a little drop to hit 100SMA Bitcoin many times have bounce from the 100 SMA 1H. Are we gonna see that he will bounce one more time this time??.

Bitcoin most probable scenario for mai 2025If the market is bullish most probable scenario would be that we go test the blue band as support, before further continuation to the upside.
important levels who where resistances
tend to get tested as support

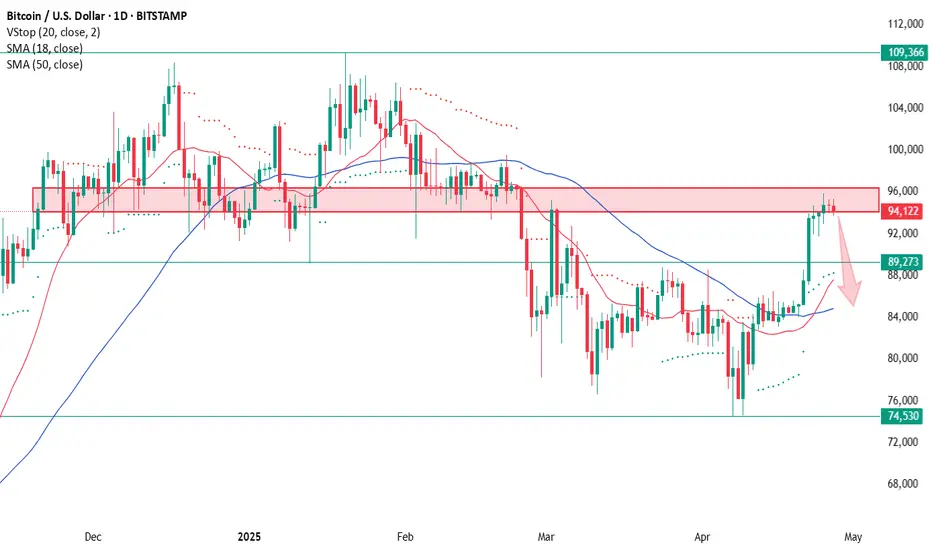
Resistance Test: Close Longs and Wait for SetupsWe've reached the zone from where a strong sell-off started back at the end of February. This area is now acting as resistance, and as we approach it, it makes sense to lock in longs — if you were holding any.
I’m not planning to short on a potential pullback; I'd rather wait for a deeper correction and then look for new long setups. The asset remains in an uptrend on the weekly chart, and as long as we stay above 74,500, I don't see any reason for confident short trades.
📝Trading Plan:
Long entries:
1. After a pullback — watching for bullish candlestick confirmations.
2. On a strong breakout above 96,300.
BTCUSD: Will Go Up! Long!
My dear friends,
Today we will analyse BTCUSD together☺️
The price is near a wide key level
and the pair is approaching a significant decision level of 94,137.25Therefore, a strong bullish reaction here could determine the next move up.We will watch for a confirmation candle, and then target the next key level of 94,804.43.Recommend Stop-loss is beyond the current level.
❤️Sending you lots of Love and Hugs❤️

BTC LONG IDEATimeframe: 1H⏰
Analysis:
• BTC is consolidating after a strong bullish move. 📈
• The market structure remains bullish, with a high probability of continuation to the upside. ✅
• A bullish flag/channel pattern is forming. 🏳️🌈
• Strong support is located around 93,700. 🛡️
Key Zones:
• Support zone: 93,700 🧲
• Resistance zone: 95,000 → 96,500 🎯
Idea:
• Price action currently shows a bullish bias. 🔥
• Watching for a breakout or a potential retest without structural break. 🧐
• Momentum is building, supporting further upside movement. ⚡


Bitcoin Following 2013-2017 Fractal UPDATE for APRIL- looks GOODInitially we can see we got the expected bounce in approximatly the are we expected it due tot he MACD reaching the bounce zone near Neutral.
Currently, PA is hoovering around the Marker near the Circle.
I did expect that to take longer and so the PA would be within the circle but I am not complaining
As it stands of today. we may still see PA reach that circle as the Daily chart shows.
Shoudl PA range across, it would take 1 whole month to reach the centre. I would be surprised if that happens as Weekly MACD is only just returning to BULLISH and the Daily still has plenty of Room to conintue its bullish climb.
BUT, and I do mean this seriously, We could see a reversal and return to Bearish still.
This has happened before
So, Lets remain cautious for now, even though we are near the Neutral line and sentiment predicts a further push higher, Caution is the better part of Valor.
But on the Longer Term, Which Path are we taking >?
We have begun rising right between the two options and, so for now, I am inclinded to Favour the Dashed Arrow that points to a 250K ATH.
And to many extents, this will still follow the Fractal, even if we are now below....
The amount of Money required to push Bitcoin up into the Bold Arrows Path and Get PA back ontop of the Fractal is truly Eye watering.
But I will Always say Never say Never.
Bitcoin is on a Cross roads. As I have mentioned in other posts, PA is under a VERY Long Term line Arc of resistance right now.
The chart for this is beow. this is a rough version but clearly shows the problem
To break over this, we need to Pass and remain above 118K USD
On the Fracta, this region os part of a Sustained push higher, as PA would normaly do in an area of High resistance...To Break through.
And we are sitting Just below this point right now....With the ability to push through
We have to wait and see which arrow we follow....My bet ois on the dashed for now....
Time will always tell us.....
Stay safe everyone.....

BTCUSD BEARISHMy calculations find that this asset, will indeed drop to the indicated price in coming days or weeks. This move will be overwhelmingly bearish.

BITCOIN BEARS ARE STRONG HERE|SHORT
BITCOIN SIGNAL
Trade Direction: short
Entry Level: 95,374.46
Target Level: 87,760.19
Stop Loss: 100,463.39
RISK PROFILE
Risk level: medium
Suggested risk: 1%
Timeframe: 9h
Disclosure: I am part of Trade Nation's Influencer program and receive a monthly fee for using their TradingView charts in my analysis.
✅LIKE AND COMMENT MY IDEAS✅


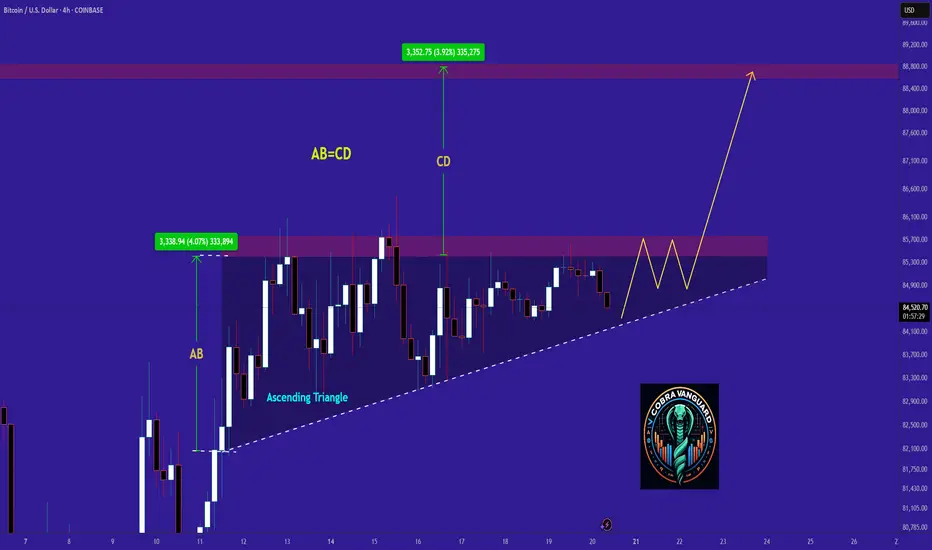
BITCOIN/U.S.DOLLAR01) It looks that, bitcoin is currently following AB:CD pattern on daily and weekly time frame.
02) Show a strong reverse from fib golden numbers of retracement with the alignment of bullish trend line.
03) Showing divergence on daily time frame.
04) Break the downtrend resistance line with strong volumes.
05 Creating first wave of Elliot wave, after breaking downtrend line on daily time frame.
Target1 : 109,300
Target2 : 134,722
Stop Loss : 83,000

BTC Bitcoin Trade plan 24/4/2025BTC/USD Trading Outlook:
Key Resistance Levels: $95,000 and $97,000
Channel Support Level: $92,000
Support Zone: $86,000
Market Scenarios:
Bearish Scenario:
If BTC fails to break above the resistance at $95,000–$97,000 and drops below the $92,000 channel support, it could trigger a sell-off.
Sell Targets:
Target 1: $90,000
Target 2: $88,000
Watch for further support around $86,000.
Bullish Scenario:
If BTC holds above $92,000 and breaks through the $95,000–$97,000 resistance zone, it may resume its upward trend.
Buy Target: $97,000 (with potential to extend higher if momentum continues)

BTC - updateBTC - last, most important Level (96K) has been reached.
Let's see if we going to break it.
Note: Total Crypto shows same.

its just an imaginationWouldn't that be a sight ? i have some reasons to believe for entering the bear season but this looks nice
Bitcoin .618 and two legs Up .crossroads time againthe chart posted of bitcoin . I was looking for a 72500 print it was at 74544 instead sometimes you miss things but now we have two legs up or 1/2 1/2 Not sure yet But will sit and wait . I would NOT want to see it ever go back under79910 ever if it did we will decline well below 74500

Hail "Schildbrecher" !
681K
confirmed as a major assault target
Herr Obersturmbannführer
Zu Ihren Diensten
SIR?

BITCOIN Ready for PUMP or what ?Currently, COINBASE:BTCUSD is forming an ascending triangle, indicating a potential price increase. It is anticipated that the price could rise, aligning with the projected price movement (AB=CD).
However, it is crucial to wait for the triangle to break before taking any action.
Give me some energy !!
✨We spend hours finding potential opportunities and writing useful ideas, we would be happy if you support us.
Best regards CobraVanguard.💚
_ _ _ _ __ _ _ _ _ _ _ _ _ _ _ _ _ _ _ _ _ _ _ _ _ _ _ _ _ _ _ _
✅Thank you, and for more ideas, hit ❤️Like❤️ and 🌟Follow🌟!
⚠️Things can change...
The markets are always changing and even with all these signals, the market changes tend to be strong and fast!!