BITCOIN → Retest 86190. There are chances for growthBINANCE:BTCUSD is starting to show positive signs, but it is too early to talk about a change in the downtrend or a bullish rally. Strong resistance ahead....
Against the background of everything that is happening, from a fundamental point of view, bitcoin in general has withstood the blows quite well and is gradually beginning to recover, but the situation for the crypto community as a whole has not changed in any way, the promises are not yet fulfilled. Bitcoin's strengthening is most likely due to localized growth in indices and discussion of lower interest rates. But the focus is on the tariff war between China and the US, improved relations and lower tariffs could weaken bitcoin.
Technically, we see that the price is moving beyond the resistance of the descending channel. For a few days now, the price has been consolidating in front of the 86190 level, and we have chances to see a rise to the resistance of the 88800 range, from which the future prospects will already depend.
Resistance levels: 86190, 88800, 91280
Support levels: 83170, 78170
The price is slowly approaching the resistance 86190, consolidating without updating the local lows, forming a pre-breakout consolidation. There is a probability of a breakout attempt. Breakout and consolidation of the price above 86190 may give a chance to rise to 88800.
But, regarding 88800 we will have to watch the price reaction. A sharp approach with the purpose of primary testing of the level may end in a false breakout and correction....
Regards, R. Linda!
BEARUSD trade ideas

BTC - Bullish Control, Confirmed!Hello TradingView Family / Fellow Traders! This is Richard, also known as theSignalyst.
🚀 As per my last two setups (highlighted on the chart), BTC rejected the $72,000 support and pushed higher with strength.
📈 This week, BTC broke above the $90,000 structure, confirming a shift in momentum from bearish to bullish.
🟢 For the bulls to stay in control, a break above the $95,200 resistance is still needed.
📊 In the meantime, as BTC retests the $89,000–$90,000 zone, we’ll be looking for medium-term trend-following longs to catch the next impulsive move.
📚 Reminder:
Always stick to your trading plan — entry, risk management, and trade management are key.
Good luck, and happy trading!
All Strategies Are Good, If Managed Properly!
~Rich

Bitcoin: Watch For These Break Out Scenarios.Bitcoin is consolidating within a very tight range: between 83 and 86K. Which way it breaks is a matter of catalyst, but recognizing the break can help to better shape expectations on this time horizon. IF 83K breaks, I will be watching for the higher low scenario (see blue square), for confirmations to go long. IF 86K breaks, I will be anticipating a test of the 88 K resistance (see arrow). What happens after that is anyone's guess. This is NOT about forecasting the future, it is about considering multiple scenarios and then adjusting as the market offers new information.
This evaluation can be helpful on multiple time frames if you know how to use it. For example, a break of the 83K support can be a great day trade opportunity on time frames like the 5 minute. A test of the 78K to 80K area followed by a confirmation can offer a long opportunity on the swing trade or day trade time frames. A test of the 88K or 90K resistance levels can offer aggressive short opportunities on smaller time frames as well. You have to be prepared for the possibility of the corresponding pattern to appear (bullish/bearish reversal) and confirmation. From there risk can be effectively quantified and taking action becomes reasonable.
Getting stuck on 1 scenario rather then being prepared for multiple possibilities makes you inflexible because there is NO precision in financial markets (unless you're on the micro structure level MOST retail traders are NOT). The scenarios I explained here can unfold over the week or take longer, AGAIN is it a matter of catalyst or surprise news event.
As far as the bigger picture, nothing has changed. The 76K AREA low is a double bottom, which translates into a broader higher low when you look back over the year. This higher low structure implies Bitcoin is still generally BULLISH which means betting on resistance levels can be considered a lower probability outcome. This also means current prices are still attractive investment levels as long as you are sizing strategically. IF price manages to break below 65K over the next quarter, then I would say investing should be more limited since such a break implies the impulse structure is no longer in play.
Other than that, seasonal volume typically peaks around this time of year in the stock market, which means the next few months are more likely to be less eventful and contain smaller price ranges etc. There are always exceptions and news catalysts will still cause price spikes, but the dramatic nature like we have seen will likely be smaller. So unless there are any surprises in Bitcoin, be prepared for slow grinds or less eventful movements generally speaking.
Thank you for considering my analysis and perspective.

Say hello to the $110k Bitcoin !The BTC will increase $15K and reach to the top of the wedge in the coming weeks .
Give me some energy !!
✨We spend hours finding potential opportunities and writing useful ideas, we would be happy if you support us.
Best regards CobraVanguard.💚
_ _ _ _ __ _ _ _ _ _ _ _ _ _ _ _ _ _ _ _ _ _ _ _ _ _ _ _ _ _ _ _
✅Thank you, and for more ideas, hit ❤️Like❤️ and 🌟Follow🌟!
⚠️Things can change...
The markets are always changing and even with all these signals, the market changes tend to be strong and fast!!

BTC/USD 1H – Bullish Breakout with FVG Entry & $91K TargetChart Breakdown:
📈 Trend Structure:
BTC is moving in an ascending channel with:
🔵 Resistance Line on top
🟢 Support Line below
🔁 Recently, it broke out above the resistance with a bullish move!
Key Zones & Levels:
🟦 Fair Value Gap (FVG)
This is your potential buy zone:
✅ Entry Point: $86,135
❌ Stop Loss: $85,098
🎯 Target: $91,000
📌 Plan:
Wait for price to retrace into the FVG zone
Look for a bullish bounce ✅
Enter long at $86,135
Set your SL and target accordingly
Risk-Reward Setup:
Risk: Small (below FVG zone) ❗
Reward: Big upside toward $91,000 🚀
Gain Potential: +5.74% ($4,948 per BTC)
Visual Flow:
1️⃣ Price breaks resistance 🔼
2️⃣ Pullback expected to FVG 🔽
3️⃣ Entry triggers around $86,135
4️⃣ Targeting moon shot to $91K 🌕
Conclusion:
This setup shows a bullish continuation with solid RR.
If BTC holds the FVG on a retest, the move to $91K looks likely!

(BTC/USD)1H Chart Analysis –Bullish Breakout Setup Toward 98,000Technical Breakdown:
🔹 EMA 9
📉 Orange line (EMA 9 close): $93,233.68
➡️ Price is above EMA, showing bullish strength.
📦 RBR Zone (Rally-Base-Rally)
🔵 Zone: ~$92,000 - $93,000
🛡️ Acts as a support area — price could bounce here if it dips.
🚧 Resistance Zone
📍 Just above current price
📈 A breakout above this zone may trigger a bullish run.
🎯 Target Point: $98,000
🚀 Potential gain: +7.09%
📊 Strong upside target if breakout holds.
🛑 Stop Loss: $90,314.13
⚠️ Placed just below the RBR zone to minimize risk.
Trade Idea Summary:
🔽 Entry: On breakout above resistance
🎯 Target: $98,000
🛑 Stop Loss: $90,314.13
📈 R:R Ratio looks favorable

BTC → 𝐁𝐮𝐥𝐥𝐢𝐬𝐡 𝐏𝐫𝐞𝐬𝐬𝐮𝐫𝐞 !!!Bitcoin has completed and broken the ascending triangle in the monthly timeframe, The price is currently supported well, which can increase the price. I expect the price to rise to around 600k .
Give me some energy !!
✨We spend hours finding potential opportunities and writing useful ideas, we would be happy if you support us.
Best regards CobraVanguard.💚
_ _ _ _ __ _ _ _ _ _ _ _ _ _ _ _ _ _ _ _ _ _ _ _ _ _ _ _ _ _ _ _
✅Thank you, and for more ideas, hit ❤️Like❤️ and 🌟Follow🌟!
⚠️Things can change...
The markets are always changing and even with all these signals, the market changes tend to be strong and fast!!

Analysis of the Current Trend of BTC and StrategiesIn terms of the current daily technical analysis of BTC, although the MACD indicator stabilizes above the zero line, the continuous shrinking of the red bars exposes the gradual weakening of the bullish momentum. The RSI (14) indicator flattens out around 60, confirming that the market has entered the correction phase after being in an overbought state. It is worth being vigilant that during this rebound process, the trading volume has been continuously sluggish, forming a sharp contrast with the breakout on heavy volume in March, which implies that the upward movement lacks effective capital to take over.
In terms of the K-line pattern, the consecutive three-day long upper shadows, combined with the pressure at the upper band of the Bollinger Bands, form a "Shooting Star" pattern, highlighting the heavy selling pressure from above. However, before confirming the downward correction trend, there may be a short-term rebound opportunity in the market to digest the floating chips. It is necessary to pay special attention to the key support level of 92,700. Once the closing price effectively breaks below this level, the short-term top will be confirmed, and the market trend may decline towards the integer level of 90,000.
BTCUSD
sell@94800-94500
tp:93500-93000
Investment itself is not risky; it is only when investment is out of control that risks occur. When trading, always remember not to act on impulse. I will share trading signals every day. All the signals have been accurate without any mistakes for a whole month. No matter what gains or losses you've had in the past, with my help, you have the hope of achieving a breakthrough in your investment.

“Does size matter?” when it comes to backtesting?It’s the kind of question that gets a few smirks, sure. But when it comes to backtesting trading strategies, it’s not a joke, it’s the difference between confidence and false hope.
Let’s get real for a minute: the size of your candles absolutely matters.
What you don’t see can hurt you
Most people start testing on bigger timeframes. It’s faster, easier on the eyes, and the results look clean. But clean doesn’t mean correct.
Larger candles blur the details. That one nice-looking 4-hour candle? Inside, price could’ve spiked, reversed, chopped around, or triggered your stop before closing where it did. You’d never know. And that’s the problem.
You might think your entry worked beautifully… but only because the data smoothed out everything that actually happened.
A backtest should feel like a real trade
Trading isn't just about the final price. It’s about what price does to get there. That messy movement inside the candle? That’s where most trades are made or broken.
If your strategy is even remotely reactive, waiting for structure, confirmation, retests, or anything time-sensitive, you need to see what price did between the open and close.
And the only way to see that? Use smaller candles.
Smaller data, clearer picture
1-minute candles might look overwhelming at first, but they give you something the higher timeframes just can’t: behavior.
Not just outcomes. Not just win/loss stats. But the actual shape of the move, the hesitation, the fakeouts, the precise moment when the trade made sense—or didn’t.
And once you start testing with that level of detail, your strategy either earns your trust… or shows its cracks.
So how small should you go?
There’s no one-size-fits-all here. But as a general rule: if your idea relies on precision, go small. Test it on 1-minute or 5-minute charts, even if you plan to execute on higher timeframes. You’ll quickly see if the entry makes sense, or if you’ve been relying on candle-close hindsight.
Yes, it takes longer. Yes, you’ll stare at noisy charts for hours. But your strategy will thank you.
Watch out for “too good to be true”
One last thing, if your backtest results look flawless on 1h or 4h candles, pause. That’s often a sign that you’re testing a story, not a strategy.
Zoom in. See what actually happens. You might be surprised at how different the same trade looks when you’re not glossing over the details.
TL;DR:
In backtesting, size absolutely matters. Smaller candles reveal real behavior. Bigger ones hide the truth. So if you care about how your strategy actually performs not just how it looks.
go smaller. Your backtesting will get sharper, and your confidence? Way more earned.

Pan cake or pin cake?????I have no idea about fundamental, but I am thinking its enough moment to upside, need correction long way down to 60k area. retest is must to consider a healthy market. And it might be slow down for the rest of the year until the bull run starts again in winter, you know winter is coming. hahahaha

The Journey of the Orange SunFrom whispers in the digital void in 2012
to the roaring crowd at $93,000 in 2025 —
Bitcoin’s arc bends not just toward price,
but toward a revolution written in blocks.
Each Fibonacci line is more than math —
it’s prophecy, patience, and power.
The chart doesn’t just show price;
it echoes belief.
Where others see candles,
I see constellations.
And we’re still charting the stars.
🚀📈
#BTC #Bitcoin #CryptoArt #ChartPoetry #FibLevels #BTCUSD

Bearish drop?The Bitcoin (BTC/USD) is reacting off the pivot which is a pullback resistance and could reverse to the pullback support.
Pivot: 94,119.93
1st Support: 88,510.65
1st Resistance: 99,362.24
Risk Warning:
Trading Forex and CFDs carries a high level of risk to your capital and you should only trade with money you can afford to lose. Trading Forex and CFDs may not be suitable for all investors, so please ensure that you fully understand the risks involved and seek independent advice if necessary.
Disclaimer:
The above opinions given constitute general market commentary, and do not constitute the opinion or advice of IC Markets or any form of personal or investment advice.
Any opinions, news, research, analyses, prices, other information, or links to third-party sites contained on this website are provided on an "as-is" basis, are intended only to be informative, is not an advice nor a recommendation, nor research, or a record of our trading prices, or an offer of, or solicitation for a transaction in any financial instrument and thus should not be treated as such. The information provided does not involve any specific investment objectives, financial situation and needs of any specific person who may receive it. Please be aware, that past performance is not a reliable indicator of future performance and/or results. Past Performance or Forward-looking scenarios based upon the reasonable beliefs of the third-party provider are not a guarantee of future performance. Actual results may differ materially from those anticipated in forward-looking or past performance statements. IC Markets makes no representation or warranty and assumes no liability as to the accuracy or completeness of the information provided, nor any loss arising from any investment based on a recommendation, forecast or any information supplied by any third-party.

What if I show you Bitcoin is at end of 1st cycle only ?
The Chart above involves TWO things we may need to pay attention to.
There is so much involved in this and I could go on for hours because, for me, this opens the door to so many things for Bitcoin.
And I am now looking at this past 14 years as the "Beginnings".
And we need to wait and see Where we go next before we label that
So..
What do we have here.
The ARC of Resistance. - I have talked about this before. Simply put, PA on every ATH since 2011 has been rejected by the same line / Arc - This needs no more than the Arc on a chart to see...
It is as simple as that.
Beneath this, we have that Dashed line of Support that has Never been Broken. Created off a High in 2011, it got retested as support in 2015 and not again until 2023.
Between these two points, you will notice how that Arc of resistance was at its furthest points from the line of support below.
It is like the Beginning and End of a sequence.......
The next thing we have is a Very interesting thing called the Trend-Based FIB Time.
It is important to understand what this is, So ;-
Trend-Based Fib Time is a technical analysis tool that uses the Fibonacci sequence to predict probable price corrections within an existing trend. It is represented by vertical lines at specific time intervals that show potential areas where a swing high, low, or reversal could occur. These intervals are based on the Fibonacci sequence and are not concerned with price levels but rather with time. The tool helps traders identify how far a wave is likely to travel in the trend.
Note what is in Bold there.
And then look at the chart..It clearly shows us, where PA touched that line of support twice, the Cycle / Wave. The RED zones. And between these was the Trend. The over all Gain in price, over Time.
We have 3 Waves in total. The 3 ATH to ATH from 2017 to now
To further support this idea, see how PA did not come down to the Line of support between the 2017 - > 2021 ATH's
That was MID CYCLE - Strength
And so now, while we all wait for the next push up, I want to show you a zoomed, Daily version of this chart
The Current ATH we have was absolutely on the day of the END of this Fib Time cycle.
I promise you I did not "Adjust this to suit." That was the genuine result.
And I was Stunned.
And more than that, This image also very clearly shows us that Time and Room is running out for PA.
It faces the strongest lines of Support and resistance it has ever faced and these lines reach an apex in Dec.....
PA ALWAYS REACTS BEFORE THE APEX
So, What is Next ?
The chances of Bitcoin crashing to the Floor are highly unlikely unless all the corporations that have been buying BTC, decide to sell them all at the same time.
This IS a possibility ONLY if they are working with the TradFi banking organisations, that tried to Crash BTC in 2022 / 2023
OK OK, that involves ridiculous amounts of Losses for many ..so..NO
BUT PA IS GETTING SQUEEZED
And so we wait....and Wait till we see Bitcoin PA break out, Enter a Brand New Trend..a Long Term Cycle.....and we may call it Adulthood.....
Or, we will have a Story to tell our Grandchildren about a Dream of breaking Free of Banking that Came Oh so Close
I cannot wait to see what happens Next - and I am HODL

Bitcoin prediction for next 3 monthsBitcoin is creating a new uptrend .And seems like 130k target this year is possible.
Lets see if btc can push higher.

Bitcoin Macro View – Post-Halving StructureThis monthly chart outlines Bitcoin’s long-term ascending channel with key horizontal resistance levels. Following the April 2024 halving (highlighted), price action has continued respecting the macro uptrend with higher lows. Blue projection suggests potential for continued bullish momentum, testing upper channel boundaries into late 2025.
Key zones:
• Major support: GETTEX:23K (2022 low, Fibonacci zone)
• Resistance: $60K–$69K range (previous ATH supply zone)
• Current structure: Bullish continuation above trendline support
Watching for confirmation of a breakout above previous highs, with potential upside extension toward $90K–$100K by 2026 if momentum sustains. 📊🚀
#Bitcoin #Crypto #BTC #TechnicalAnalysis #BTCUSD #HalvingCycle #CryptoTrading #MacroView

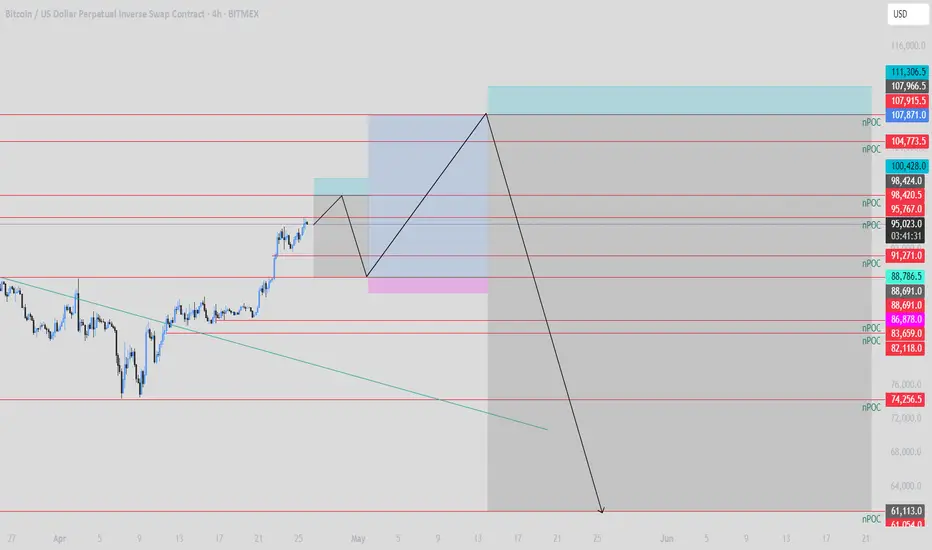
Bitcoin :What is next?These are my 3 major trades for this month and the next one.
First we got that 98k npoc level. After that i will open a nice little short postion until 88k region is tapped. Then i will long until 104k or 107k npoc levels close . I will consider also entering short from 104k region.
I think during the summer btc will go down just like last year .
60k-70k is waiting for btc.
SPY/QQQ Plan Your Trade for 4-24 : Carryover PatternToday's Carryover pattern suggests we'll see similar price action today to what we saw yesterday.
We will very likely see a little support in early trading today, followed by a moderate meltdown-type trend.
I'm not expecting much to happen today - but we could get some news or other data that may prompt some type of bigger move in the markets.
Yesterday evening, I shared an "Update" video with everyone. In that video, I highlighted some of my active trades.
I've gotten a few messages from followers asking if I can share more data related to my trades. I'm sorry, but that won't happen in these FREE Plan Your Trade videos.
I shared some of my trades yesterday to highlight how I had moved into a moderate Short/PUT position, trying to stay ahead of the bigger market trend.
In other words, I'm not chasing the nickels. I'm setup to try to profit from the DOLLARS.
Gold and Silver may stay somewhat muted over the next 48 hours. But, I do expect them to try to melt upward.
BTCUSD appears to be setting up a BULL TRAP. I, personally, don't trust this upward price move because it is counter to the EPP price structure. I could be wrong.
But right now, I just don't trust the upside move in BTCUSD, knowing the SPY/QQQ should move into a deeper MAJOR LOW in early May.
Again, these videos are designed to help you build your skills and find your own style of trading.
I really do hope all of you are benefiting from my continued work to deliver these videos.
GET SOME...
#trading #research #investing #tradingalgos #tradingsignals #cycles #fibonacci #elliotwave #modelingsystems #stocks #bitcoin #btcusd #cryptos #spy #gold #nq #investing #trading #spytrading #spymarket #tradingmarket #stockmarket #silver

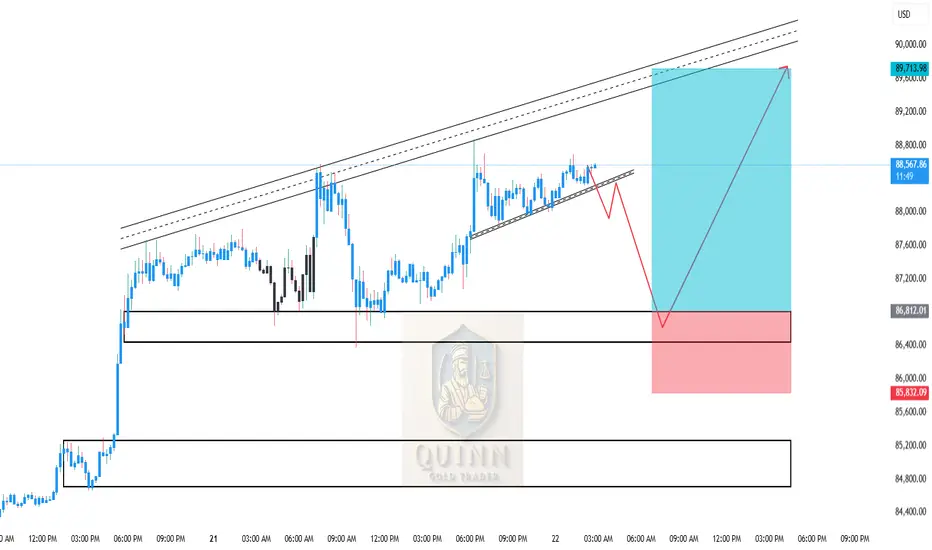
BTCUSD Intraday Move 22-04-2025📊 BTCUSD Analysis – April 22, 2025
Price action is currently forming a rising wedge, typically a bearish pattern, indicating that a short-term correction may occur before the next bullish impulse. The structure shows consolidation with weakening momentum, suggesting that a pullback to demand zones is likely.
We have two strong support zones identified:
Zone 1: 86,400 – 86,800 — minor support from recent consolidation.
Zone 2: 84,700 – 85,100 — major demand area aligned with previous breakout and price reaction.
A retracement into either of these zones offers high-probability buy opportunities for continuation toward the upper resistance trendline and prior high near 89,700.
📈 BTCUSD Buy Signal:
Buy Entry #1: 86,400 – 86,800
Buy Entry #2: 84,700 – 85,100
Take Profit: 89,700
Stop Loss:
For Entry 1: Below 86,200
For Entry 2: Below 84,500
Trade Idea: Wait for bullish price action (engulfing candle, pin bar, or volume spike) before entering.
BTCUSD Analysis Today: Technical and On-Chain !In this video, I will share my BTCUSD analysis by providing my complete technical and on-chain insights, so you can watch it to improve your crypto trading skillset. The video is structured in 4 parts, first I will be performing my complete technical analysis, then I will be moving to the on-chain data analysis, then I will be moving to the liquidation maps analysis and lastly, I will be putting together these 3 different types of analysis.

BITCOIN (BTCUSD): Very Bullish Pattern The price of BITCOIN formed a bullish flag pattern on a 4 hour chart following a significant uptrend.
Breaking through the flag's resistance is a strong indication of continued bullish momentum and a likely uptrend.
It is anticipated that the price could soon reach levels of 97,000 and 100,000.

look at the time of ATHIt think price move like this. drop rally biger drob and then new big rally cycle.

BITCOIN's secret catalyst. The Gold-to-Crypto Rotation Is ComingBitcoin (BTCUSD) is attempting to form a new medium-term bottom here, following the Tariffs-led sell-off of the past 2 months. While the crypto market is consolidating and accumulating, the Gold market is smashing every historic All Time High (ATH) after the other.
This is not the first time we see this divergence between Gold and BTC and this is what historically delivers what we call 'Gold-to-Crypto Rotation'. This happens when Gold peaks, making its Bull Cycle Top, initiating a capital transition to BTC, hence starting the final rally of its Bull Cycle.
This has already taken place 3 times in its short history and Gold's sheer ferocity of the 2025 rally, indicates that we may possibly be about to repeat another one.
So what do you think is Gold about to top and offer a mass exodus a capital to Bitcoin, hence kickstarting a massive rally? Feel free to let us know in the comments section below!
-------------------------------------------------------------------------------
** Please LIKE 👍, FOLLOW ✅, SHARE 🙌 and COMMENT ✍ if you enjoy this idea! Also share your ideas and charts in the comments section below! This is best way to keep it relevant, support us, keep the content here free and allow the idea to reach as many people as possible. **
-------------------------------------------------------------------------------
💸💸💸💸💸💸
👇 👇 👇 👇 👇 👇

Big Retest for BTC BTC is currently retesting the area is made the first big break from.
If we reject from here, it's usually pretty easy to map out the next important levels, since we generally trade down to the 2.20 fib of the failed rally. Around 40,000 in this instance.
This is a real make or break point for BTC. If we see a rejection here, then there's a strong chance this is a change in the overall prevailing trend and start of a long drawn out bear trend.
Conversely, if we can rally through, then things look far more optimistic.
But this would be the obvious risk spot for bulls and the high value betting area for bears.
Strong odds an important decision is made here.
