BEARUSD trade ideas

BTC - short if the accelerated trendline breaks and confirms. This has been a very screwy time in markets, lol.
I was stopped out of my first BTC short after at least some profits were taken.
I still think that we are going to face a correction before heading higher, granted that we haven't seen the top of this cycle.
If this accelerated trendline breaks and confirms, enter a short position. That is the safest entry for now at least.
I would target the big picture trendline, which will probably be close to the .50 fib on this particular break-out structure. So, close to 76K.
We may even get a scare-tactic wick down to 68K-70K. That coincides with this structure's .618 pocket.
Anyway, that's it for now for me.
Thank you!

BTCUSD Weekly Log ChartOften preceding the general market movement, bitcoin currently holds its support pretty well.

“BTC Fails Breakout and Slips Into Bearish Trap”Bitcoin couldn’t hold above key resistance and broke down from its rising structure. Sellers are stepping in—watch this zone closely as momentum shifts bearish.

[BTCUSD] 2025/04/04 Next trend for BTCUSDThis figure show you next trend of BTCUSD.
The price action will be sideway around 76k-84k in 4-8 week. After that the price action go up.

BTC SHOWING DIVERGENT STRENGTHStocks had their worst one day drop in 4 years - and Bitcoin actually printed a green candle, showing incredible relative strength. On a day where tech dropped over 5%, you would have expected a 10%+ drop from Bitcoin, but it did not happen. Is Bitcoin finally decoupling?
As for the technicals…
Bitcoin continues to coil tightly inside a large symmetrical triangle on the daily chart, printing higher lows and lower highs as volatility compresses. After a strong rejection from both the 50-day and 200-day moving averages earlier this week, price found support once again on the ascending trendline – buyers are clearly defending that level.
Volume has remained muted during this consolidation, which is typical for a pattern like this. But remember: triangles are neutral until they break. This setup is approaching its apex, meaning a decisive move is likely coming soon.
Watch for a break above $88,000 to signal a potential bullish breakout – or a drop below the rising trendline to flip the script. Until then, it’s all about patience.

KEEP TRADING SIMPLE - BTCGood Morning,
Hope all is well. BTC also running the bullish pattern that the rest of the crypto market is. Trend change is in site on the daily which is what I use to plan my swing trades. I use the hourly for entries and exits.
Again waiting for confirmation on the hourly support to place my next swing trade.
Thanks!

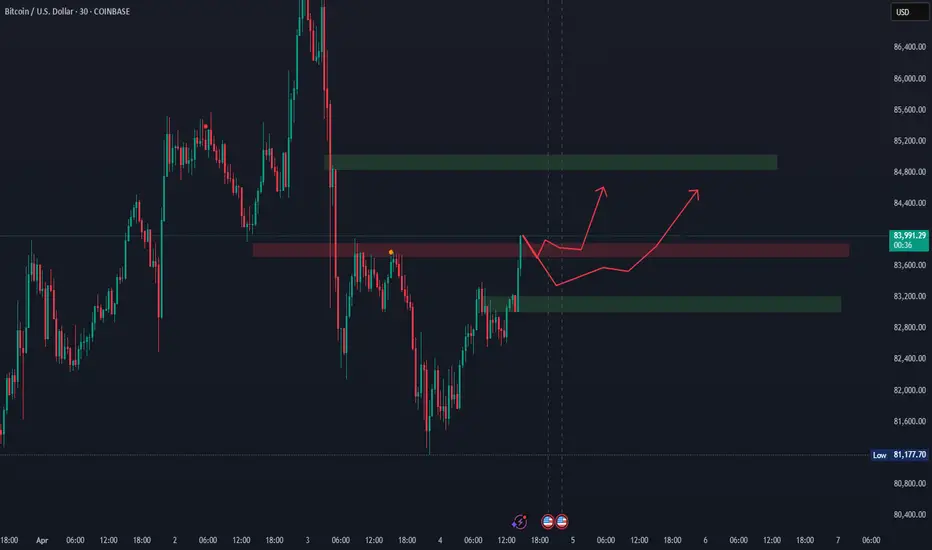
BTC BuysNeed the 30 minute candle to close above 83900, then wait for a retracement for the next candle and enter at the break of the high. Potential target is 84800. Retracement for the move can come up to 83200. If price breaks below that level, then we can exit the trade.
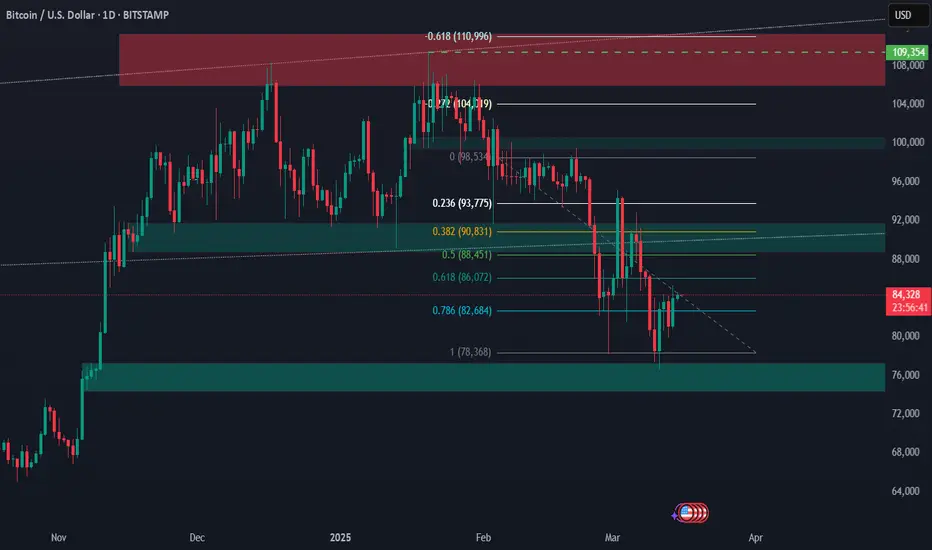
Bitcoin Daily ChartBitcoin Sits below 0.618 on the fib chart there is a good chance that it will break this level then retest again before moving towards 86k then 90k.
Observation : this could be over the next few weeks due to the Tariffs/Inflation coming out of the USA with a combination of unrest around the world. Meaning that investors are seeking safe haven until there is confidence to reinvest in the Bitcoin.
Conclusion: its better to take long shorts /also short shorts were available towards support and Resistance Levels as it appears Bitcoin is ranging between Levels until the Markets settles from all the Volatility .
Disclaimer: In no way is this Financial advice for trading. trading is a RISK individuals and are at all times responsible any and all trades they engage in.
Lets place a trade together. Leap Competition, Lets GoIn this video we chat about an array of topics
If you would like to see how to open a trade for the Leap Competition, learn how I know where price is going to next and get some advice on Risk:Reward Ratios...this video blah blah blah ;)

Bitcoin (BTC/USD) 4H Chart Analysis – Professional BreakdownBitcoin (BTC/USD) 4H Chart – Detailed Professional Analysis
This chart presents a Rectangle Pattern, a common consolidation structure in technical analysis. The price has been oscillating between a well-defined resistance level near $88,000 - $89,000 and a support level around $80,000 - $81,000. This pattern suggests an upcoming breakout, with bearish continuation being the most probable scenario.
Understanding the Rectangle Pattern
A rectangle pattern forms when price moves sideways, trapped between two horizontal levels. Traders watch for a breakout in either direction to determine the next trend. In this case, Bitcoin has tested the resistance multiple times but failed to break above, indicating strong selling pressure. Meanwhile, support has been retested several times, which weakens its strength over time.
A bearish breakdown is likely because:
Buyers appear unable to push past resistance, showing exhaustion.
Support has been tested multiple times, which increases the chance of a breakdown.
The dotted black trendline is now being tested, and a break below it would further confirm bearish momentum.
Trade Setup for a Breakdown
A short trade becomes valid only if Bitcoin breaks below the $81,000 - $82,000 support zone with strong momentum. The price must close below this level to confirm the move.
How to Enter the Trade?
Look for a strong bearish candle close below the $81,000 - $82,000 range.
If Bitcoin retests this broken support (now acting as resistance), this can be a secondary short entry point.
Once confirmation is seen, open a short position.
Stop Loss Placement
To protect against false breakouts, a stop loss should be set above the $88,457 resistance zone. If the price moves back into the rectangle and surpasses this level, it means the bearish setup is no longer valid.
Profit Target and Trade Expectation
The expected take profit target is $73,541. This is calculated using the measured move projection, meaning the height of the rectangle is subtracted from the breakdown point. If Bitcoin reaches this level, the trade will have successfully captured the bearish momentum.
Market Psychology Behind This Move
The repeated failure to break above resistance ($88,000 - $89,000) signals weak buying interest. Buyers have been stepping in at support, but each retest of the $80,000 - $81,000 zone makes it more vulnerable.
Once support finally breaks, several factors will accelerate the move:
Long positions will be forced to sell, increasing selling pressure.
Breakout traders will enter new short positions, pushing price further down.
Liquidity below support will be triggered, causing Bitcoin to fall sharply toward the $73,541 target.
Invalidation Scenario (Bullish Case)
If Bitcoin breaks above $88,000 - $89,000 and holds, the bearish setup becomes invalid. In that case:
The price would shift into a bullish continuation pattern.
Traders should avoid shorting and instead look for buying opportunities above resistance.
Final Thoughts
This is a high-probability bearish setup, but patience is key—wait for confirmation before entering.
Risk management is crucial : The stop loss at $88,457 ensures that losses are minimized if the market moves against the trade.
If Bitcoin remains inside the rectangle, traders can buy at support and sell at resistance until a breakout occurs.

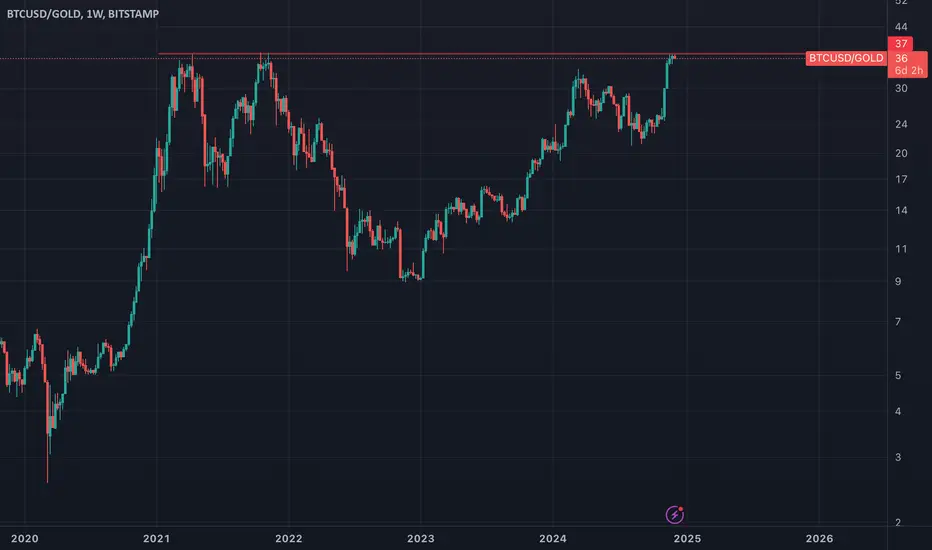
BTC/Gold: A Clean Retest Confirmation. Reversal point the BTC/Gold chart reveals a cleaner and more structured representation compared to the BTC/USD chart. The BTC/Gold ratio highlights a key retest of a significant support/resistance zone, which aligns with historical trends in this pairing.
This retest solidifies the validity of the level, providing a clearer technical setup for traders. The BTC/Gold chart eliminates much of the noise found in USD-denominated charts, offering a more precise outlook for potential bullish continuation or breakdown.
Profit targets and stop-loss placements should consider key Fibonacci levels and prior swing lows for strategic risk management.

BTC BUY**📈 BTC: Bullish Breakout Confirmed Despite Volatility 🚀**
We can see that **BTC has successfully broken a bearish trendline to the upside**, with a **converging retest** at both the trendline and the **previous support around 84,000**.
🔹 **Following Trump's speech, the market experienced high volatility**, but for now, **my setup remains intact**, especially since I'm in a **buy position**.
👀 **Keeping a close watch on further developments!** 💪🔥

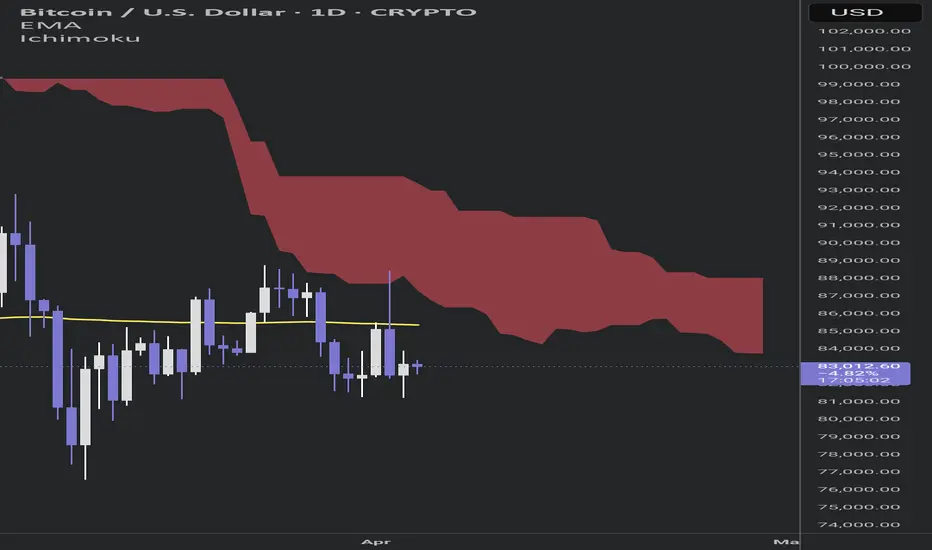
Bitcoin Price Analysis: Bearish or Neutral Trend Amid Key Resist
1. 200-Day Moving Average (Yellow Line):
The current Bitcoin price is below this moving average, indicating a bearish trend or weakness in upward momentum.
Typically, when the price is below the MA200, it acts as resistance, increasing the likelihood of further declines.
2. Ichimoku Indicator:
The red cloud in the future suggests a bearish outlook and may act as strong resistance.
The price is currently near the Ichimoku cloud, which indicates market indecision.
3. Price Candles:
The candles have not been able to establish a clear position above the MA200.
If the price fails to stabilize above $84,000, a drop to the $80,000–$78,000 range is likely.
If the MA200 resistance is broken, the price could rise toward $88,000.
Conclusion:
Based on the current data, the overall trend remains bearish or neutral unless the price successfully stabilizes above the MA200. Otherwise, a decline toward the $80,000 level is probable.
Best Regards
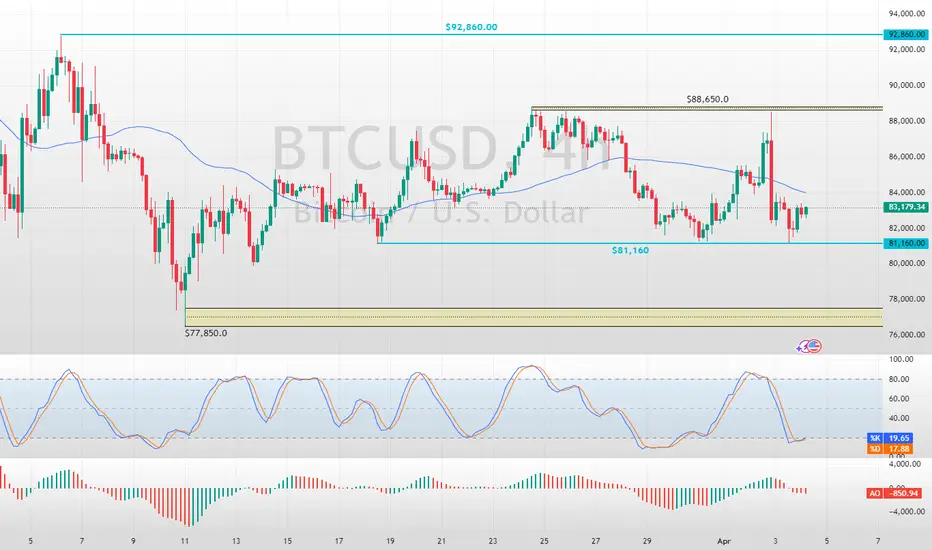
Bitcoin Technical AnalysisFenzoFx—BTC/USD trend outlook is bearish below $88,650.
A break below the immediate support of $81,160 can trigger a new bearish wave, targeting the next support area at $77,850.
Bitcoin Price Analysis: Bearish Trend Expected
#### **Analysis Details:**
- **Current Price:** $82,862
- **Stop Loss (SL):** $83,467 - $83,927
- **Take Profit 1 (TP1):** $82,213
- **Take Profit 2 (TP2):** $81,127
#### **Market Outlook:**
- The chart suggests a potential **downtrend** as price is facing resistance near **$83,467 - $83,927**.
- If price fails to break above this resistance, it may decline toward **$82,213 (TP1)** and further down to **$81,127 (TP2)**.
- The market appears to be forming a lower high, which indicates bearish momentum.
- Traders looking for **short positions** should consider entering around the current price with stop-loss above **$83,927**.
This setup suggests a **bearish movement** unless Bitcoin breaks above the **resistance zone**.

Navigating BTC Volatility Storm: Buy, Hold, or Flee?Bitcoin's recent price action has been reminiscent of a rollercoaster, leaving investors grappling with a whirlwind of conflicting signals. From sharp drops mirroring stock market turmoil to the looming "death cross," the cryptocurrency's trajectory is shrouded in uncertainty. Is this a prime buying opportunity, a warning to retreat, or simply another bout of the volatility that defines Bitcoin?
The past few days have been a stark reminder of Bitcoin's inherent volatility. Reports of an 8% drop, coupled with the US stock market shedding $2 trillion in value, sent ripples through the crypto sphere. The catalyst? Concerns surrounding potential US tariffs and their impact on the global economic outlook. This sudden shift in market sentiment triggered a sell-off, reminiscent of the COVID-19 crash in 2020, during which Bitcoin’s pre-pandemic gains evaporated.
Adding to the unease is the looming "death cross," a technical indicator that occurs when the 50-day moving average crosses below the 200-day moving average. Historically, this pattern has signaled bearish momentum. The 2022 death cross, for example, precipitated a significant price drop of nearly 20%. Conversely, "golden crosses," where the 50-day moving average crosses above the 200-day moving average, have historically signaled bullish momentum, triggering rallies of over 500% in 2020 and 2021.
Currently, Bitcoin's 50-day moving average is edging closer to this critical crossover, prompting widespread speculation. Is this a repeat of 2022, or will the market defy historical patterns? The answer, as always, is complex and contingent on a confluence of factors.
One significant factor is the strength of the US dollar. While the dollar's strength can often negatively impact Bitcoin, the current increase in the money supply could potentially counteract this effect, creating a bullish flag pattern. The dollar's inflation may become a catalyst for Bitcoin as a store of value. The global market dynamics are currently shrouded in uncertainty, making it difficult to predict the long-term impact of these factors.
The recent price drops have pushed Bitcoin towards the $80,000 mark, with some analysts predicting a potential fall to $71,000. However, this level could also represent a "sizeable bounce," acting as a strong support zone for Bitcoin. The concept of an "oversold bounce" also comes into play. After a period of intense selling pressure, markets often experience a relief rally as traders capitalize on discounted prices. Whether this materializes remains to be seen.
Is it a Good Time to Buy Bitcoin?
The decision to buy, hold, or sell Bitcoin depends on an individual's risk tolerance, investment strategy, and understanding of the market. Here's a breakdown to consider:
• For the Long-Term Investor:
o Bitcoin's long-term potential remains a compelling narrative. Its decentralized nature, limited supply, and growing adoption continue to attract institutional and retail investors.
o Price volatility is an inherent part of the Bitcoin journey. Historically, periods of sharp declines have been followed by significant rallies.
o Dollar-cost averaging (DCA) can mitigate the impact of volatility by investing a fixed amount at regular intervals, regardless of the price.1
o The strength of the US dollar may become a catalyst for Bitcoin as a store of value.
• For the Short-Term Trader:
o The current volatility presents opportunities for skilled traders to profit from price swings.
o Technical analysis, including monitoring moving averages and support/resistance levels, is crucial for identifying potential entry and exit points.
o However, short-term trading is inherently risky and requires a deep understanding of market dynamics.
o The "death cross" should be monitored carefully.
• For the Cautious Investor:
o The current market uncertainty may warrant a more conservative approach.
o Diversifying investments across different asset classes can help mitigate risk.
o Staying informed about market developments and avoiding emotional trading decisions is essential.
The Death Cross: A Warning or a False Alarm?
The "death cross" is a significant technical indicator, but it's not a foolproof predictor of future price action. Historical data show that while it can signal bearish trends, it's not always accurate. Market conditions, investor sentiment, and macroeconomic factors can all influence Bitcoin's trajectory.
Ultimately, the Bitcoin market remains highly speculative. The current volatility, driven by a confluence of factors, underscores the importance of careful research, risk management, and a long-term perspective. While the "death cross" and market fluctuations may cause short-term panic, the long-term potential of bitcoin, and it's reaction to the weakening dollar, may still produce long-term gains.

BTCUSDTap Into the mind of SnipeGoat in this quick market analysis of BTC as I breakdown what BTC is doing & what its about to do.
_SnipeGoat_
_TheeCandleReadingGURU_
#PriceAction #MarketStructure #TechnicalAnalysis #Bearish #Bullish #Bitcoin #Crypto #BTCUSD #Forex #NakedChartReader #ZEROindicators #PreciseLevels #ProperTiming #PerfectDirection #ScalpingTrader #IntradayTrader #DayTrader #SwingTrader #PositionalTrader #HighLevelTrader #MambaMentality #GodMode #UltraInstinct #TheeBibleStrategy

I'm bearish as can be, but this is a descending wedgeNo doubt about it, the chart here favors a small pump on the 1h chart. Could even take one more leg down to around 80 and still rise up out of this bullish pattern.
Thoughts?

BTCUSD 9/6/2024BTCUSD is now still in the premium area where after the sweep price external daily low.
I expect there will be a fall towards the discount in the near future. But I will wait for the price to enter the area that has been broken.

BTCUSD FEBRUARY 25
December high and low price swiped
January failed to close above high or low December which indicate no bias decision for monthly.
To do : January (OLHC) but failed to close above December price. Normally price will return back to its Open price. Monitor bias from weekly behaviour

BTC STILL CONSOLIDATINGBitcoin continues to coil within the symmetrical triangle on the daily chart, now approaching the apex with growing tension. Price was sharply rejected from both the 50-day and 200-day moving averages, but critically – it held diagonal support. That alone keeps the structure intact and the potential for a breakout alive.
Volume ticked up slightly, showing there’s still life in this move. Until the lower trendline gives way, this remains a neutral-to-bullish consolidation pattern. A clean break above the descending resistance would likely ignite a new leg up, especially if confirmed with volume. Conversely, a break below support would invalidate the higher lows and flip the bias bearish.
With both moving averages pressing down and support refusing to break, Bitcoin is playing a game of tug-of-war – and the winner could set the tone for weeks to come.
