BEARUSD trade ideas

BTC? 2.4M Cathie said by 2030
CATHIE WOOD SAID:
www.tradingview.com
Wow..
I like the idea 24X
Below 100k will look like peanuts from moon.
300 to 17000 took 830days
3800 to 55000 took 800 days
IF now is day 5 of this bullish move >> It will end somewhr in August 2027 :)
Say you are on for this ride.
Don't look at charts daily.
A 5000$-10000$ swing/ move is jiffy
What's your plan?
Definitely for this investment is should be your... not in use $
or DCA (I heard)
IDK
All the best guys
Hope you be safe & enjoying your weekend.
Obviously not a guru

uptrendThe trend change is expected to form within the specified support range and time frame and we will witness the start of an upward trend.

Bitcoin is showing resistence this level is key level and the bitcoin might go down....swipping liquidity to the moon

double three (running)Took a harder look at the surge in the price of bitcoin. It turns out we may have a running double three (WXY) for wave 2.
W is a flat, X is a zigzag and Y is a triangle. And the end of wave 2 is higher than the end of wave 1, thus we call this double three combination a running variation. A strong and powerful wave 3 should follow next with at least 1.618 of wave 1. It could be 2.618 of wave 1, but it definitely will be an extended third wave.

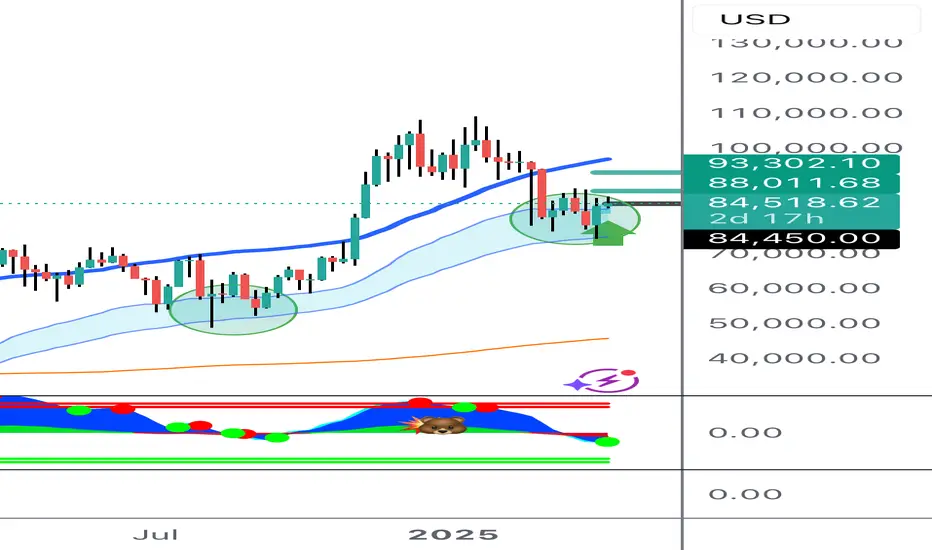
Bitcoin buy 84450 from weekly support Bitcoin declined to test weekly support SCD band.
This is second test in current run. First test was around 55000.
This second test. Usually first and second tests of blue support SCD band provide a good buying opportunities. And everything after third test is not reliable . At the same time on 4hr chart bitcoin breaking above the block of resistance moving averages and now sitting on top .
Buy 83500-84500 for continuation of the upmove to test top Bolinger on 4 hr chart first around 88000 and then test of top Bolinger in weekly around 93300.
$BTC $GOLD Performance% Comparison Chart (Apr '24-Apr '25)Performance% Comparison Chart (Apr '24-Apr '25)...
CRYPTOCAP:BTC surges back, locking in a 42% gain alongside TVC:GOLD over a year! S&P 500 shows life, but #Oil is the big loser, taking the biggest hit with a brutal -26% decline. Let's watch the shifts! But where does the momentum go next?!🤔
CRYPTOCAP:BTC TVC:GOLD SP:SPX MARKETSCOM:OIL
Cheers!

Price targetsBased on previous moves, time over the center and momentum I marked possible price target spots and circled the general area. Enjoy!

BTCUSD 1H ForecastHello guys I hope you are well let me tell you that right now the order is stuck at the Bearish OB, so we will sell from here and this will remain our target until the Bullish OB and after that, our next target will remain ours until the resistance area.

would you look at that ...Looks like my imaginary lines are secretly controlling the price of BTC—haha!

BTC on THE WAY UP .....Broken out of the falling Channel. just took supp at 50% of fall from ATH to recent low.
TIME TO RISE...... Lete See ;)

btc . bullish tp HIT . no more LONGS . rather SHORTthe bullish progression went well. now out of the LONG trade.
we're on SELL for the DAY. NO LONGS, risk/reward is crap.
we're on LONG once we see a decline and support holding, preferably during session timing confluence.
looking to SHORT with confluence and Session timing. towards 87k or lower.
looking to LONG with confluence from 87k if holds.

Bitcoin short-term buyBitcoin's recent bear movement has raised some buying opportunity in the short-term. There is a potential buy opportunity you can consider.

BTCUSDT- high placed? What's next??#BTCUSDT - well after a fantastic bull run market placed a reasonable high in yesterday,
Keep close that region b cause if market hold it in that case we can expect a drop from here.
Good luck
Trade wisley

BTC Breakout!??Btc breakout after a long consolidation, back down to the 88k-90k or to a 618 long term support level.Bouncing off 75k.
Looks like BTC is having a nice breakout. First wave to the first major resistance $94k. Are we going to get a small pull back consolidation and a second wave to $96 or $111k?


Please explain in BTC what happened between 10 to 10.30 am ISTHi BTC Trader,
Can someone explain what happened with this huge move in BTC in half hour time. I am not getting any news that can such a huge impact.

BTCUSD – Short Trade Setup!📉 🔻
Pair: Bitcoin / U.S. Dollar (BTCUSD – Bitstamp)
Timeframe: 30-Min Chart
Pattern: Rising wedge breakdown + retest failure
💼 Trade Plan – Short Position
🚫 Entry: $93,488 (Breakdown from wedge + retest rejection)
✅ Stop-Loss: $94,408 (Above structure resistance & wedge high)
🎯 Take Profit Targets:
TP1: $92,414 – Nearest support from recent structure
TP2: $91,182 – Strong horizontal support zone
⚖️ Risk-Reward Calculation
Risk per BTC: $920
Reward to TP2: $2,306
R:R Ratio: ~1 : 2.5 — High-probability short setup
🔍 Technical Highlights
Rising wedge pattern breakdown (bearish signal)
Price rejected key resistance near $94K
Retest + failure = confirmation for downside move
Momentum slowing with potential bearish divergence

Daily Price Action: Bitcoin BTCUSD Wednesday 4/23/2025In this video, we will be looking into the potential price action of BTCUSD.


BTC going back to 90kBTC has taken resistance as I shared in previous publish and now possibly going back to 90k.

BTC may drop back to 90,000 pointsBTC is likely to pull back to around 90,000 points before starting to rebound.
In terms of capital flow, the upward momentum of XAU/USD has been temporarily halted ⏸️, and a large amount of capital is rapidly flowing into the virtual currency market 💸! As the leader of virtual currencies, Bitcoin has undoubtedly become an important destination for capital inflows 🌟. The injection of a large amount of capital has directly driven a significant surge in the price of BTC 📈. Capital chases profits just like water flows 🌊. Against the backdrop of the phased adjustment in the gold market, Bitcoin, with its unique technological attributes and market vitality, has attracted the attention of many investors, laying a solid capital foundation for its subsequent price increase 🏗️.
At the macro policy level, Trump's remarks have had a strong impact on the financial market 😲! His change in attitude towards Fed Chairman Powell has triggered the reallocation of market funds 🔄. When he previously threatened to remove Powell, investors' concerns about the Fed's policy intensified, and they flocked to the gold market for hedging, pushing up the gold price 🚀. However, Trump's latest statement that he will not fire Powell and his call for interest rate cuts have alleviated some of the investors' anxiety, prompting funds to flow back into US dollar - denominated assets 📉. It should be noted that during this process, some of the funds withdrawn from the gold market have not fully returned to traditional US dollar assets but have flowed into the virtual currency field such as Bitcoin 💥. As an emerging digital asset, Bitcoin has both certain hedging and speculative attributes, and has become a new safe haven and value - added target for funds 💰.
In international trade, Trump has shown signs of easing in the trade negotiations with China and is trying to reach an agreement quickly to reduce tariffs (although not to zero) 🤝. The past uncertainty in trade relations was one of the important factors driving up the gold price ⚠️. With the expected easing of trade tensions, potential future trade easing measures may suppress the market demand for gold as a safe haven asset ⏳. In contrast, the Bitcoin market is less directly affected by trade policies. Instead, due to its characteristics such as decentralization and global circulation 🌐, it has gained more favor during the process of capital reallocation. When the attractiveness of traditional safe haven assets declines, the scarcity and innovation of Bitcoin make it a new choice for investors to diversify risks and pursue returns 🎯, further stimulating the market demand for BTC 📈.
⚡⚡⚡ BTCUSD ⚡⚡⚡
🚀 Sell@92000 - 92500
🚀 TP 91000 - 90000
The market has been extremely volatile lately 📈📉 If you can't figure out the market's direction, you'll only be a cash dispenser for others 💰

BTCUSD 15 M ForecastHello guys, I hope you are well now let me tell you that yesterday we hit the target in 15 minutes, you can see it, and the target we are giving now will remain our target from the order block bearish to the bullish order block.
