BITCOIN BEARISH TRADE IDEA (H1)BTC/USD has been rejected at the resistance zone of $85,148-$85,714, which aligns with a descending trendline, signaling potential bearish momentum. The price is currently testing an ascending trendline from $74,000.
Analysis
The rejection at $85,148-$85,714, combined with the descending trendline, indicates strong selling pressure at this level.
The ascending trendline is providing support, but a break below it could lead to a move toward lower support levels.
A break above the resistance zone would invalidate the bearish setup and suggest potential bullish continuation.
Key Levels to Watch
Resistance: $85,148-$85,714
Support: Around $81,410
Ascending trendline: A break below is an extra confirmation for bearish momentum.
Rationale
The confluence of the resistance zone and the descending trendline marks a critical decision point. The recent rejection strengthens the bearish outlook, but the ascending trendline remains a pivotal factor for the next move.
BEARUSD trade ideas

bitcoin buy longnew sentiment long, 3rd touch trendline
#forex
#bitcoin
#crypto
use proper risk management


BTCUSD 4/20/2025Come Tap into the mind of SnipeGoat, as he gives you a beautiful, orchestrated analysis of Prices past endeavors, to Precisely determine Bitcoin's next move.
_SnipeGoat_
_TheeCandleReadingGURU_
#PriceAction #MarketStructure #TechnicalAnalysis #Bearish #Bullish #Bitcoin #Crypto #BTCUSD #Forex #NakedChartReader #ZEROindicators #PreciseLevels #ProperTiming #PerfectDirection #ScalpingTrader #IntradayTrader #DayTrader #SwingTrader #PositionalTrader #HighLevelTrader #MambaMentality #GodMode #UltraInstinct #TheeBibleStrategy

bitcoin short sellbearish
lowers lows
momentum downwards
#crypto
#forex
# bitcoin
use proper risk management

bitcoin for a buy 4hr time frame is uptrend after break of structure. We trigger our entry from lower time frame which is 15 minutes.
Conclusion:Bitcoin for a buy.

Trade Review for FX,Indices and many More!(Week 16,14-18Apr2025)Hello fellow traders , my regular and new friends!
How was your trading this week?
Have you took any trades on these pairs i mentioned last week?
EURUSD
EURAUD
EURNZD
BTC
USDSGD
Come on in to review our week 16. :)
-- Get the right tools and an experienced Guide, you WILL navigate your way out of this "Dangerous Jungle"! --
*********************************************************************
Disclaimers:
The analysis shared through this channel are purely for educational and entertainment purposes only. They are by no means professional advice for individual/s to enter trades for investment or trading purposes.
*********************************************************************

BTC Weekly Analysis: Potential Bullish ContinuationHello Traders!
Today, I'm sharing a detailed technical analysis of BTCUSDT on the weekly timeframe, highlighting key insights from two powerful indicators: Micro Dots with VMA Line and the Wyckoff Phase Oscillator.
Why These Indicators?
Micro Dots with VMA Line:
This indicator provides clear signals (strength and weakness dots) and dynamic trend lines, helping identify trend continuations and reversals.
Wyckoff Phase Oscillator:
Combines RSI, MACD, and OBV into one oscillator, clearly identifying market phases (Accumulation, Distribution, Markup, Markdown).
Technical Breakdown:
Price Action & Ichimoku Cloud:
Current Price: $85,216.50
BTC is trading above the Ichimoku Cloud, suggesting a bullish long-term trend.
Strong support around $79,000 provided by Ichimoku Cloud.
Micro Dots with VMA Line:
Micro Dots: Currently neutral (no clear bullish or bearish dots), indicating market indecision.
VMA Line: Price is near the VMA line, acting as dynamic support. A bullish crossover above this line would strengthen bullish sentiment.
Wyckoff Phase Oscillator:
Oscillator Reading: 33.21, just above the Accumulation Zone (29.33 - 29.29), suggesting a potential shift from Accumulation to Markup.
Signal Line: Approaching a bullish crossover, indicating potential bullish momentum.
OBV (Volume Confirmation): Stabilizing, indicating accumulation and potential bullish momentum.
Volume Analysis:
Recent volume spikes suggest increased market interest, supporting potential bullish continuation.
Trade Idea & Targets:
Scenario: Cautiously bullish continuation.
Entry: Wait for a green bullish dot to confirm bullish momentum and crossover above VMA line.
Stop-Loss: Below Ichimoku Cloud support (~$79,000).
Take-Profit Targets: Primary target at recent highs ($101,821.96), secondary target at supply zone ($106,088.86).
Actionable Steps & Confirmations:
Micro Dots: Wait for a green bullish dot to confirm bullish momentum.
VMA Line: Look for bullish crossover above the VMA line.
Wyckoff Oscillator: Confirm bullish crossover above the signal line, clearly entering Markup phase.
Volume: Monitor for sustained or increasing volume.
Risks & Considerations:
Currently mixed signals (neutral Micro Dots, oscillator near accumulation) suggest caution. Maintain conservative position sizing until clearer bullish confirmations appear.
Strategy Type:
Momentum (trend-following) strategy is most appropriate, aiming to capitalize on potential bullish continuation.
Good luck and trade safely!

BTC/USD Operation Strategy AnalysisCurrently, the market is approaching the previous high (84994), favoring a “false breakout” pattern.
84200 although reasonable support, but the volatility is limited should be segmented take profit, such as to 84550 when the first flat 50%, the remaining single capital preservation tracking.

BTCUSD – Long Trade Update!🟢
Breakout from falling wedge with strong momentum.
Clean retest held, confirming bullish continuation.
Watching next resistance zone for potential reaction.
Structure remains intact unless support breaks below.

Inverted Head & Shoulders Pattern for BTC??!!!??!Bitcoin appears to be trading in an inverted h&s pattern.
Which coincides with a bullish breach of a Bullish Expanding Triangle highlighted in red to the upside!!
A double bottom is where the head of the inverted triangle can be formed, the space between the two bottoms forms the apex of the head of triangle.
First upside target of $90k USD
Second upside target is $260k USD


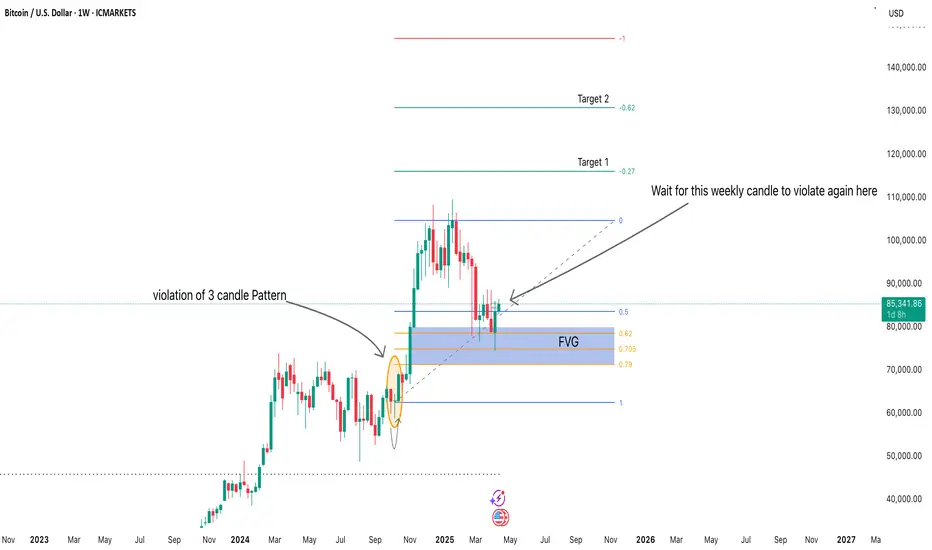
Bitcoin Weekly Outlook (April 2025)Price has respected the Fair Value Gap (FVG) and is showing signs of potential bullish continuation.
Waiting for a weekly candle body close above the highlighted structure to confirm continuation.
Targets set at key Fibonacci extension levels.
Patience is key — confirmation before entry to minimize risk.
"Let the market show its hand. No confirmation, no trade." 🚀
BTCUSD (M30) NEW ANALYSIS RSI BULLISH
**🔹 Trend:** Short-term consolidation, larger trend still bullish
**🔹 Your Avg. Entry:** ~$83,500
**🔹 Immediate Resistance:** $84,600 – $85,200
**🔹 Strong Resistance:** $86,000 – $86,800
**🔹 Support Zone:** $83,000 – $82,600
**🔹 Key Psychological Level:** $80,000
---
### 📈 Trade Management
**✅ Targets:**
- **TP1:** $84,800 (previous rejection zone)
- **TP2:** $85,800 (near-term high)
- **TP3 (if momentum strong):** $86,800 – $87,200
**❌ Stop-Loss Options:**
- Conservative: Below $82,500
- Aggressive: Below $81,900 (structure breakdown confirmation)
**🔁 Add More?**
- Optional last buy zone: $82,600 – $81,800 (only if BTC shows wick + strong bounce on M30 or H1)
---
### 📊 Indicators to Watch (on M30)
- **RSI > 50:** Bullish continuation
- **MACD crossover + histogram green:** Strength building
- **Price holding above EMA50:** Trend intact
---
🔒 Risk Tips
- Use trailing SL if price breaks $85.5k+
- Be cautious if price breaks down and consolidates below $82.5k (could flip bias to bearish)
- Don’t overleverage near resistance

Bitcoin at a resistance.If price breaks, we might see a continuation in rally. And if price bounces, we might see sellers taking lead for a while.

Bitcoin sell to 65K?Follow up on my weekly idea.
There is potential sell in the incoming days on the daily chart
Stop loss: 86900
Take profit: Around 65k

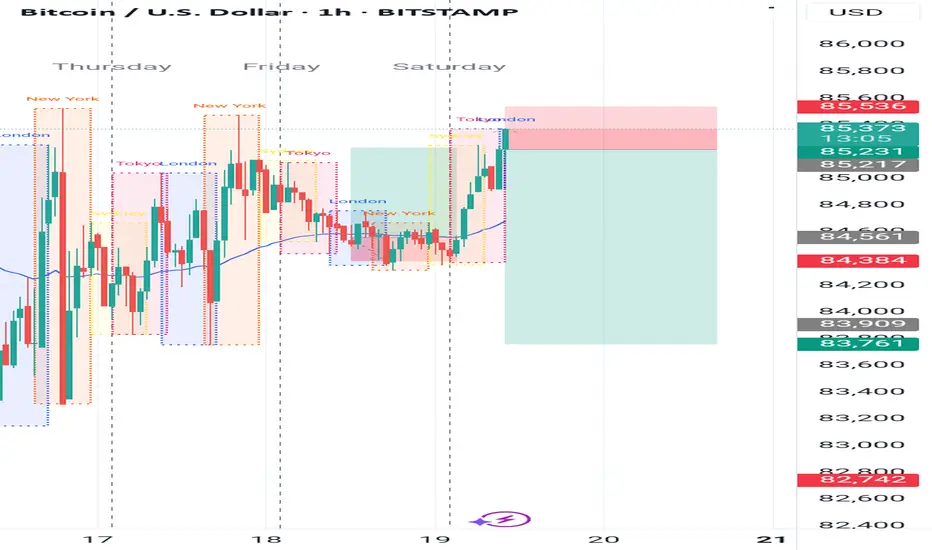
BTCUSD ORDER BLOCK 19042025This is just for my own reference.
Wait for possible BOS, COCH for confimation. No Confirmation No Entry.

Boot2//@version=5
strategy("Auto Trader Bot by ZSoft ", overlay=true, default_qty_type=strategy.percent_of_equity, default_qty_value=100)
// تنظیمات کاربر
vwmaLength = input.int(31, title="VWMA Length")
vwmaOffsetRatio = input.float(0.989, title="VWMA Offset Ratio")
emaBaseLength = input.int(19, title="EMA Base Length")
emaOffsetRatio = input.float(0.912, title="EMA Offset Ratio")
rsiThreshold = input.int(52, title="RSI Threshold")
ema15mLength = input.int(30, title="15m EMA Length")
tradeStartHour = input.int(9, title="Trade Start Hour")
tradeEndHour = input.int(19, title="Trade End Hour")
// اندیکاتورها
vwma = ta.vwma(close, vwmaLength)
vwmaLine = vwma * vwmaOffsetRatio
emaLen = math.round(emaBaseLength * emaOffsetRatio)
emaLine = ta.ema(close, emaLen)
rsiVal = ta.rsi(close, 25)
ema15m = request.security(syminfo.tickerid, "15", ta.ema(close, ema15mLength))
// امتیاز سیگنال
score = 0
score += close < vwmaLine ? 1 : 0
score += close < emaLine ? 1 : 0
score += close < ema15m ? 1 : 0
score += rsiVal < rsiThreshold ? 1 : 0
score += rsiVal < 30 ? 1 : 0
// تحلیل زمانی
inTime = (hour >= tradeStartHour and hour <= tradeEndHour)
// آنالیز سود/ضرر روزانه
var float dayProfit = na
var int today = na
if na(today) or dayofyear != today
today := dayofyear
dayProfit := 0.0
// فقط وقتی روز جدید شروع بشه، سود روزانه آپدیت بشه
if strategy.closedtrades > 0
lastTradeDay = dayofyear(time )
if lastTradeDay == today
dayProfit += strategy.closedtrades.profit(strategy.closedtrades - 1)
// شروع ترید فقط وقتی:
allowTrade = (dayProfit >= 0) and inTime
longCond = score >= 4 and allowTrade
shortCond = score <= 1 and allowTrade
if longCond
strategy.entry("LONG", strategy.long)
if shortCond
strategy.entry("SHORT", strategy.short)
// نمایش سود روز و امتیاز
plot(score, title="Signal Score", style=plot.style_columns, color=color.new(color.lime, 0))
plot(dayProfit, title="Daily Profit", color=color.new(color.yellow, 0), linewidth=2)
// نمایش روی چارت
label.new(bar_index, high,
text="Profit Today: $" + str.tostring(dayProfit, "#.##") + " Score: " + str.tostring(score),
style=label.style_label_down, textcolor=color.white, color=color.gray, size=size.small)

Brotfrom pyrogram import Client, filters
from flask import Flask, render_template_string
import threading
# تنظیمات API تلگرام
api_id = 1234567 # مقدار واقعی خود را جایگزین کنید
api_hash = "your_api_hash"
bot_token = "your_bot_token"
app = Flask(__name__)
# HTML رابط کاربری با تم ماتریکسی
html_page = """
FLASHMYWALLET
body {
margin: 0;
padding: 0;
background: black;
color: #00ff00;
font-family: monospace;
overflow: hidden;
}
canvas {
position: fixed;
top: 0;
left: 0;
z-index: -1;
}
.container {
padding: 20px;
}
button {
display: block;
margin: 10px 0;
padding: 10px;
font-size: 16px;
background: #003300;
color: #00ff00;
border: 1px solid #00ff00;
width: 100%;
}
FLASHMYWALLET
FLASH BTC
FLASH USDT
SELL YOUR PI COIN
FEES/ABOUT
const canvas = document.getElementById("matrix");
const ctx = canvas.getContext("2d");
canvas.height = window.innerHeight;
canvas.width = window.innerWidth;
const letters = Array(256).join("1").split("");
const draw = () => {
ctx.fillStyle = "rgba(0, 0, 0, 0.05)";
ctx.fillRect(0, 0, canvas.width, canvas.height);
ctx.fillStyle = "#0F0";
letters.forEach((y_pos, index) => {
const text = String.fromCharCode(3e4 + Math.random() * 33);
const x_pos = index * 10;
ctx.fillText(text, x_pos, y_pos);
letters = y_pos > canvas.height + Math.random() * 1e4 ? 0 : y_pos + 10;
});
};
setInterval(draw, 33);
"""
@app.route("/")
def index():
return render_template_string(html_page)
# پیکربندی ربات
bot = Client("flashwallet", api_id=api_id, api_hash=api_hash, bot_token=bot_token)
@bot.on_message(filters.command("start"))
async def start(client, message):
await message.reply(
"""Hello dear
Welcome to FLASHMYWALLET bot
Please proceed with what you want to do:
FLASH BTC
FLASH USDT
SELL YOUR PI COIN
FEES/ABOUT"""
)
# اجرای همزمان Flask و Pyrogram
threading.Thread(target=lambda: app.run(host="0.0.0.0", port=8000)).start()
bot.run()

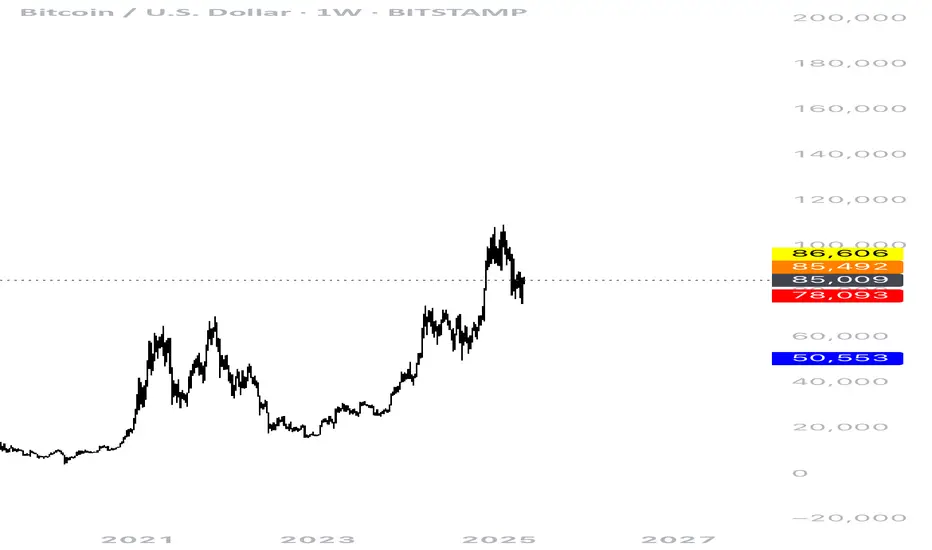
Bitcoin 200K & Gold 6K-7KI do believe we will see bitcoin at $200,000 within the next two years and Gold at $6,000-7,000/31.1 Grams within the next two to five years.
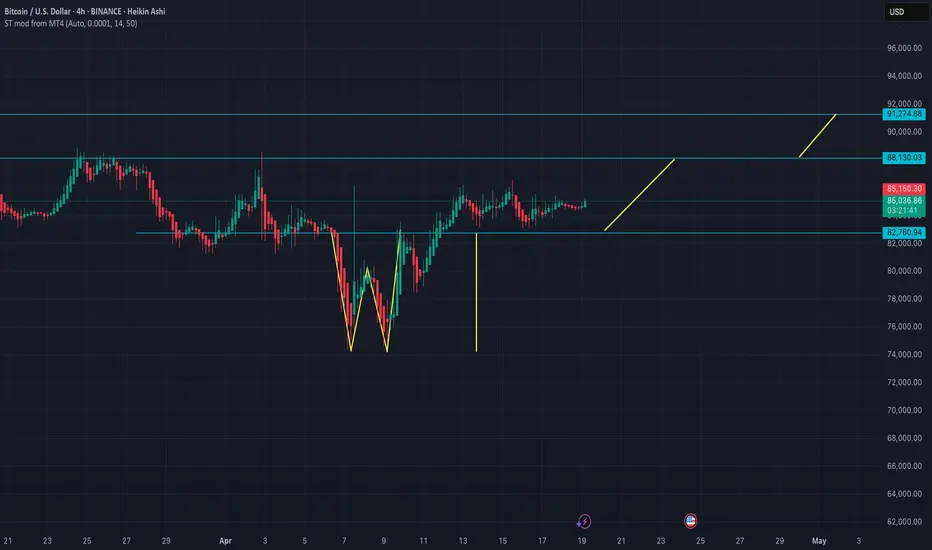
levels to watch The market has formed a W pattern and is currently trading above the neckline. The measured move from this pattern points to a target of 91,300.
What’s particularly interesting is that 91,300 also coincides with the neckline of a previous top, which could act as a significant resistance level — likely sparking a strong battle between buyers and sellers at that point.
If the market manages to reclaim and hold above 91,300, we could see a continuation toward the 108,000 and 125,000 levels.
I’m currently long on BTC from 78,000. My plan is to take partial profits around 88,130 and close the remainder at 91,300. From there, I’ll reassess based on the market’s reaction and look for the next directional cue.
BTC to the upsideeAccumulation on the daily trendline..impulsive move anytime soon. Watch out for bear trap before taking off.
