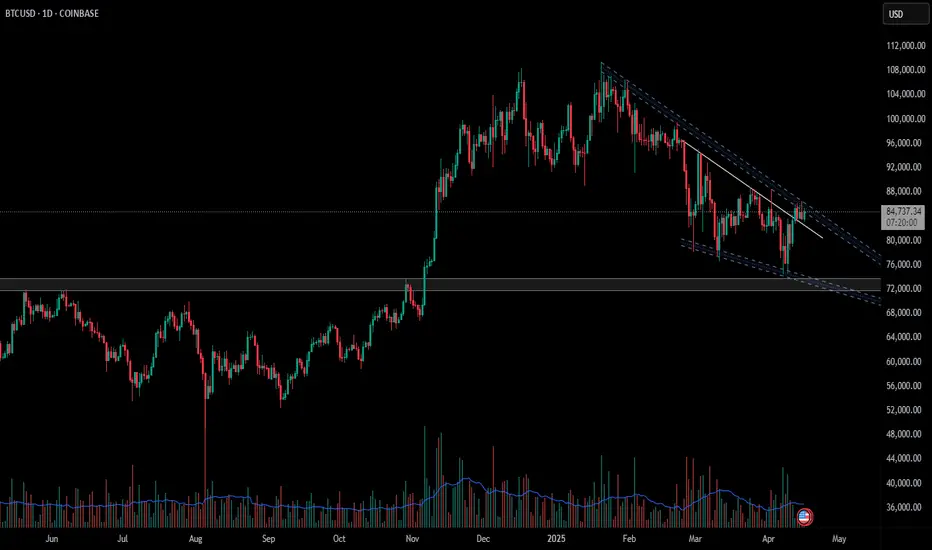
BtcusdFirstly my apologies for the messy chart,Pattern broker and retested and I had a three move touch on my resistance marked with a rectangle
BEARUSD trade ideas

* BTC Elliot Waves Update: 2 Scenarios *I hope everybody has been making money these past few days!
I'm once again bringing an update on the scenarios we currently have.
These are the scenarios I'll be watching for the rest of this week.
Enjoy it!

Bitcoins path to sub 10KTake a look at the fractal from 21. The parabola and all the EMA's line up almost perfect...
BE CAUTIOUS HERE!!!

BITCOIN TO 20.000Possible Bitcoin Drop to $20,000: What’s Behind the Bearish Outlook?
Bitcoin is facing increased selling pressure amid broader market uncertainty, raising the possibility of a drop to the critical $20,000 support level. Several factors are contributing to this bearish scenario, including tighter monetary policies, reduced investor confidence, and declining trading volumes. Technical indicators also show signs of weakness, with key support levels being tested and a lack of bullish momentum. If market sentiment continues to deteriorate, a correction toward $20,000 could become a reality. Traders and investors are closely watching for signs of stabilization or further downside movement.

1. Insider Sentiment Detector Prompt: "You’re a hedge fund analyYou’re a hedge fund analyst. Analyze current macroeconomic trends and sentiment shifts using Reddit, X, and Google Trends. Return 3 undervalued assets likely to reverse soon. Format: Asset - Reason - Sentiment Source.

possible breakout for long term investment (1D TF chart)Previously, Bitcoin faced rejection and dropped sharply after touching the upper trendline. However, this time, it's showing strength by consolidating near the same level for the last 5 days. This could indicate accumulation or a potential breakout attempt.
BTCUSD 4h FORECAST ANALYSIS Hello Guys hope you're all well
Guys, let me tell you that our analysis from 84K onwards will remain our target until our next bearish 88K Final Target
So we can hope it will go continue bullish candle on 88k

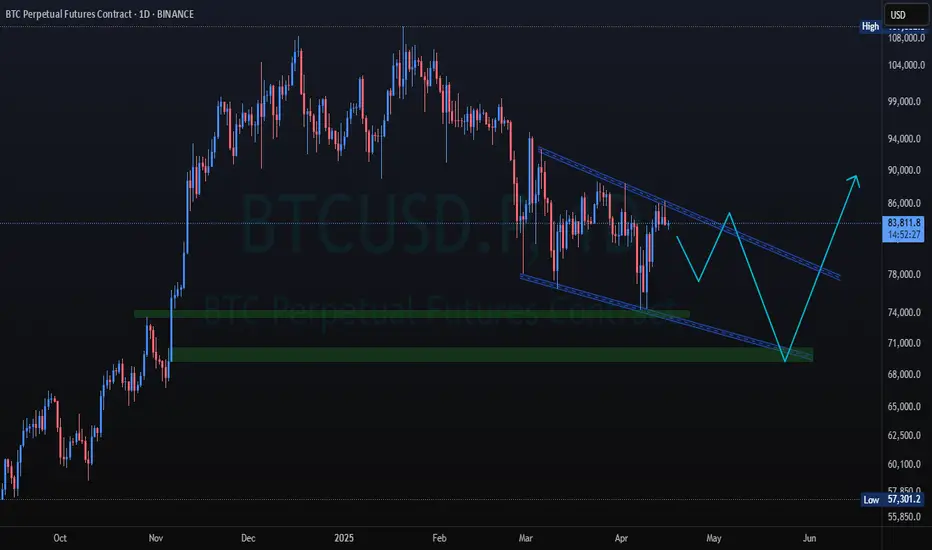
Bitcoin’s Bullish Path: Eyeing the Order Block ZoneIn my personal technical analysis, Bitcoin appears poised to revisit the order block zone between $73,000 and $69,000. If price reacts strongly from this area, following the blue trendlines I've drawn, it could resume its upward trajectory toward the top of the channel. This bullish momentum has the potential to play out through the end of 2025.

Bitcoin’s Bullish Path: Eyeing the Order Block ZoneIn my personal technical analysis, Bitcoin appears poised to revisit the order block zone between $73,000 and $69,000. If price reacts strongly from this area, following the blue trendlines I've drawn, it could resume its upward trajectory toward the top of the channel. This bullish momentum has the potential to play out through the end of 2025.
Best Regards

BITCOIN Supply Demand Short ALERT1) See picture for full analysis...
Higher Timframe:
-Price inside supply
-Trend = downtrend
-Stochastic RSI overbought
Lower Timeframe:
-Need break to break support + break upward trend-line + quality supply created.
- IF price does the following then possible pullback for short OR look for scalp/day-trade shorts
to the downside with 1TF setups.
#supplyanddemand #supportandresistance

BTC STILL STRUGGLINGBitcoin continues to struggle with the 50-day moving average, currently acting as dynamic resistance. Price is hovering just below it, unable to break through cleanly, and the 200 MA remains overhead, adding additional pressure from above.
Market structure remains bearish for now – we’re still printing lower highs and lower lows. That structure won’t flip until Bitcoin can break decisively above $88,804, the last significant swing high from late March. A close above that level would mark a higher high and potentially signal a trend reversal.
Until then, it’s just a relief rally within a broader downtrend. The bulls need to reclaim key levels with conviction – otherwise, this could be a pause before another leg lower.

BTCUSD Liquidity SweepAll my trade entry are based on volume and liquidity and that’s what the market respect.
I’m currently long on BTCUSD

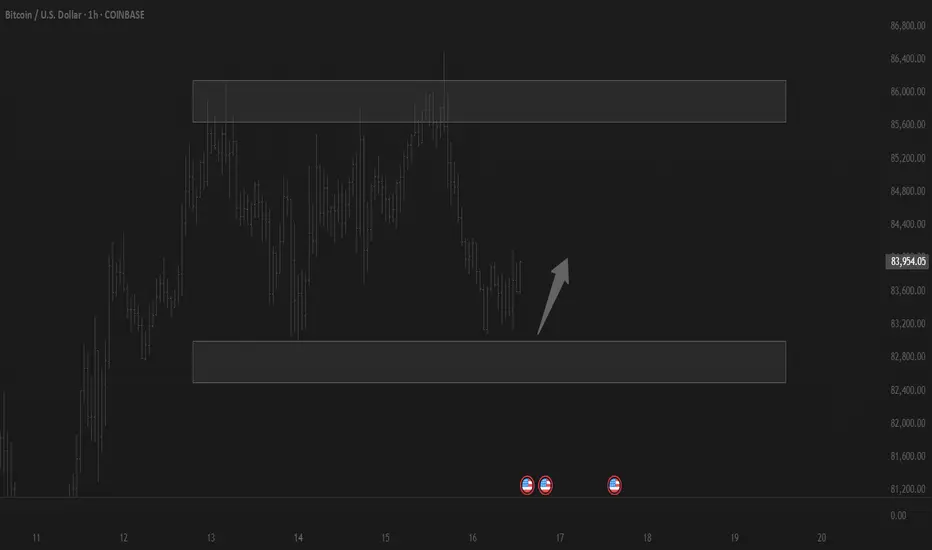
Trading balanceTrading balance The price of the asset has rebounded from the balance zone. With the prospect of growth into the resistance zone.
Bitcoin to $70K? My LSTM Model Thinks So📈 Bitcoin to $70K? My LSTM Model Thinks So 🚀
I've been working on an LSTM (Long Short-Term Memory) neural network designed to forecast Bitcoin prices, and the results are exciting. My model analyzes historical BTC data and learns temporal patterns to predict future movements. After extensive training and optimization, it reached an accuracy of around 96% on the training set.
🔍 How it works:
LSTM networks are especially powerful for time-series forecasting because they can capture long-term dependencies and trends in data. I trained my model using historical daily BTC prices, letting it learn the complex patterns and volatility that define crypto markets. The model takes sequences of past prices and uses that context to project the price movements of the next 30 days.
📊 The Forecast:
Based on the model's output, my current prediction is that Bitcoin will reach $70,000 within the next 30 days. This projection isn’t just a guess – it’s backed by a deep-learning model built to handle the chaotic nature of crypto.
⚠️ Note:
While the training accuracy is high, real-world conditions can differ, and models should always be taken as tools—not certainties. I’m sharing this analysis to contribute to the community and spark discussion.
Would love to hear your thoughts or see if others are seeing similar trends! 👇
#Bitcoin #BTC #CryptoAnalysis #MachineLearning #LSTM #BitcoinForecast #CryptoTrading

BTCUSD next move(expecting a bearish move)(16-04-2025)Go through the analysis carefully, and do trade accordingly.
Anup 'BIAS for BTCUSD (16-04-2025) (MID TERM)
Current price- 83,800
wait for the break-out
"if Price stay below 85,800 then next target is 81800, 79,800 and 76000 above that 88,000.
-POSSIBILITY-1
Wait (as geopolitical situation are worsening )
-POSSIBILITY-2
Wait (as geopolitical situation are worsening)
Best of luck
Never risk 2% of principal to follow any position.
Support us by liking and sharing the post.

BitcoinBTCUSD
- Falling Wedge as an Corrective Pattern in Long Time Frame
- Break of Structure
- S / R Level
- Completed " 12345 " Impulsive Waves
- Order Block

Bitcoin Facing Rejection Around the $86K Marker.
Based on Daily TF chart key level to watch is $84.5K.
The Case of bulls and bears:
If bulls fail to reclaim and hold above this 84.5K level, we could see a potential drop toward the FWB:67K – GETTEX:59K zone. Re-capturing 84.5k level pump target 88k to 99k level.
What’s especially worth watching now is the MACD:
Will it cross above the zero line, hinting at renewed bullish momentum,
or will it roll below and confirm a stronger downtrend continuation?
No predictions here — just sticking to the trend and watching price action unfold.

Supply and Demand by Thapelo Consolidation and Expansion
The markets either do one of two things: Price either consolidates or expands.
Consolidation: a period in the market where price is moving calm which moves in a range known as the dealing range. We will be able to identify a clear high and low to this range.
You have probably heard of the term range bound, ranging, or consolidating. This means that price is typically staying in one area, and just moving sideways, rather than up or down.
The range can be tight (meaning a spread of only a few pounds), or the range can be loose (meaning a spread of hundreds of thousands of pounds from range high to low. This partly will come down to the timeframe implemented.
Expansion: a period in the market where price is moving aggressively in one direction or the other. We will see an impulsive move to the upside, or an impulsive move to the downside, where price will give us large candle bodies or wicks. This is known as expansion.

Bitcoin is very unlikely that it will move like this! (5%)It is more likely that if it can break the channel ceiling from here, it will move to higher numbers, but if not, this can also happen!
BITCOIN Sell everything in October!Yep, kind of a clickbait title but it doesn't fail to serve justice to this very important Bitcoin (BTCUSD) chart.
Today's analysis displays in the most illustrative way the extremely tight symmetry between BTC's Cycles and how this can help us time our Sell at the Top of the Cycle and equally have the patience to buy as close to the next Bottom as possible.
As you see, in the past +10 years since the 2014 Bear Cycle, every Cycle has almost identical time ranges/ durations. All three Bear Cycles since then, lasted for approximately 1 year, and both Bull Cycles for almost 3 years (152 weeks, 1064 days to be exact). More specifically, the last two Bear Cycles were exactly 1 year long, the 2018 one started on the week of December 11 2017 and ended on December 10 2018 and the next Bear Cycle started on November 15 2021 and ended on November 07 2022. So it's been December-to-December and November-to-November Bear Cycles respectively.
If this high degree of symmetry continues to hold, counting 1064 days from the last Cycle Bottom o November 07 2022, gives a time estimate for the next Cycle Top on (the week of) October 06 2025. If also that holds for the Bear Cycle, expect an October-to-October duration, with an approximate bottom on October 12 2026.
So Sell everything up to October 2025 and Buy back as we get close to October 2026 is the strategy?
Feel free to let us know in the comments section below!
-------------------------------------------------------------------------------
** Please LIKE 👍, FOLLOW ✅, SHARE 🙌 and COMMENT ✍ if you enjoy this idea! Also share your ideas and charts in the comments section below! This is best way to keep it relevant, support us, keep the content here free and allow the idea to reach as many people as possible. **
-------------------------------------------------------------------------------
💸💸💸💸💸💸
👇 👇 👇 👇 👇 👇

BTC/USD Short Setup – Triple Top Reversal with EMA Confirmation Entry Point (Sell): Around $85,699.52
Stop Loss: $86,741.44 (above resistance zone)
Target (Take Profit): $82,982.09
This provides a Risk-Reward Ratio of approximately 1:2, a commonly acceptable ratio in trading.
📈 Indicators:
EMA 30 (Red) is currently above the EMA 200 (Blue), indicating bullish momentum—but this setup anticipates a trend reversal.
If price breaks below the EMAs, that would confirm bearish strength.
🧠 Conclusion:
This setup is based on:
A strong resistance zone,
Bearish reversal pattern (triple top),
Risk management via stop loss and take profit levels.
If you're trading this:
Wait for confirmation with a bearish candlestick below the EMAs or a break of recent support.
Manage position size based on stop distance and your account risk tolerance.

Breakout or BreakDown? MarkDown End Here's What's next!#Bitcoin moving towards its current downtrend structure forming a falling wedge with a potential of 50% recovery from the down fall. KRAKEN:BTCUSD
We can notice below 75K as a spring of the cycle and market declinations, however my insight is only for partial recovery due to ease of economic tensions between the tariff rates and bear market cycles - a cooling moment offers buying sentiment!
At the moment I consider the market accumulating for potential rally moves increasing #demand from over sold of the market.
Keep an eye on the 92K where I believe reactions of most sentiment will comes over this price.
Probability high, but always protect your margin from sudden changes.
This is idea and not financial advice
Join our society of FXDC

