BEARUSD trade ideas

BTC 12Y trend line that indicates next bear market bottom.Back in december i was posting this idea, indicating bitcoin TOP
There is 12y RSI trend line on 2W time frame. After each RSI touch of this yellow line approx. in 400-680 days new bear market bottom formed.
Next bottom should be around Q1 2026 jan-feb-march.

BTCUSD Liquidity SweepAll my trade entry are based on volume and liquidity and that’s what the market respect.
I’m currently long on BTCUSD

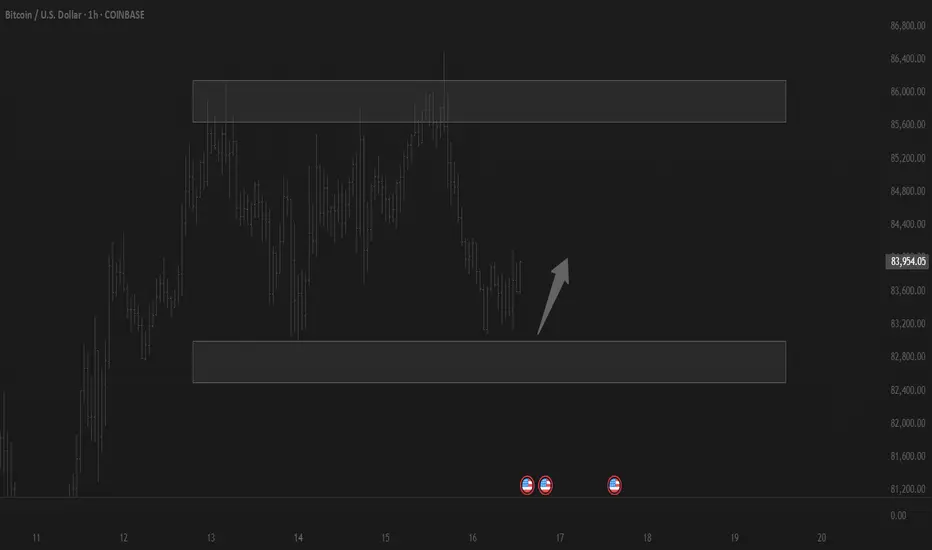
Trading balanceTrading balance The price of the asset has rebounded from the balance zone. With the prospect of growth into the resistance zone.
Bitcoin to $70K? My LSTM Model Thinks So📈 Bitcoin to $70K? My LSTM Model Thinks So 🚀
I've been working on an LSTM (Long Short-Term Memory) neural network designed to forecast Bitcoin prices, and the results are exciting. My model analyzes historical BTC data and learns temporal patterns to predict future movements. After extensive training and optimization, it reached an accuracy of around 96% on the training set.
🔍 How it works:
LSTM networks are especially powerful for time-series forecasting because they can capture long-term dependencies and trends in data. I trained my model using historical daily BTC prices, letting it learn the complex patterns and volatility that define crypto markets. The model takes sequences of past prices and uses that context to project the price movements of the next 30 days.
📊 The Forecast:
Based on the model's output, my current prediction is that Bitcoin will reach $70,000 within the next 30 days. This projection isn’t just a guess – it’s backed by a deep-learning model built to handle the chaotic nature of crypto.
⚠️ Note:
While the training accuracy is high, real-world conditions can differ, and models should always be taken as tools—not certainties. I’m sharing this analysis to contribute to the community and spark discussion.
Would love to hear your thoughts or see if others are seeing similar trends! 👇
#Bitcoin #BTC #CryptoAnalysis #MachineLearning #LSTM #BitcoinForecast #CryptoTrading

BTCUSD next move(expecting a bearish move)(16-04-2025)Go through the analysis carefully, and do trade accordingly.
Anup 'BIAS for BTCUSD (16-04-2025) (MID TERM)
Current price- 83,800
wait for the break-out
"if Price stay below 85,800 then next target is 81800, 79,800 and 76000 above that 88,000.
-POSSIBILITY-1
Wait (as geopolitical situation are worsening )
-POSSIBILITY-2
Wait (as geopolitical situation are worsening)
Best of luck
Never risk 2% of principal to follow any position.
Support us by liking and sharing the post.

BitcoinBTCUSD
- Falling Wedge as an Corrective Pattern in Long Time Frame
- Break of Structure
- S / R Level
- Completed " 12345 " Impulsive Waves
- Order Block

Bitcoin Facing Rejection Around the $86K Marker.
Based on Daily TF chart key level to watch is $84.5K.
The Case of bulls and bears:
If bulls fail to reclaim and hold above this 84.5K level, we could see a potential drop toward the FWB:67K – GETTEX:59K zone. Re-capturing 84.5k level pump target 88k to 99k level.
What’s especially worth watching now is the MACD:
Will it cross above the zero line, hinting at renewed bullish momentum,
or will it roll below and confirm a stronger downtrend continuation?
No predictions here — just sticking to the trend and watching price action unfold.

Supply and Demand by Thapelo Consolidation and Expansion
The markets either do one of two things: Price either consolidates or expands.
Consolidation: a period in the market where price is moving calm which moves in a range known as the dealing range. We will be able to identify a clear high and low to this range.
You have probably heard of the term range bound, ranging, or consolidating. This means that price is typically staying in one area, and just moving sideways, rather than up or down.
The range can be tight (meaning a spread of only a few pounds), or the range can be loose (meaning a spread of hundreds of thousands of pounds from range high to low. This partly will come down to the timeframe implemented.
Expansion: a period in the market where price is moving aggressively in one direction or the other. We will see an impulsive move to the upside, or an impulsive move to the downside, where price will give us large candle bodies or wicks. This is known as expansion.

Bitcoin is very unlikely that it will move like this! (5%)It is more likely that if it can break the channel ceiling from here, it will move to higher numbers, but if not, this can also happen!
BITCOIN Sell everything in October!Yep, kind of a clickbait title but it doesn't fail to serve justice to this very important Bitcoin (BTCUSD) chart.
Today's analysis displays in the most illustrative way the extremely tight symmetry between BTC's Cycles and how this can help us time our Sell at the Top of the Cycle and equally have the patience to buy as close to the next Bottom as possible.
As you see, in the past +10 years since the 2014 Bear Cycle, every Cycle has almost identical time ranges/ durations. All three Bear Cycles since then, lasted for approximately 1 year, and both Bull Cycles for almost 3 years (152 weeks, 1064 days to be exact). More specifically, the last two Bear Cycles were exactly 1 year long, the 2018 one started on the week of December 11 2017 and ended on December 10 2018 and the next Bear Cycle started on November 15 2021 and ended on November 07 2022. So it's been December-to-December and November-to-November Bear Cycles respectively.
If this high degree of symmetry continues to hold, counting 1064 days from the last Cycle Bottom o November 07 2022, gives a time estimate for the next Cycle Top on (the week of) October 06 2025. If also that holds for the Bear Cycle, expect an October-to-October duration, with an approximate bottom on October 12 2026.
So Sell everything up to October 2025 and Buy back as we get close to October 2026 is the strategy?
Feel free to let us know in the comments section below!
-------------------------------------------------------------------------------
** Please LIKE 👍, FOLLOW ✅, SHARE 🙌 and COMMENT ✍ if you enjoy this idea! Also share your ideas and charts in the comments section below! This is best way to keep it relevant, support us, keep the content here free and allow the idea to reach as many people as possible. **
-------------------------------------------------------------------------------
💸💸💸💸💸💸
👇 👇 👇 👇 👇 👇

BTC/USD Short Setup – Triple Top Reversal with EMA Confirmation Entry Point (Sell): Around $85,699.52
Stop Loss: $86,741.44 (above resistance zone)
Target (Take Profit): $82,982.09
This provides a Risk-Reward Ratio of approximately 1:2, a commonly acceptable ratio in trading.
📈 Indicators:
EMA 30 (Red) is currently above the EMA 200 (Blue), indicating bullish momentum—but this setup anticipates a trend reversal.
If price breaks below the EMAs, that would confirm bearish strength.
🧠 Conclusion:
This setup is based on:
A strong resistance zone,
Bearish reversal pattern (triple top),
Risk management via stop loss and take profit levels.
If you're trading this:
Wait for confirmation with a bearish candlestick below the EMAs or a break of recent support.
Manage position size based on stop distance and your account risk tolerance.

Breakout or BreakDown? MarkDown End Here's What's next!#Bitcoin moving towards its current downtrend structure forming a falling wedge with a potential of 50% recovery from the down fall. KRAKEN:BTCUSD
We can notice below 75K as a spring of the cycle and market declinations, however my insight is only for partial recovery due to ease of economic tensions between the tariff rates and bear market cycles - a cooling moment offers buying sentiment!
At the moment I consider the market accumulating for potential rally moves increasing #demand from over sold of the market.
Keep an eye on the 92K where I believe reactions of most sentiment will comes over this price.
Probability high, but always protect your margin from sudden changes.
This is idea and not financial advice
Join our society of FXDC


GOLD vs BITCOINThis is a divergence that is playing out right now. It begs the question, is Bitcoin really digital Gold in a Capital Rotation event?

Telescope Lens: The Final Zoom-InLet me say this loud and clear—this isn’t just another bullish idea.
It’s not a maybe. It’s not a prediction. It’s a warning shot before the eruption.
I’ve seen what’s coming.
Not through speculation, not through recycled charts,
but through the kind of calculated pressure that only Smart Money knows how to load behind the scenes.
You’ve seen me call the impossible.
You’ve watched me go quiet right before the storm.
And now—I'm speaking again.
But this time, I’m not the same trader you used to know.
Things have changed.
The way I see the market has evolved.
This isn’t instinct anymore—it’s Telescope Lens precision.
I don’t just look at price—I pierce through it.
I don't follow trends—I dissect them.
I don't trade setups—I expose the blueprint behind them.
Because what’s loading isn’t small. It’s shift-level.
It's bullish not by structure—but by force.
And when it hits, many will call it luck.
But you? You were warned. You were shown.
So, if you’ve ever doubted me—this is the time to shut that voice down.
And if you’ve followed me for long enough, you know what happens when I speak like this:
Something massive is about to break loose.
And no, I won’t spell it out twice.
This is Telescope Lens mode which means were in a dump mode.

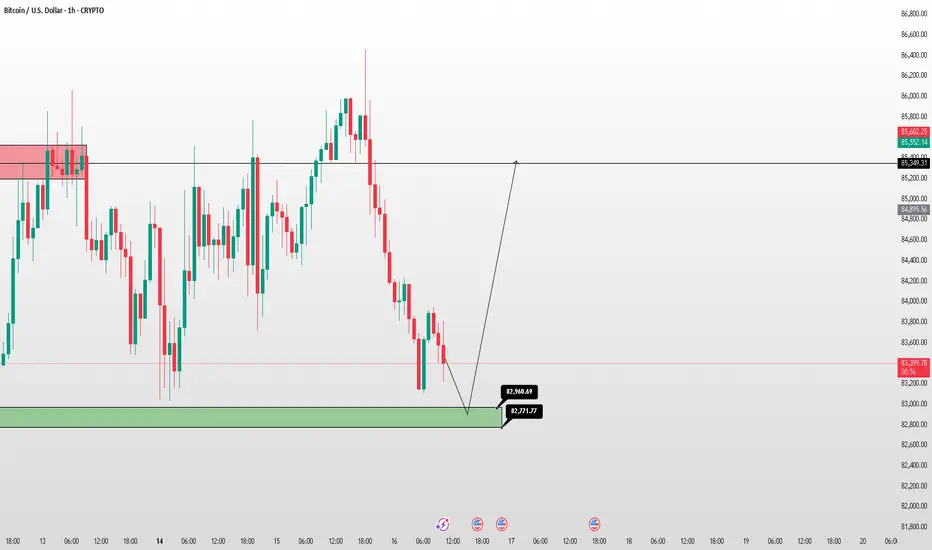
BTC/USD – Buy Setup🚀 BTC/USD – Buy Setup (April 16, 2025)
🔹 Demand Zone: 82,771 – 82,960
🔹 Take Profit: 85,349
⚡ Rules:
Buy if price reaches 82,771–82,960.
Stop Loss: Below 82,700.
Hold until 85,349 (or scale out).
#Bitcoin #Trading #Crypto #FXF #FXFOREVER
btcIf the green lines are broken, we can easily enter the green box. To reach higher points, it is important not to break these two points.

My observations, long term. The purpose of this analysis is less of a predictive nature but rather more of a record of common sense thought and observations.
I don't think anyone really knows beyond a shadow of a doubt what Bitcoin will do next. The best we can do is look back at it's history and try to make sense of it in order to gain common sense ideas about what we can expect. My main mode of operation is trend lines, sometimes dozens of them. And I have here on the weekly chart a long term resistance (July 2016) and support (Jan 2020) marked in blue. And some time ago I drew the red and yellow short term support lines and extended them just to see what would happen.
As you can see in the chart, Bitcoin has broken the yellow line and attempted to cross back above it, and I'm not ruling that option out just yet, however when I look at this on a smaller time frame the price action looks like it's trying to flip the yellow into resistance. This scenario makes sense for a couple of quick reasons, the first being common sense in that the yellow line is extremely steep and one would have to wonder how long BTC can keep pace with it. The second reason is that the RSI is showing a head and shoulders pattern, as I've circled below the candlestick chart. However I think even the red short term trend line eventually will prove to be too steep of a climb to keep pace with as well, and it too will eventually be tested.
On the bullish outlook, BTC came down to retest the previous ATH at around 74K and bounced from it. In doing so, it completed the necessary distance for the double top and theoretically could continue its run up beyond 110K. It also touched the lower boundaries of Bollinger Bands (I'm limited to 2 instruments on the free acct. , so check for yourself) on several mid to long term time frames, increasing the possibility of a bullish continuation from there.
However, I lean more toward the bearish scenario for reasons I stated above. And because it's been a while since BTC touched its long term support (marked in blue) and history does repeat itself. I however do agree that the 40K area would be difficult to reach because of demand expected near the 68K, 53K and 49K zones.
This is not a trade suggestion or advice of any kind, however the best action at this point is to be patient and take a wait and see approach until price action makes a more definitive confirmation of either bullish or bearish trend to come.

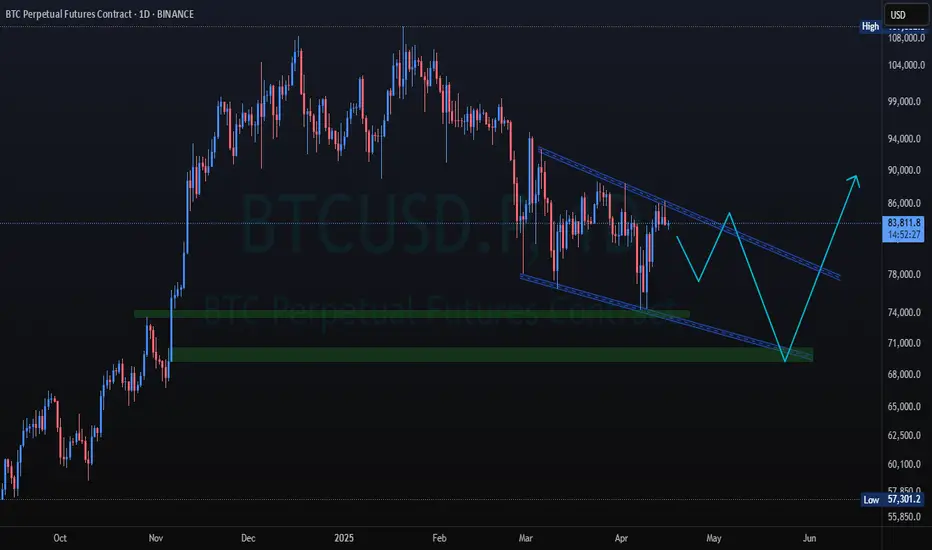
Long trade opportunity is coming Bitcoin price is starting to look interesting for a long trade opportunity.
Currently Bitcoin is in the range bound between 75,000 approx and 89,500 aprox (blue rectangular box in the chart).
EMA 200 is horizontally running through in the middle of the range and EMA 21, 55 and 200 are starting to get bunched up together. I really like this set up because when this happens, it is often followed by a strong directional move. All you need for now is patience, which is the hardest thing to do.
I will open a long position if the following conditions are met:
1) Daily MACD and RSI will move into the bull zone and they are clearly pointing to the upside.
2)The price will move and close above the descending trendline.
3) EMAs are going to start to spread out and line up properly (EMA 21>55>200 for long)
For whatever reasons, if I feel I need to be more cautious, I might wait for the price to move and close above 93,000 (above orange rectangular box area) because it is a high liquidity area and I think a lot of price manipulation might happen.

BTCUSD 30M CHART PATTERNThis chart is a technical analysis for BTC/USD (Bitcoin to US Dollar) on the 30-minute timeframe. Here's a quick breakdown of what it shows:
Chart Pattern: The red lines and orange circles indicate a double bottom pattern, suggesting a potential bullish reversal.
Support Zone: Around $83,136 – marked in green. Price rebounded from this zone.
Resistance/Target Zone: Around $86,310 – marked as "Take Profit" area at the top.
Mid-level Target: There's also a more conservative "Take Profit" at around $84,500 (blue horizontal line).
Stop Loss: Placed slightly below the support zone, around $83,000.
Interpretation:
The chart implies a long (buy) trade setup.
Entry likely happened near the support.
Targeting a price move back up to previous highs.
Stop loss protects against further downside.
Want help calculating risk/reward or planning a similar trade?

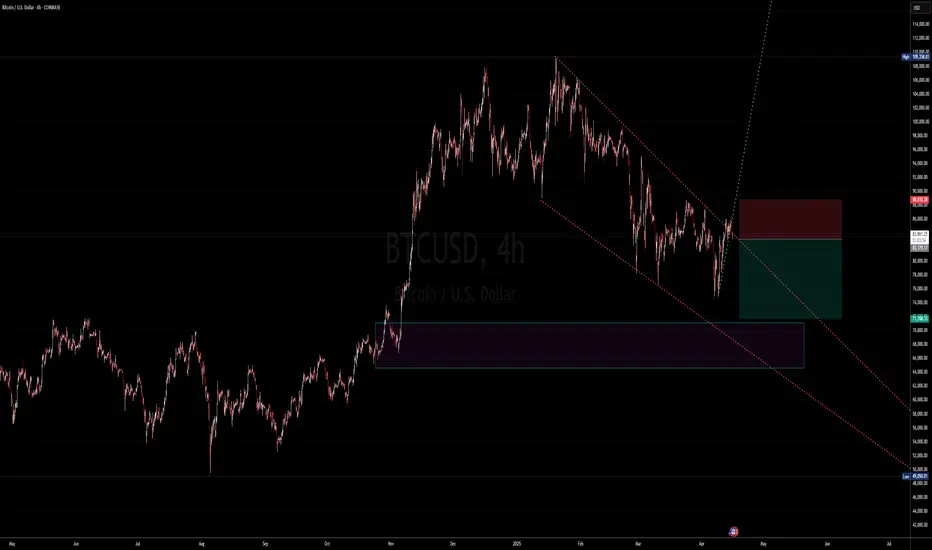
BTCUSD Chart - Potential Short OpportunityThe provided description outlines a technical analysis perspective on the BTCUSD (Bitcoin against the US Dollar) chart, suggesting a potential short selling opportunity based on the interaction with multiple long-term downward trendlines and a recent break of a short-term trendline.
The chart shows the BTCUSD touched multiple long-term downwards trendlines, also the short term trendline has broken for potential short opportunity. it may falls further 71-66K to support of previous highs, and to where the previous trend has begin.
A&B Scenario $117K - $130k📊 Fibonacci Levels:
100% Fib extension (~$74,146): Currently acting as a key resistance — price is reacting to it.
127.20% ($93,137) and 141.4% ($103,051): Next major resistance zones — likely targets if the uptrend continues.
161.8% ($117,259): A very bullish projection, and possibly the top of Wave (5).
These are classic take-profit levels for longer-term bulls.
🔁 Elliott Wave Count (Speculative):
The chart seems to be suggesting a Wave (3) top around current or slightly higher levels.
A Wave (4) correction is expected to drop toward the midline of the ascending channel (possibly FWB:65K –$68K area).
Followed by a final Wave (5) rally — possibly targeting $103K to $117K.
This is a bullish long-term outlook with one more correction before the final blow-off top.
📐 Trend Channel:
The price is trading within a long-term ascending channel, respecting both support and resistance very well.
Wave (5) projection is pointing to the upper boundary of the channel — potentially aligning with the 161.8% Fib at $117K.
📉 Support Zones:
FWB:65K to $68K: Strong area of potential support (between 86%–100% Fib and mid-channel).
$47K: 61.8% Fib — solid structural support if there's a deeper correction.
🔺 Bearish Warning:
The red arrow near the top suggests a potential rejection around the $93K–$103K area.
Could lead to a false breakout or a sharp Wave (4) correction.
🧠 Summary – End of 2025 BTC Outlook Based on This Chart:
Scenario A (Bullish):
📈 Target: $103K – $117K
Timing: End of 2025 (Wave (5) peak)
Conditions: BTC holds FWB:65K –$68K on corrections, follows Elliott Wave path.
Scenario B (Bearish Rejection):
🔻 Pullback to FWB:65K or even $47K
Potential double top or failed breakout
