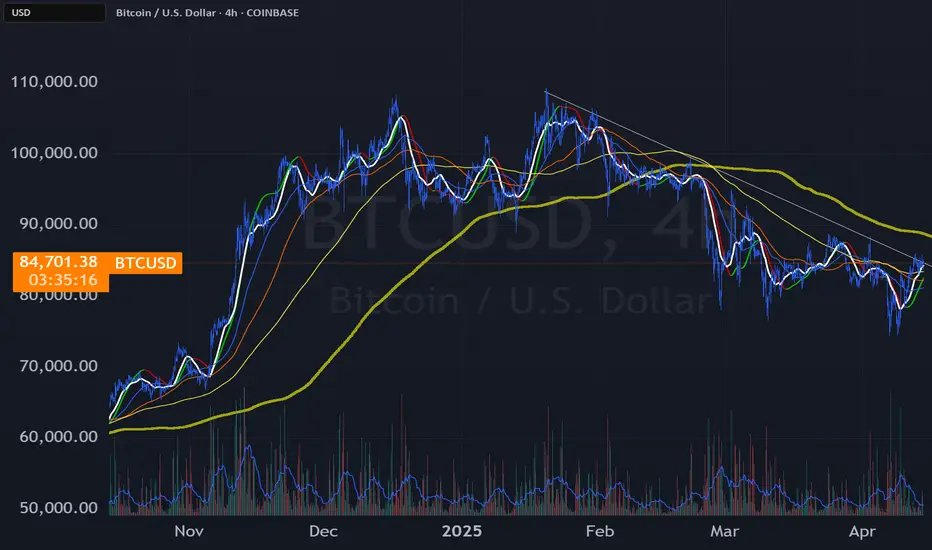
Bitcoin Getting Ready to Continue up to Test $87k again.Well...well....well, looks like bears still playing lazy.
Anyways TIME is running out for bears to make their case so knowing that bearsstill have like
8 to 11 1hr candles to make their case so we came out with 3 scenarios and are as follow.
(1)- it breaks out from where it is right now or
(2)- It makes another narrow sideways move and then breakout or
(3)- Drops quick in a couple of candles with nasty wicks just to bounce back up quick.
I'm inclined for the #3 option cause there's still TIME to happen but all depends on volatility, the bright side of this dilemma is that all of them will end up above the $85k line during the week, once it gets there will take another look. Place your bets ladies and gentlemen and buckle up, and get ready for a wild ride.
BEARUSD trade ideas

BTCUSD update Hi traders you need to plan a trade n trade the plan,this is my plan n I post it 1 January now am in a recovery mode and still following the trend as I said this year I won't share many analytics but I do have specific platforms were I do share what am seeing n help those who see my post,soo we are gonna explode soon in btc its just a matter of time keep your head up n trust the process get rich or die trying never give up📈

BTCUSD Today's strategyYesterday, the price of Bitcoin increased, but the trading volume decreased, weakening the short-term upward momentum. However, in the long run, the market has sufficient liquidity. The active trading of a large number of investors supports price discovery, and it is likely to drive up the price when there are favorable factors.
It should be noted that the cryptocurrency market is highly volatile and uncertain. Although we are bullish on the price of Bitcoin today, unexpected factors may change its trend. When making investment decisions, investors should assess their risk tolerance and operate with caution.
BTCUSD
buy@83500-84500
tp:85500-86500
I hope this strategy will be helpful to you.
When you find yourself in a difficult situation and at a loss in trading, don't face it alone. Please get in touch with me. I'm always ready to fight side by side with you, avoid risks, and embark on a new journey towards stable profits.

My short term humble forecastThe yellow line is my forecast with the estimation short term local highs and local lows, along with the reversal. The vertical lines are the estimation dates it will occurs.

BTCUSD is Going to Fall ? 79K Again...BTCUSD | Liquidity Grab Before Major Drop? (1H Chart Analysis)
Idea :
Timeframe: 1H
Bitcoin is showing signs of a potential liquidity grab around the major resistance zone near 85.5k–86k. The price tapped into the imbalance zone, likely triggering buy stops and drawing in late longs.
Here’s what I’m watching:
Liquidity sweep just above recent highs
Multiple internal liquidity zones below acting as potential magnet
Potential fake breakout, followed by sharp rejection
Final target could be the external liquidity around 74k–76k
Trade Setup:
Short entry after liquidity is swept above 85.5k with confirmation
Stop-loss: above 86.5k
Targets: 82k, 80k, and 74k (external liquidity)
Bias: Bearish (Short-Term Play)
---
Disclaimer:
This analysis is for educational purposes only and does not constitute financial advice. Please do your own research and risk management before taking any trades. Trade responsibly.
---
#BTCUSD #Bitcoin #CryptoTrading #SmartMoney #LiquidityGrab #PriceAction #TechnicalAnalysis #SupplyAndDemand #TradingStrategy #MarketStructure#ShortSetup #BearishBias #LiquiditySweep #TraderMindset #TradingViewIdeas #DYOR

$BTCUSD analysis and price targets and a look into my reasoningBITSTAMP:BTCUSD HEY YALL *DISCLAIMER NOT FINANCIAL ADVICE
A little view into my technical analysis and why imo the floor is in for CRYPTOCAP:BTC

rob btc 786 flag breakoutMy take on targets for a 786 retacement, tased on my limited knowledge. Take profit zones marked

BITCOIN FALLING RESISTANCE|SHORT|
✅BITCOIN is trading in a downtrend
Along the falling resistance line
Which makes me bearish biased
And the coin is about to retest the resistance
Thus, a pullback and a move down are expected
With the target of retesting the level below at 83,213$
SHORT🔥
✅Like and subscribe to never miss a new idea!✅
Disclosure: I am part of Trade Nation's Influencer program and receive a monthly fee for using their TradingView charts in my analysis.

BTCUSD 4hr breakout or breakdown !? 4.14.25just pointing out that this could be a critical marker for continued chop or up to next higher high, or more than likely continuing a downward slide along the drawn trendline.
BITCOIN (BTCUSD): More Growth is Coming
Bitcoin is positioned very bullish after a confirmed breakout
of a minor daily horizontal resistance.
We see a positive reaction after its retest.
I think that the price may reach 87450 level soon.
❤️Please, support my work with like, thank you!❤️

Triangle Breakdown & Entry After Rejection🔍 Trade Idea – Entry Plan:
Breakout Below the Triangle Support Line:
Wait for a strong bearish candle to break below the lower trendline of the triangle (support).
Ideally, the candle should close below the trendline with increased volume to confirm the breakout.
Pullback & Rejection:
After the breakout, expect a pullback to retest the broken support line (now acting as resistance).
Look for rejection signals at this level (e.g., bearish engulfing candle, pin bar, etc.) to confirm that the price is respecting the new resistance.
Entry:
Enter a short position after confirmation of the rejection.
Stop Loss: Just above the rejection wick or the retested resistance zone.
Take Profit: Based on previous support levels or measured move (height of the triangle projected downward).


Bitcoin bulls still face medium term diagonal resistance BITSTAMP:BTCUSD has recovered in recent days but still faces a hurdle to the upside as it is pushing up against a descending resistance line, with additional resistance at the $89,000 level.
Using the ForexGPT web app, we can see the following AI-generated analysis using the 4-hour time from on BTC/USD as of April 14th, 2025:
AI-generated analysis for BTC/USD, 4-hour bid prices from January 28, 2025, at UTC 02:52:38
Welcome to ForexGPT! Let's dive into the latest data for BTC/USD on a 4-hour timeframe.
As of the last candle on April 14, 2025:
Price: 84809.2
Open: 84280.4
High: 85038.6
Low: 84157.1
Close: 84809.2
7-period SMA: 84553.9143
14-period SMA: 82656.45
50-period SMA: 81183.452
100-period SMA: 83373.351
Bollinger Bands: Upper: 86400.4939, Middle: 82292.64, Lower: 78184.7861
Donchian Channel: Upper: 85786.4, Middle: 81203.2, Lower: 76620
Sentiment Score: 70.6311
Given the current sentiment score of 70.6311, the market sentiment appears to be quite positive. The price is trading above the 7-period SMA, indicating a short-term bullish trend. The 14-period and 50-period SMAs are also trending upwards, supporting the bullish sentiment. The Bollinger Bands suggest that the price is near the upper band, which could indicate overbought conditions, but also strong upward momentum.
ForexGPT AI-generated Trade Signal
Based on the analysis, I anticipate a long position with the following details:
Entry Price: Market order at 84809.2
Take-Profit Price: 85786.4 (Donchian Upper)
Stop-Loss Level: 83373.351 (100-period SMA)
Risk-Reward Ratio:
Potential Profit: 85786.4 - 84809.2 = 977.2 pips
Potential Loss: 84809.2 - 83373.351 = 1435.849 pips
Risk-Reward Ratio: 977.2 / 1435.849 ≈ 0.68
While the risk-reward ratio is below 1, the strong bullish indicators and positive sentiment may justify the trade. However, always consider your risk tolerance and position sizing carefully.
For further analysis, you might want to explore other timeframes such as 1-hour, daily, or weekly to get a broader perspective on the trend.
Above analysis provided by ForexGPT LLC subject to our terms, and is not investment advice.

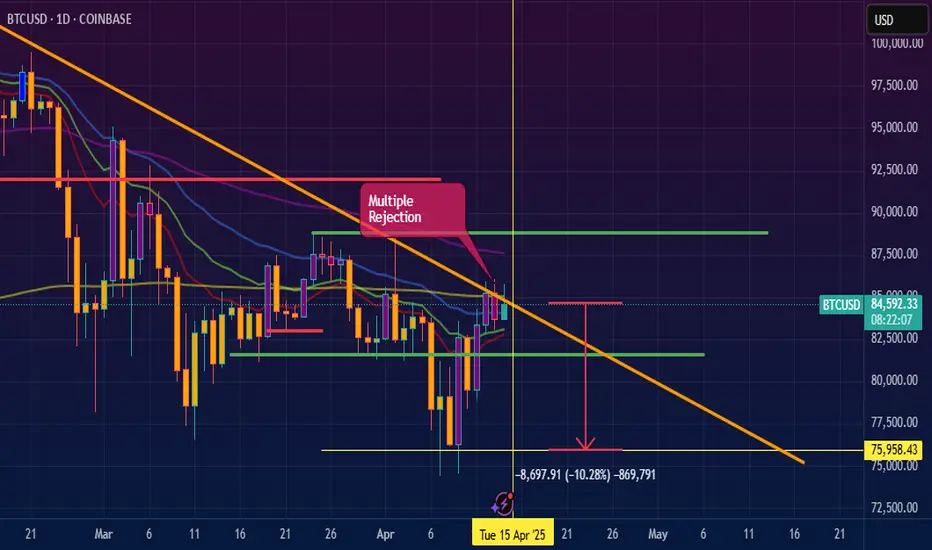
Make-or-break week for BTCUSDImportant week for BTCUSD. Price is sitting right at the edge of a short-term downward trendline within a larger bullish channel. If it breaks above this structure convincingly, it could open the path toward the upper channel extension, with potential upside reaching the 140,000–150,000 region.
On the flip side, if the highlighted support area around 75,000 fails to hold, the structure could break down into a deeper correction, possibly testing the lower channel near 45,000. This week’s close will be key in confirming whether bulls reclaim momentum or risk builds for a larger drop.

Keep a close eye on the downward movement of BTC at all times.Today, BTC is in a sideways trend, with its price fluctuating in the range of 83,000 to 86,000. 📊
At present, there are no significant new developments in the area of tariffs. 👍
However, what we need to be vigilant about is that if the tariff situation deteriorates and triggers the market's safe - haven mechanism, a large amount of capital is highly likely to flow into the relatively stable gold and foreign exchange markets. 😟
This, in turn, could lead to a large - scale sell - off in the Bitcoin market. 💥
Therefore, it is recommended to consider short - selling at relatively high price points. 📉
The accuracy rate of our daily signals has remained above 98% throughout a month 📈! You are warmly welcome to follow us and join in on the success 🌟.
💰💰💰 BTCUSD 💰💰💰
🎯 Sell@84500 - 85500
🎯 TP 82500 - 81500
Traders, if you're fond of this perspective or have your own insights regarding it, feel free to share in the comments. I'm really looking forward to reading your thoughts! 🤗

Bitcoin shows local growth - will it continue ?Marked the important levels in this video for this week and considered a few scenarios of price performance
Local support at 80k and first target at 86k
Write a comment with your coins & hit the like button, and I will make an analysis for you
The author's opinion may differ from yours,
Consider your risks.
Wish you successful trades! MURA

bullish for bitcoinBitcoin is about to buy it's now or never up we go without looking at the back, break and retest.

Price Action: Bitcoin BTC Monday 4/14/2025In this video, we are looking into Bitcoins Price Action on Daily Chart throughout the week as it approaches previous levels of resistance on its move towards 85k -88k mark.

Bitcoin Double Top Signals Caution: Key Support Zones to WatchCRYPTOCAP:BTC previously formed a strong double bottom around the $74,500 level, which led to a bullish rally pushing the price up to a saturation zone near $86,000. However, current price action suggests a double top formation — a classic bearish reversal pattern. This aligns with RSI trendline rejection and signs of bearish divergence, reinforcing the bearish sentiment.
The key question: Is this a correction or the start of a deeper dump?
If BTC holds above $79,000, it may just be a healthy correction.
A breakdown below $79,000 brings the next support near $76,000 into focus.
If that fails, Bitcoin could revisit the $69,000 zone, which aligns with earlier consolidation.
Traders should monitor RSI closely and watch for reaction at the support zones. Opportunities exist for both short-term scalps and long-term positions near key levels.

BITCOIN MAPPING 2025This report provides a comprehensive analysis of Bitcoin (BTC), focusing on recent price movements, trading volume, market sentiment, and key technical indicators. It examines short-term and long-term trends, identifies support and resistance levels, and evaluates potential breakout or correction scenarios. The analysis also considers macroeconomic factors and developments in the broader cryptocurrency market that may impact Bitcoin’s performance.

#BTC is ready to move! Bullish Move Ahead!#BTC Weekly Update:
Bitcoin's weekly chart is looking strong.
IMHO, the risk of not being invested at this stage is higher than the risk of being invested.
Everything is aligning well when we analyze these fractals.
This current bull market has been different from previous cycles, with Bitcoin underperforming compared to earlier runs, but that only makes this moment even more crucial.
The worst seems behind us, and we’re entering a new bullish phase. 🌅
Do you agree?
Please hit the like button if you like it.
Thank you
#PEACE

BTC Still in Downtrend – Watch for Breakdown Below 82.7k📌 Structure & Price Pattern
- Still forming lower highs & lower lows.
- Signs of a potential reversal are appearing, but the overall structure remains bearish.
- Based on Elliott Wave count, it may still be completing a major 5th wave down.
- As long as the upper trendline holds, downside pressure remains.
📈 Technical Indications
- Bearish momentum still dominant despite a Bullish Divergence on the Daily timeframe.
- Weekly timeframe shows price is struggling near resistance areas, although still above EMA.
- On M30, price remains under pressure even if it's hovering near EMA.
⏰ Key Timing
- Peak reversal expected around *April 15* (Monday–Tuesday), potential swing high ➜ correction ➜ sideways ➜ continuation down.
📍 Key Levels
- 🔽 Bearish Confirmation: If price breaks below *82,700*, expect further downside towards:
- 🎯 Target 1: 79,000
- 🎯 Target 2 (final): 76,000
🚀 Focus:
• Reversal expected on April 15
• Break below 82.7k = short-term sell
• Downtrend remains intact unless major structure breaks
BTCUSD Technical Analysis! BUY!
My dear friends,
BTCUSD looks like it will make a good move, and here are the details:
The market is trading on 83747 pivot level.
Bias - Bullish
Technical Indicators: Supper Trend generates a clear long signal while Pivot Point HL is currently determining the overall Bullish trend of the market.
Goal - 84807
About Used Indicators:
Pivot points are a great way to identify areas of support and resistance, but they work best when combined with other kinds of technical analysis
Disclosure: I am part of Trade Nation's Influencer program and receive a monthly fee for using their TradingView charts in my analysis.
———————————
WISH YOU ALL LUCK
