Bitcoin (BTCUSDT) – Technical and Fundamental Analysis 1DBTC has formed a falling wedge pattern on the daily chart, indicating a possible bullish breakout. A clean break above the 0.618 Fibonacci level at $86,485 may trigger an impulsive move to the upside. Price is bouncing from wave (4) and challenging the descending trendline. RSI is recovering, suggesting renewed buying momentum, and MACD shows signs of a bullish reversal.
Fundamental Factors
Bitcoin remains supported by strong institutional demand and optimism around crypto ETFs. Expectations of lower interest rates and macroeconomic uncertainty continue to drive interest in BTC as a hedge. Meanwhile, on-chain data reflects accumulation, with exchange outflows increasing in recent sessions.
Scenarios:
Main scenario – breakout above 0.618 targeting $96,595 and $109,474, with a potential extension toward $125,842.
Alternative scenario – pullback toward $79,384. If this level fails to hold, further correction to $72,283 and $63,497 is possible. The $79K level remains a key support for bulls.
BEARUSD trade ideas

BTC chart you must see! :oLooks like we got something brewing here... I probably don't need to explain what you see, but in my humble opinion, $95K en route... then... probably consolidation. Let's hold our breath as this plays out :-)


Long till 84,256Price has respected the 1hour volume imbalance, warranting bullish momentum to 84,256.

BTCUSD BUY ANALYSIS SMART MONEY CONCEPTBTC/USD is consolidating just above a major supply zone ($82,731 - $83,500), showing strength after a bullish breakout earlier this week.
Key Levels to Watch:
Resistance Zone (Supply): $82,731 - $83,500
Price is currently testing this zone. A clean break and hold above it could trigger a sharp upside continuation.
Immediate Demand Zone: $79,709
This level previously acted as strong resistance and now flipped into support. If price pulls back, I’ll be watching for bullish price action around this zone.
Major Demand Zone: $75,701 - $76,811
If price dives lower, this zone is likely to see heavy accumulation based on past reactions and volume profile support.
Why It Matters:
Price is respecting key supply and demand zones generated by the LuxAlgo Visible Range tool.
Bitcoin has formed a strong impulse leg upwards, followed by a potential bullish flag formation at resistance — a classic sign of continuation.
Multiple rejections from demand zones show strong buying pressure on dips.
Trade Idea:
Bullish Bias: As long as BTC holds above $82,731, I’m expecting continuation towards new highs.
Entry Zones: Watching for long opportunities on bullish confirmations at either $79,709 or $75,701 (marked by green arrows).
Invalidation: Clean break below $75,701 could flip the bias short.
Like this setup?
Smash that boost, drop your thoughts in the comments, and don’t forget to follow for more institutional-grade supply & demand analysis!
#Bitcoin #BTCUSD #CryptoTrading #SupplyAndDemand #LuxAlgo #PriceAction #CryptoAnalysis #TradingView

"BTC/USD Short Setup: Supply Zone Rejection & 5% Drop Target!"BTC/USD 15-Min Chart Analysis
Trade Setup by EA_GOLD_MAN_COPY_TRADE
---
🔼 SUPPLY ZONE (Resistance)
🟣 Price Area: $83,427.80 – $84,313.06
This is where sellers might step in
Price is expected to reverse or slow down here
🔽 ENTRY POINT
🔵 Sell Entry: $83,427.80
Entering short trade just below the supply zone
Aiming to catch a reversal move down
⛔ STOP LOSS
🔴 Stop: $84,313.06
Placed above the supply zone
Limits risk in case of breakout upward
❗ Protects the trade from loss beyond this point
🎯 TARGET / TAKE PROFIT
🟣 Target: $79,071.05
Major support zone / demand area
Potential Drop: -$4,434.27 (-5.31%)
Big reward zone if price dumps from supply
📈 Trendline & Moving Averages
🔵 Blue = Likely 50 EMA
🔴 Red = Likely 200 EMA
Bullish momentum leading into the supply zone
Trendline supports the prior uptrend, now testing reversal
💡 Conclusion
✅ Trade Bias: Bearish (short)
⚖️ Risk-to-Reward: ~1:5 (Great!)
If price reacts at supply, this setup could pay big
But if it breaks up, stop loss keeps you safe

BTCBTC building a picture perfect distribution, which is a bearish pattern.
I will sell all my BTC once it reached the "sell zone".
A huge correction is about to come soon, new buy opportunities will come.
Have a good time! 🤝

BITCOIN BEARS ARE STRONG HERE|SHORT
BITCOIN SIGNAL
Trade Direction: short
Entry Level: 83,826.61
Target Level: 79,330.33
Stop Loss: 86,817.52
RISK PROFILE
Risk level: medium
Suggested risk: 1%
Timeframe: 3h
Disclosure: I am part of Trade Nation's Influencer program and receive a monthly fee for using their TradingView charts in my analysis.
✅LIKE AND COMMENT MY IDEAS✅

BRIEFING Week #15 : Arbitrages on the lookoutHere's your weekly update ! Brought to you each weekend with years of track-record history..
Don't forget to hit the like/follow button if you feel like this post deserves it ;)
That's the best way to support me and help pushing this content to other users.
Kindly,
Phil

BTC - Bottom soon?I recently published this idea privately because I was unable to post it publicly at the time. Now, I’d like to make it public.
(Click the picture above to view the TA-Chart.)
I'll be copying and pasting all the text from the original private idea here, along with the missing links I had prepared on April 2nd.
The purpose of this chart is just to illustrate how my three target levels align with my Fibonacci retracement levels — which is also the reason I selected them.
---------------------------------------------------------------------------------------------------------------------
We are currently in a complex situation. Markets have been experiencing a sell-off due to uncertainty surrounding Trump's tariffs. Additionally, Trump needs to refinance a massive sum of government debt ($7 trillion) over the next 10 years. To achieve this, he must lower the 10-year yield to reduce interest payments.
One way to lower yields is by increasing government efficiency, thereby reducing borrowing needs and bond issuance, which in turn decreases yields. Another method is cutting interest rates, yet his tariff policies counteract this approach. This raises the question: does he want a recession? During a recession investors would flock toward bonds as a safe haven, ultimately pushing yields down.
Bad Signs
- Fed Atlanta GDPNow Gold adjusted at -0.8%
- PMI below 50
- Major uncertainty due to enormous tariffs
-> Michigan Consumer Sentiment (57) and Expectation (52.6) are at levels seen during the recession of 2022
- FED cannot cut interest rates due to persistently high inflation
Are we heading towards a recession?
People tend to overreact and overlook key indicators—one of which is liquidity. Examining the WTREGEN, we see a steep decline since mid-February, indicating that cash has been injected into the system.
This is further supported by the rising RRPONT since mid-February. Additionally, the Fed has been slowing down QT, meaning the liquidity injection is not being offset as much.
Additionally due to the tariffs countries like China could bring a liquidity stimilus into the markets to help their domestic markets.
In summary, liquidity levels should be sufficient for at least a blow-off top. The reason markets have not rallied yet is due to uncertainty stemming from Trump’s tariffs. This is reflected in recession-level Michigan Consumer Sentiment and the Fear & Greed Index.
A key bullish signal would be a falling RRPONT alongside a declining WTREGEN, as this would indicate that cash injections are flowing into risk assets, showing regained confidence. For confidence to return, we need a positive catalyst, such as an stop to QT, an increase of the balance sheet or an interest rate cut. However, the Fed is holding off on cuts due to high inflation and the tariffs.
But this is where it gets interesting:
According to Truflation, inflation has dropped significantly below the Fed’s 2% target since early March. The Bureau of Labor Statistics (BLS) data lags by a full month, so if Truflation’s data holds any truth, the upcoming inflation report on April 10 may reflect this decline. This could restore confidence and provide the Fed with room to give us a positive catalyst.
Where is BTC headed?
Compared to my expectations from early february ( ibb.co ) I expect BTC to first move into the $78K–73K range before rallying toward $115K instead of rallying now at 82k. This range aligns with my Fibonacci levels, and 73K was the high of March 2024. Additionally there is currently a fractality compared to the bottom of 2022 where the bottom now would be rougly at 75k.
To reach $115K, BTC must first break the black downward trendline and the double-top neckline at around $95K. My blow-off top target is $115K, and if BTC holds above $100K, I will eye $145K and $185K as the next targets.
Furthermore there could be a chance that the tariffs are just a negotiation tool since the tariffs do not make any sense % wise.
However if Trump does intend to impose these tariffs at the said % and other countries stab back with their tariffs, then we might actually see a stagflation if the Fed does not intervene-or intervenes too late.

Bitcoin(BTC/USD) Daily Chart Analysis For Week of April 11, 2025Technical Analysis and Outlook:
In this eventful trading week, Bitcoin surpassed our key and completed Outer Coin Dip 78700 and another Outer Coin Dip 74500 target. As a result, we have robust rally development, and current development suggests a continuing rally as it aims to target a Mean Resistance level of 85200 and to retest the completed Interim Coin Rally 88400. There is also potential for additional target expansions. It is essential to note that a downward momentum may arise from the rechallenge of the Interim Coin Rally 88400 and/or the Mean Resistance at 75200.

Bitcoin is starting to rally! Buy!The price is falling towards the pivot which acts as a pullback support that lines up with the 38.2% Fibonacci retracement and could bounce to the 1st resistance.
Pivot: 80,393.27
1st Support: 77,842,40
1st Resistance: 84,559.23


BTCUSD Daily Analysis | April 12, 2025
BTCUSD Daily Analysis | April 12, 2025
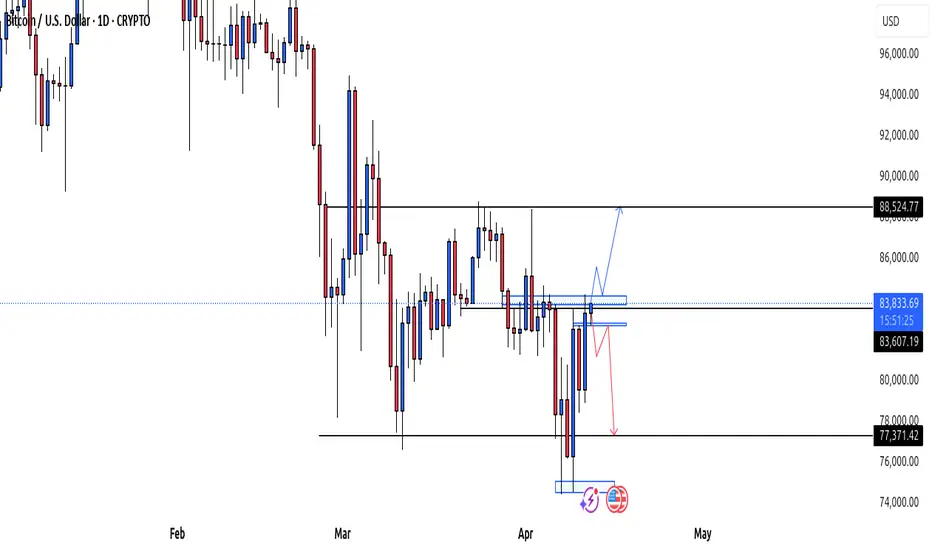
Price is currently consolidating around the $83,700 zone, showing signs of indecision. Two potential scenarios to watch:
🔵 **Bullish Scenario**: If price breaks and retests above the minor resistance (blue box), we could see momentum push toward the $88,500 key level, with extended targets near $92,600.
🔴 **Bearish Scenario**: If price fails to break above the resistance zone and gets rejected, a move back down toward the $77,300 support zone is possible.
🕵️♂️ Patience is key—waiting for confirmation before taking a position.
📅 Watch how price behaves leading up to **April 27th**, a potential key date for volatility.
#BTCUSD #Bitcoin #PriceAction #TradingView #CryptoAnalysis #TechnicalAnalysis #SupportAndResistance #DailyChart #BreakoutOrRejection
Bitcoin is not going back to 100k anytime soon!!Good day traders, back against it with this bitcoin idea I’m currently on back on what price has shown us in recent weeks.
1W- Here price is still very much bearish as we can see that the market is in an expansion meaning any idea of price moving higher is what we all wish for but price does not care so overall here we bearish and need to be ready alert to price always wanting to move higher by taking recent highs.
4H- Now here we can see price shot higher for the liquidity that was resting above the recent broken highs, keeping in mind that our weekly bias is still bearish we than wanna see a shift in structure on the 1 hour TF to give us our first confirmation of many confirmations we use to come at a decision. After price respects our idea than we wanna see price go take the equal lows(Sellside liquidity) below.
Now I wanna make this bold prediction, and it’s my opinion by the way it’s not a fact or anything like that right. In my opinion I don’t think bitcoin will see 100k for the rest of 2025. And my prediction is based on my analysis only!!

BTC SHORT TP:78,800 11-04-2025🚨 Bitcoin's losing steam and it's time to pounce! Short targeting 78-79k is the play.
On those 1H and 2H charts, it's showing weakness, and we're eyeing a close around 78,500 to 79,500.
Jump in on that short now and average down—trust me, it’s looking juicy! This needs to kick off in the next 20 to 30 hours, so keep your eyes peeled!
Smash that follow button to stay in the loop and let’s rake in those greens together! 💸🔥


BTC Is Going to 85k...
Description:
Timeframe: 15m
Pair: BTC/USD
Bias: Short term Bullish (after liquidity sweep & imbalance fill)
---
Analysis:
Price is currently in a distribution phase, targeting sell-side liquidity just below recent consolidation.
We can clearly see:
Liquidity Pool: Multiple equal lows — perfect trap for retail longs.
Imbalance Zone: Price is likely to dip into the imbalance to grab orders.
Expected Move: After the sell-side liquidity is taken and imbalance is filled, a bullish reversal targeting external liquidity at higher levels (~85,000) is expected.
This setup aligns with a typical “Trap the Trapper” scenario — where smart money triggers panic selling, fills long positions, and then aggressively pushes price up.
---
Trade Plan (Example):
Entry: After confirmation near imbalance (~82,500 zone)
Stop Loss: Below 82,200
Take Profit: 84,800 / 85,000 zone
---
Hashtags:
#BTCUSD #Bitcoin #SmartMoney #LiquidityGrab #Imbalance #TrapTheTrapper #PriceAction #Forex #Crypto

BTC SHORT TERM BEARISH
BTC/USD 5M Short Setup
Bias: Bearish (lower highs, clear structure breaks & ChoCh)
Entry: Short from premium supply zone (83,100–83,200), aligned with stacked FVGs and bearish OB
Confluences:
Multiple Fair Value Gaps (FVGs)
Change of Character (ChoCh)
Order block rejection zone
TP: 82,160 (targeting sell-side liquidity)
SL: Above 83,228 supply zone
Risk-Reward: Clean 3R+ setup
Note: Watch 82,960–82,360 for possible reaction (minor support/FVG)

BTCUSDSome kind of fake bottom to be painted here for the bull trap before the grand finale crypto dump. I'm guessing Adam & Eve.
These people are sinister. Don't let them have your whole stack.
