BTC is crossing 87000 crucial levelIf BTC will close above 87000 today, it is high chance to cross 91000 mark.
Note: This is not a buy sell call, trade at your own will, use stop loss.
BEARUSD trade ideas

Bitcoin: slowing downAs markets continue to be highly concerned regarding trade tariffs imposed by the US Administration to the rest of the world, supporting the price of gold, the BTC continues to be somehow left behind the attention of investors. Considering high volatility on other financial markets, and general negative market sentiment, this might actually be good news for BTC.
The price of BTC was moving in a relatively short range during the previous week, between levels of $86K, down to $83,5. However, the majority of deals were around $85K. This is the level currently tested for its potential to the upside. In line with BTC movements, the RSI also remained flat, moving around the level of 52. Moving averages of 50 and 200 days are confirming the cross made two weeks ago, with MA 50 currently diverging from MA 200.
As previously noted, BTC is currently testing the $85K resistance line, for its potential toward the upside. It also should be considered that Friday and Monday are not working days on Western markets due to Easter holiday. In this sense, modest moves could be expected at the start of the week ahead. In case that the $85K is not breached, then the market will modestly revert toward the downside. In this sense, the level of $ 82K could be shortly tested, but the support level currently stands at $80K.

BTC, THE ONLY ONE THAT WORTH LONGING !Introduction
Crypto Didn’t Make It — Just Admit It
Long positions in crypto are usually pointless and super risky, because crypto simply didn’t make it .
Think of it like the dot-com era—when every company with a website was booming… until they all turned to dust .So there won’t be another altseason.
Crypto had its own version of that in 2021 . Unfortunately, it didn’t deliver anything meaningful to the world. Just sh!tcoin after sh!tcoin.
And let’s be clear: I’m talking about everything except Bitcoin .
The rest? Still pointless. Still super risky. At least until blockchain tech becomes much faster , more advanced, and actually gets used in real, profitable projects that benefit stakeholders — not just hype and tokenomics.
Who am I to say that? Just a trader since 2017 and a blockchain developer (not your average “Web3 dev” who just learned how to deploy a token).
BTC looks primed for a long.
Weekly EMA 55 (orange line) is the key — price above it = bullish, below = bearish. Simple as that.
Right now, BTC is holding strong above it and looks ready to move.
(And yeah, crypto doesn’t care about world news — remember that.)
Entry: ~76,500
Stop Loss: 69,217
Targets:
TP1: 87,196
TP2: 93,985
TP3: 101,900
TP4: 115,534

longa probable long although expecting price to reach 90,000 on btc . there has been an impulsive move so far on btc while it is currently ranging. we are expecting a more move to the upside.

Bitcoin - Is Bitcoin on the way up?!Bitcoin is above the EMA50 and EMA200 on the four-hour timeframe and has broken out of its descending channel. The continuation of Bitcoin’s upward trend will depend on maintaining the drawn upward trend line.
A valid break of this trend line will cause Bitcoin’s price to correct to the 80,000 range. It should be noted that there is a possibility of heavy fluctuations and shadows due to the movement of whales in the market and compliance with capital management in the cryptocurrency market will be more important. If the downward trend continues, we can buy within the demand range.
Following the announcement of new trade tariffs by the United States, Bitcoin experienced a 16.7% drop in price. However, it partially recovered from its 26.7% plunge. The total global cryptocurrency market capitalization has now reached $2.74 trillion, marking a 1.71% increase compared to the previous day.
Over the past 24 hours, the total crypto market trading volume hit $60.7 billion, reflecting a 32.28% rise. Within this, DeFi transactions account for $5.25 billion, making up 8.65% of the total 24-hour market volume. Meanwhile, stablecoins have dominated trading activity with $55.84 billion in volume, representing 92% of the total market volume for the day.
When comparing Bitcoin’s performance to other major assets, gold leads with a 12.9% gain. In contrast, both silver and the U.S. Dollar Index saw a 4.8% decline. The S&P 500 fell by 13.8%, while the Nasdaq dropped 17.5%. Despite its volatility, Bitcoin sits between oil and the Nasdaq in performance, showing signs of partial recovery. However, its behavior still diverges from that of traditional safe-haven assets like gold.
On the political front, Hong Joon-pyo, a presidential candidate from South Korea’s conservative party, pledged that if elected, he would implement reforms in blockchain and cryptocurrency regulations. He also promised to integrate blockchain technology into public sector and administrative services. Additionally, Hong plans to invest at least 50 trillion Korean won (approximately $35.1 billion) over the next five years in research and development across artificial intelligence, quantum technology, and room-temperature superconductors. These initiatives are part of his broader strategy focused on growth driven by emerging technologies.
In Q1 2025, publicly traded companies collectively acquired 95,431 bitcoins, bringing their total holdings to 688,000 BTC. This amount represents 3.28% of Bitcoin’s fixed supply of 21 million coins.
The Coinbase Premium Index, which tracks the difference in Bitcoin demand between U.S. markets and global exchanges, has shown reduced volatility since March 2024. It appears to be forming a pattern often seen before bullish market trends.
Robert Kiyosaki, renowned entrepreneur and author of the best-selling book Rich Dad Poor Dad, has forecasted that Bitcoin’s price could rise to between $180,000 and $200,000 by the end of 2025. Kiyosaki has long been an outspoken supporter of Bitcoin, portraying it as a safe hedge against inflation and economic instability.

BITCOIN Most POWERFUL Signal Activated—Former ATH IS NOW SUPPORTBitcoin (BTCUSD) completed two straight green 1W candles and has started off this week equally impressive, approaching 4-week Highs! This is a direct consequence of the 1W MA50 (blue trend-line) holding as a Support, similar to what happened on the last two Higher Lows of the 3-year Channel Up on August 05 2024 and September 11 2023.
The hidden catalyst perhaps behind this strong move may be the fact that the April 07 2025 Low, besides the 1W MA50, it also rebounded on the former All Time High (ATH) Resistance Zone (red), which now turned into Support (green). This is the Zone that started with the November 08 2021 Cycle High and rejected BT on March 11 2024, April 08 2024, June 03 2024 and July 29 2024.
As long as this critical Support cluster (1W MA50, 2021 ATH Zone) holds, we are expecting the 1W MACD to form a new Bullish Cross, the first since October 14 2024, which technically confirmed the new Bullish Leg of the 3-year Channel Up.
In fact all previous 3 Bullish Legs got confirmed by a 1W MACD Bullish Leg and the minimum the rose by was +105.30%. As a result, after the Bullish Cross is confirmed, we will be expecting to see at least $150000 on this current bull run.
But what do you think? Can this hugely important Support cluster lead Bitcoin to $150k? Feel free to let us know in the comments section below!
-------------------------------------------------------------------------------
** Please LIKE 👍, FOLLOW ✅, SHARE 🙌 and COMMENT ✍ if you enjoy this idea! Also share your ideas and charts in the comments section below! This is best way to keep it relevant, support us, keep the content here free and allow the idea to reach as many people as possible. **
-------------------------------------------------------------------------------
💸💸💸💸💸💸
👇 👇 👇 👇 👇 👇

btc wOpen . bullish and not finished . watch and preparethe weekend was finished with a pump through all resistance zones. all SL accumulated, done with.
so now, bullish wOpen. too high to LONG,
a return to wOpen - sweep low - during a nice session timing, that be great.
otherwise, wait for the progress of upside and prepare to find the short entry.

88.5KHappy Easter,
So, our bullish trade is started well. But for now we wouldn't consider too extended targets. Based on AB=CD that we have on 4H chart , next extension is around 93K.
But here is a tricky moment exists and it relates to the H&S shape and strong 87-89K daily resistance. The point is that the right arm is yet to be formed, and it could be started right around 88.5K 1H chart targets.
That's why we're focused on just near standing targets. If Somehow, BTC will jump above 90K, then, the different scenario could appear. But for now we think it would be better to not take more risk and try to extract as much as good result from current positive position.

BTCDISCLAMER !!!
BTC is breakout trendline bearish short-term
Target 1 is in the green box, for the long term you can hold on

Bitcoin $200k in June 2025Despite the fact that US stocks look bleak, there is no better time for growth than the spring-summer of 2025. By the end of the year, the statistics will start to come out quite sad, and if you do All Time High, then only now. I am waiting for positive news
I estimate the probability of such a scenario at 65%

bitcoin short sellSignificant key levels reactions
#trends
#analysis
#forex
use proper risk management

BTC go long only after approx 90800 resitance breaks and retraceBTC go long only after approx 90800 resitance breaks and retrace. 3 resistance is standing to welcome Bulls.

BTC Followed Our Plan As UsualBTC as usual followed our plan so perfectly. In MINDS also i reminded everyone about this move. Now can book nice profits here and stay tuned for our next Update

Bitcoin RSI Cooldown Before $88K? Key Support Levels to WatchBitcoin is showing strength towards the $88,000 mark, but the RSI on the 1-hour and 4-hour timeframes is significantly overbought, signaling the need for a healthy retracement.
I’m expecting CRYPTOCAP:BTC pullback to the RSI 50 midline, which could align with a price retrace to around $85,000–$83,000. If BTC loses the $85K level, FWB:83K comes next. A deeper retest could bring it back to $80K, which may serve as a high-conviction long zone.
Trading Plan:
Short scalp while RSI is overheated.
Long entries: $85,600 zone if structure holds.
Keep your eyes on volume and RSI reaction near key levels.

Consolidation Divergence - Range Trading StrategyLast week, BTC continued to oscillate in the 83K-86K range. Technically, the daily MACD showed increasing volume but a deviation from the price. At the same time, the Bollinger Bands narrowed sideways, and the market entered a typical "pre-breakout momentum" stage.
Before an effective breakthrough, you can rely on the range to sell high and buy low, strictly set stops, and pay close attention to changes in volume and energy and confirmation of the breakthrough direction.
BTCUSD
sell@86500-85500
tp:84500-83500
buy@83000-84000
tp:85000-86000
I hope this strategy will be helpful to you.
When you find yourself in a difficult situation and at a loss in trading, don't face it alone. Please get in touch with me. I'm always ready to fight side by side with you, avoid risks, and embark on a new journey towards stable profits.

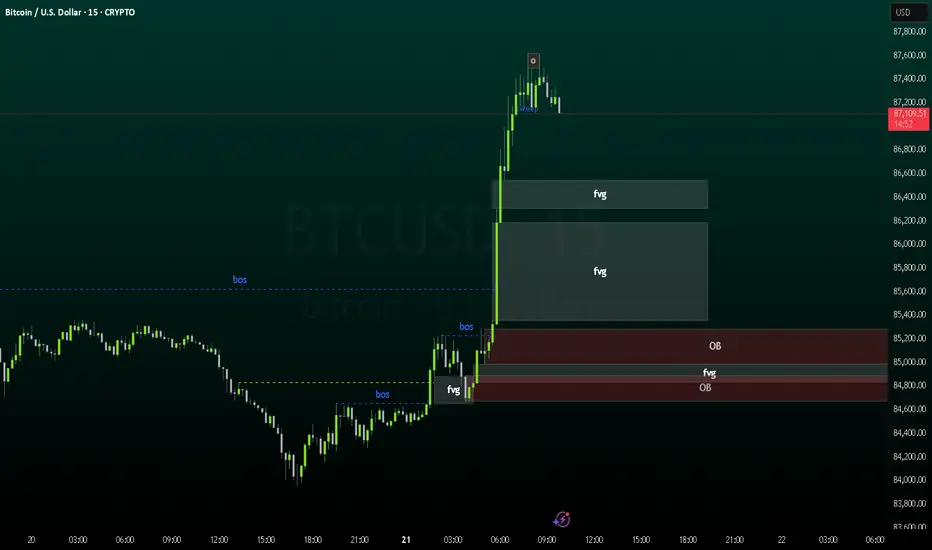
BTC USD buytradeBTC has broken structure to the upside, so I'm looking for a long trade in 15 minutes after the price reaches the FVG.
This 3 Step System Has Caught The Bullrun In BitcoinThe rocket booster strategy is a classic
indicator which we have been using for a long
time.
Right now the strategy is trending in BItcoin.
This is your chance to see the strategy.
This strategy has 3 steps:
1-The price has to be above the 50 EMA
2-The price has to be above the 200 EMA
3-The price has to Gap up
--
Last week we caught the bull run in
gold and the crash of the dollar
This week we have caught the bull run
In Bitcoin CRYPTO:BTCUSD
Watch this video to learn more
Also rocket boost this content
to learn more
--
Disclaimer:Trading is risky.
please learn risk management and
profit taking strategies.Also feel free to
use a simulation trading account
before trading with real money.

$BTC: Trapped Between Two Major Levels🔸
BTC is consolidating between $77K (support) and $90K (resistance), forming a tight 10% range with compression indicating a major move brewing. Current price near $87,500 shows strength but lacks breakout confirmation.
🔸 Key Support Zone at 77,000 (Green Line):
This level previously acted as a breakout base. Multiple successful retests confirm its strength. As long as BTC stays above this level, the bullish structure remains intact.
🔸 Upside Target: 95,000 – 100,000+
A breakout above the GETTEX:89K –$90K zone (orange resistance) will unlock a continuation trend, targeting new all-time highs.
🔸 Risk Level at 74,000 (Red Line):
If BTC breaks below $77K, the structure flips bearish. Failure here opens downside toward $66K and possibly the $50K–$55K range.
🔸 Action Plan:
Break & Hold Above 90K: Close short, ride spot
Retest 77K: Reload spot buys
Break Below 77K: Exit spot, ride short further
Macro Catalysts to Watch:
✅ Fed Rate Cuts
✅ China–US Deal
✅ Powell removal rumors
✅ M2 liquidity surge
✅ Trump policy changes
✅ Elevated VIX & fear

Bitcoin (BTC/USD) Weekly Analysis - W3 April | Master The MarketBitcoin continues to dominate the cryptocurrency market, and its price action provides valuable insights for traders. Here's a detailed breakdown of Bitcoin's performance in Week 3 of April:
Monthly Chart: Long-Term Uptrend
The monthly chart shows that Bitcoin remains in a long-term uptrend. However, last month saw some consolidation, with prices pulling back slightly. This indicates a healthy correction after a prolonged upward movement. Traders should focus on key support and resistance levels to identify potential breakout or reversal zones.
Weekly & Daily Charts: Consolidation Below the Cloud
On the weekly chart, Bitcoin’s price is currently trading below the Kumo cloud but above critical support levels. The daily chart highlights a defined trading range between $74,000 and $93,000 . A breakout above the cloud could signal renewed bullish momentum, while a retest of the $74,000 support level may indicate further consolidation.
Key Levels to Watch
Support: $74,000
Resistance: 93,000Tradersshouldmonitortheselevelsclosely.Asustainedmoveabove93,000 could open the door for higher targets, while a break below $74,000 might lead to deeper corrections.
Trading Strategy
Buy Opportunity: Wait for a pullback to the cloud support or a retest of $74,000 before entering long positions.
Risk Management: Place stop-loss orders below key support levels to protect against downside risks.
Bitcoin remains highly volatile, so patience and discipline are crucial. Keep an eye on macroeconomic factors like interest rate decisions and geopolitical events, as they can significantly impact BTC/USD price movements.

Bitcoin short Elliott waves counts update Nothing much to say over here as I've already given analysis previously for Bitcoin. Just wave counts update.

BTC/USD Long Setup – Bullish RSI DivergenceWe’re currently looking at a textbook bullish divergence on BTC/USD. While price printed a lower low, the RSI formed a higher low on the 4H chart, signaling a potential reversal in momentum. This divergence often precedes a trend change or at least a relief rally.

BTC -- BearishBTC bearish believe it should drift down to around 67k ish according to price action, and pattern

Happening NOW, breakout on Daily, 4hour and 60min timeframesUsing simple trend lines, a buy signal has happened on the Daily, 4-hour and 1-hour charts.
I'm using the candle bodies for my trend lines.
