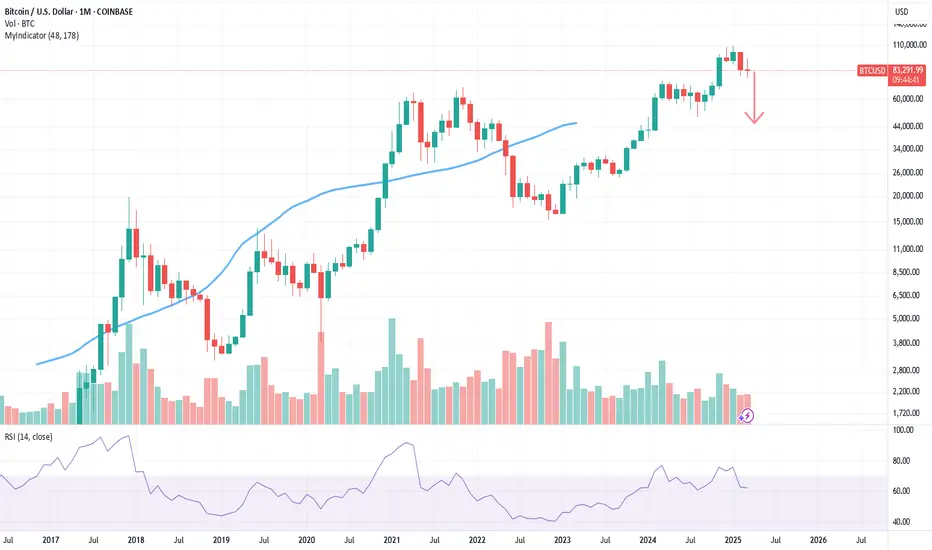
BTCUSDCome Tap into the mind of SnipeGoat, as he gives you a wonderful outlook on current Price Action, based on Higher Timeframes to determine the direction, & Market Trend of BIG Money Institutional Trading.
_SnipeGoat_
_TheeCandleReadingGURU_
#PriceAction #MarketStructure #TechnicalAnalysis #Bearish #Bullish #Bitcoin #Crypto #BTCUSD #Forex #NakedChartReader #ZEROindicators #PreciseLevels #ProperTiming #PerfectDirection #ScalpingTrader #IntradayTrader #DayTrader #SwingTrader #PositionalTrader #HighLevelTrader #MambaMentality #GodMode #UltraInstinct #TheeBibleStrategy
BEARUSD trade ideas


BTC SPX Ratio At Its LimitsAs BTC has matured, it has revealed its limits relative to SPX. Any time the price rises above 15, a correction follows.
While it has not yet cracked I find myself violating my own rules again and compelled to share this chart with you BEFORE the crack.
Markets are volatile and I am simply trying to keep people from getting hurt. Do not make the mistake of thinking BTC is a safe asset.
Bulls best to take profits.
Click boost, follow, subscribe, and let me help you navigate these crazy markets.

Double bottom forms, but trend remains bearish?Despite pressure stemming from President Donald Trump’s recent tariffs, analysts at Bernstein note Bitcoin’s relative resilience, particularly on shorter-term time frames where a double bottom pattern suggests underlying bullish interest. Bitcoin’s ‘safe haven’ appeal may be resonating with investors more than previously.
However, the longer-term chart reveals price action still maintained within a multi-month downtrend. After briefly rising above $80,000 on April 9 (peaking at $83,000), the price has since pulled back, confirming last week’s losses and raising the risk of further downside.

BITCOIN weekly and 50 SMA - has VERY good newsAs you can easily See, despite all the unsettled News and events in recent days, the current Week candle has returned to GREEN having hit that 50 SMA.
To remind you, we began the week with a RED candle BELOW that 50 SMA.
This is Very important for sentiment. We bounced off that 50 back in 2024 and went to ATH.
To remind you, we have hit the 50 at the same time as the weekly MACD has entered a Bounce Zone, very near Neutral.
The MACD chart above shows you that the Histogram bar has also returned to White, showing a possible turn of favour from Bearish to Bullish.
BITCOIN IS SO READY TO GO
We just need the investors that are pouring money into the Snail called GOLD, to realise the Future is BITCOIN
We wait

$BTCUSDCurrently trading at $79,700 after a rebounce from demand/support zone of $78,333.
On the basis of smart money concept, it was predicted from an A+ set up, 30m T.F to hit $90,000 before a probablistic retracement to FVG before a ful force continuation.

BTC : What I’m Watching Now AND What I'm Worried AboutWhat I’m Watching Now:
I’m eyeing a potential buy from the 1H Order Block below.
It lines up clean, and the move makes sense…
But Here’s What I’m Worried About:
There’s a double bottom resting at the weekly FVG.
Which means: liquidity.
If price wants that liquidity first,
it might run deeper —
breaking the OB before the bounce.
Stay sharp.
And like always — wait for confirmation.
Patience > Prediction

I envision a huge red monthly candle in April down to 45kI envision a huge red monthly candle in April dropping to 45k, just like the one in November 2018. I'm curious to see how it plays out.
BITCOINBearish BTC: Speculators are heavily shorting Bitcoin (bearish COT), the market structure shows lower lows and lower highs, and intraday momentum is bearish, indicating continued downside pressure.

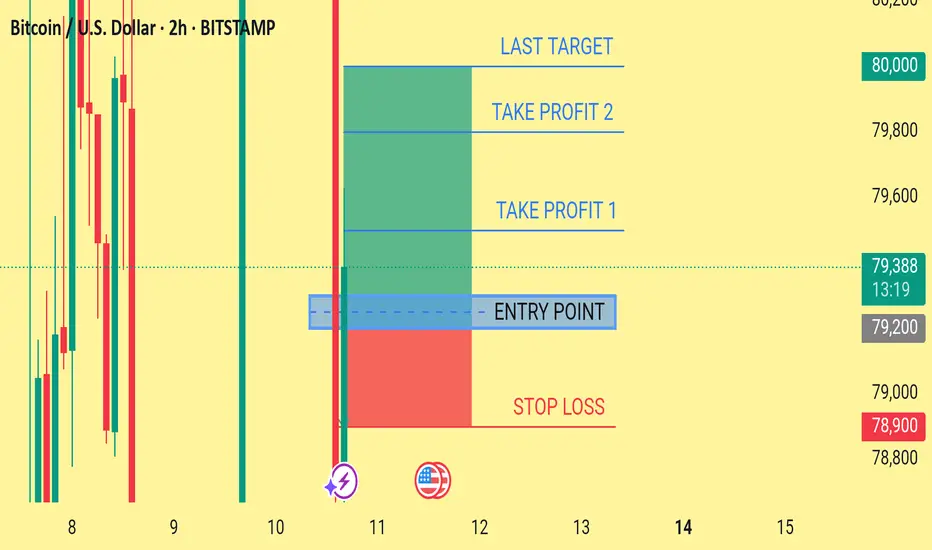
CHECK BTCUSD ANALYSIS SIGNAL UPDATE > GO AND READ THE CAPTAINEntry Price: Around 79,200 USD
Stop Loss: 78,900 USD
Take Profit 1: 79,500 USD
Take Profit 2: 79,750 USD
Last Target: 80,000 USD
TECHNIAL ANALYSIS SATUP ✅
FALLOW RISK MANAGEMENT ✅
BITCOIN 2025 - THE LAST HOPECRYPTOCAP:BTC currently finds itself at the intersection of geopolitical tensions and broader macroeconomic uncertainty. Although traditionally viewed as a hedge against systemic risk, it is presently exhibiting characteristics more aligned with high-risk assets. The FED's forthcoming policy decisions will likely play a pivotal role in determining whether Bitcoin stabilizes or experiences further downward pressure.
The chart represents the most optimistic scenario for Bitcoin to date

BTCUSD: We haven't seen the real Bull yet.Bitcoin is under heavy volatility and yesterday's gains from the moment of the tariff pause announcement are almost all wiped out, which is reflected on its 1D technical outlook which turned bearish (RSI = 42.714, MACD = -1766.300, ADX = 26.356). Nonetheless, it is still holding its 1W MA50, the key support of this Bull Cycle, which might have not shown its strongest rally yet.
And the reason is a pure look at the 2015-2017 Bull Cycle, which is on a similar Channel Up and 3W RSI pattern. 11 weeks between the Channel's last two corrections, same level with the RSI bottoms. This indicates that this April could be similar to April 2017 that started the strongest rally of the Cycle.
## If you like our free content follow our profile to get more daily ideas. ##
## Comments and likes are greatly appreciated. ##

This looks probable for a low being in now. During the run up and repeatedly around 100K I spoke of the different risk setups in the bear move.
I think there's a good chance these are passed for now. Contingent on sensible stops under the low, I think this is probably a good spot to get back in for a passive trade.
Targeting retest of highs.
Will update if plans change, otherwise- simple stuff from here.

Bitcoin AnalysisBitcoin Analysis
Bitcoin is currently approaching the key psychological zone between $70,000 to $75,000, where we expect a potential consolidation or short-term correction.
This area could serve as a resting phase before the market gathers momentum for a new and powerful bullish leg, targeting the $120,000–$130,000 range in the mid to long term.
Traders should watch for signs of accumulation and breakout confirmation before positioning for the next major move.

* BTC Elliot Waves Update: 2 scenarios *Hello again degenerates,
I promise you i am trying to make shorter videos hehe, but in this video I had to explain 2 scenarios that I can see happening, I give you some insight on what to be careful on both scenarios, and I go back to our SPY chart to do a quick review of how it support our scenarios.
Let me know what you think!

BTC USD Elliott Wave AnalysisHello friends
Especially those who are new members (welcome)
In the digital currency Bitcoin, after a sharp rise and the formation of a range zone, we saw a drop in the price of Bitcoin.
Today we want to check whether this drop continues or not?
If the answer is yes! How far?
We see a corrective pattern on the daily timeframe.
This pattern is flat with a long wave C.
The structure of this pattern is 3-3-5.
Wave C is 5 waves. Now we are in wave 5 and we are waiting for a slight increase in the price to the $ 86,500 area and then the price will drop to the $ 73,500 area.
This area is a static support and we expect a reaction at this price.
Good luck and be profitable.

Trading balanceTrading balance The price of the asset has rebounded from the balance zone. With the prospect of growth into the resistance zone.
TARIFF WAR & BITCOIN; FUNDAMENTAL IMPACTThe tariff war between countries, especially major ones like the U.S. and China can indirectly affect Bitcoin (BTC/USD), but in a very different way compared to gold.
Like gold, Bitcoin is sometimes treated as a hedge against uncertainty, especially by retail and some institutional investors.
Trade wars create global tension and fear of economic slowdowns, which could drive increased demand for decentralized assets like BTC.
So, tariff wars can be bullish for BTC, especially if investors look for non-sovereign assets not tied to any single country’s policy.
If tariffs hurt a country’s economy, its currency might weaken (e.g., yuan or euro falling).
People in those countries may convert their local currencies into BTC to escape devaluation or capital controls.
We've seen this in countries like Argentina, Venezuela, and even China (to an extent), where BTC becomes a store of value.
Tariffs often raise the price of imported goods = higher inflation.
If fiat currencies lose purchasing power, people may shift to scarce assets like Bitcoin, which has a fixed supply.
This is similar to gold’s appeal during inflation.
However, unlike gold, Bitcoin is still considered a risk-on asset by much of the market.
During global panic or liquidity crunches (like early COVID), BTC can crash short-term, as people sell it to raise cash.
But in the medium to long term, uncertainty and inflation risk usually help BTC recover and rise.
If the tariff war expands and triggers more inflation, currency instability, or global economic worry, Bitcoin could rise in value.
It won’t be a smooth ride (expect volatility), but BTC tends to benefit from the loss of trust in governments, fiat systems, and centralized economies—which trade wars can intensify.

DOUBLE SCENARIO ARE POSSIBLE ON BITCOINDouble scenarios are possible on bitcoin.If price eventually break above the trend-line, bull run will automatically be activated on BTC,
But if bounced on the trend line and give a strong bearish signals , the down trend might continue.
In general sense:
BTC has a bullish outlook as it is trading inside a falling wedge. Double bottom happened on the support level accompanied by bullish engulfing candle , that’s a bullish signal.

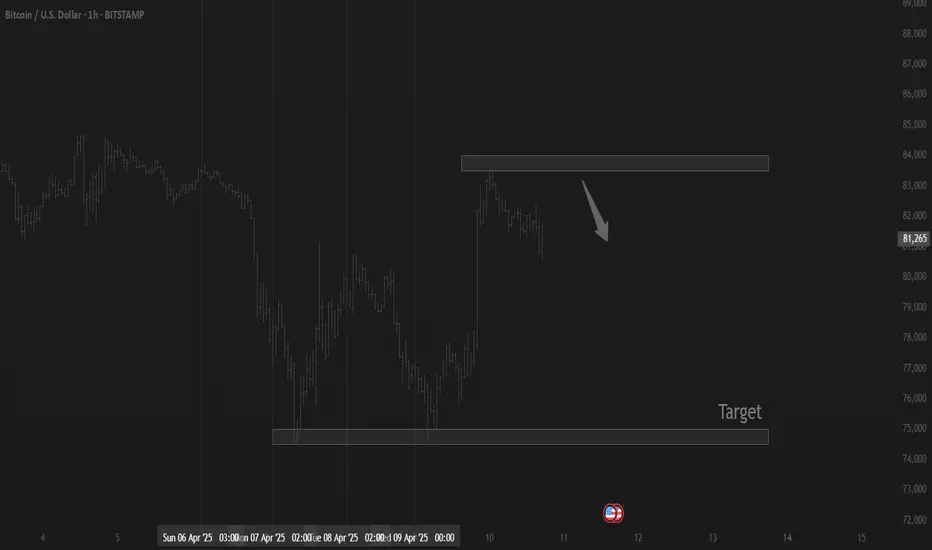
Trump Manipulates the Market Again: Tariffs ON/OFF PlayOnce again, we’re watching how political narratives are used to shake the markets — and Bitcoin was no exception this time.
🔻 Step 1: "TARIFFS ON" Announcement
Market instantly reacts with a sharp sell-off
BTC drops from 81K to nearly 75K
Fear spikes, media goes wild
📉 That’s your classic short squeeze setup.
🔺 Step 2: "TARIFFS OFF" Retraction
Massive green candle, BTC rebounds from lows
Shorts get liquidated
Price rips back up in minutes
💸 It’s a textbook fake panic followed by a well-timed reversal. Someone knew what was coming. Someone profited. And it wasn’t retail.
🔎 What does this mean? This is not just market volatility — this is narrative-based manipulation. If you're trading without paying attention to headlines, you're already behind.
🧵Follow the money. Follow the timing. Follow the candles. #Bitcoin #BTCUSD #MarketManipulation #Tariffs #Trump #PoliticsInMarkets #Whales #NarrativeTrading #PriceAction

Three white levels to accumulate bitcoinIf we look at #BTC chart in monthly time frame, it would be easy to see the action from Elliott theory point of view.
After the previous bull market cycle, there was a correction than continued until 0.786 level, if this happens again, the lowest price that we will see in next several months would be around 45k.
So based on historical action i decided to predict the possible future. it will be a great guide for you to buy bitcoin in decent prices.
love you all

BTC Hash RibbonAs requested by Master Ananda, here is the BTC hash ribbon indicator flashing a buy signal. There is typically a short lag after appearing before BTC's next up move begins. Enjoy!

Bitcoin (BTC/USD) Slammed Back Into Channel SupportBitcoin shed -2.46% today, reversing sharply lower from the top of its descending channel and the 50-day SMA, reaffirming resistance just below $88,700. The rejection puts focus back on the 200-day SMA and mid-channel support.
🔻 Price remains firmly inside the falling channel
📉 MACD is flattening below zero — no bullish crossover yet
⚖️ RSI sits at 44 — modest bearish momentum without being oversold
If price breaks below $79,000, eyes may turn to the lower channel boundary near $72,000, and eventually the long-term trendline closer to $68,000.
Momentum is weak and trend pressure remains tilted downward unless bulls can reclaim the 50-day SMA and break out of this channel decisively.
-MW
