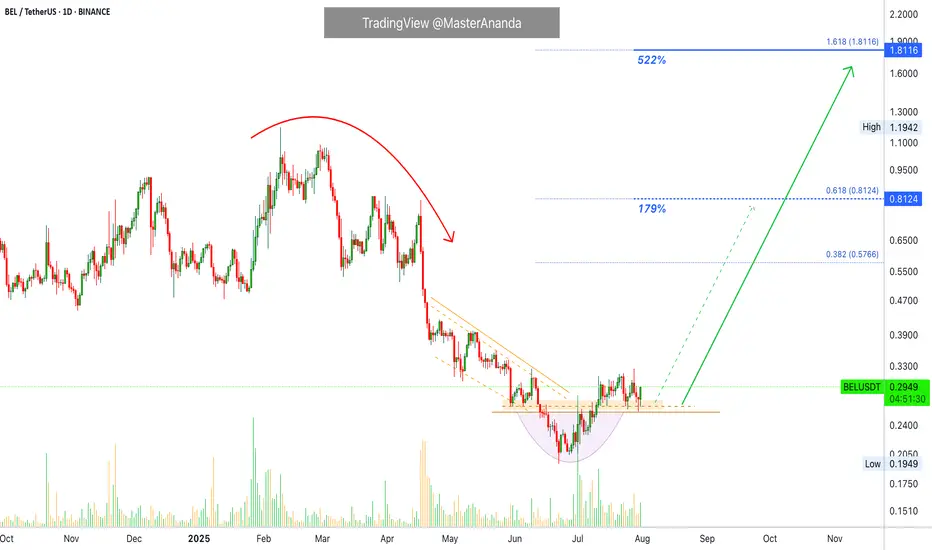
Bella Protocol 522% Easy Profits PotentialWe are going to be looking at many charts together every single day. We will go through all the altcoins basically. I am starting with some of those from the last period that didn't move. The charts look good but they filed to break their May high. These pairs are now ready to move before the rest of the market.
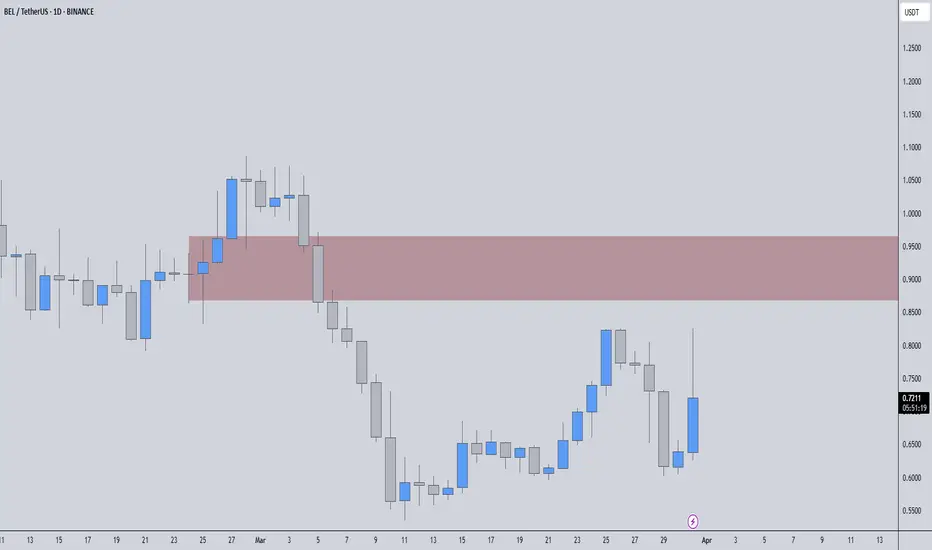
Here we have BELUSDT. A nice rounded bottom to end the downtrend. A small bullish recovery supported by high volume.
We have a perfect set of reversal signals and today a full green candle. This candle confirms those signals and opens up the chance of a strong advance. If the action starts now, you can be looking at the start of a major 2-3 months long move.
There will be some stops along the way but the action should be bullish nonetheless, higher highs and higher lows.
Strategy
In this setup we simply buy spot, no stop-loss. After buying we wait for as long as it is needed for prices to rise. Normally within 2-3 weeks, can be just a few days, but sometimes the wait can extend to 1-2 months. It varies. We are always prepared and ready to wait six full months, so if anything happens before this time horizon, even better but be ready to wait.
Even if you were to sell your current pair to buy a new one, the new one also requires waiting. We tend to sell wanting to find something that is moving but the moment we sell, we are faced with the same problem; even if the pair you chose is moving you have to wait for the bullish wave to develop. Even if prices rise 5% daily it would still take 20 days for a 100% price increase. 40 days for 200%. Etc. Patience is key.
So, simply, buy and hold. The market will take care of the rest.
Namaste.
BELUSDT trade ideas
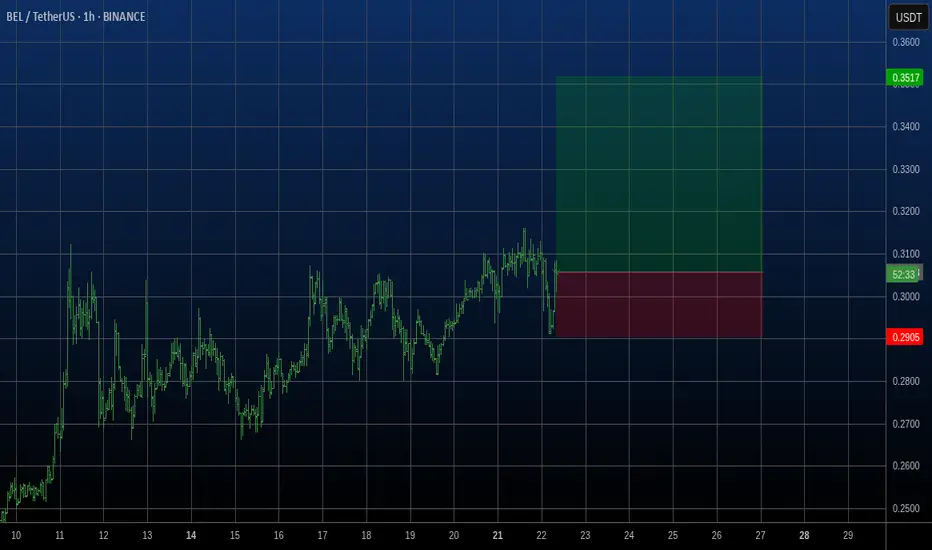
Fast trade on the BEL The good moment for try to Buy BELUSDT. We are in the flat channel and now ready to break it up and make fast move. The stop below local lowest low. Will see...
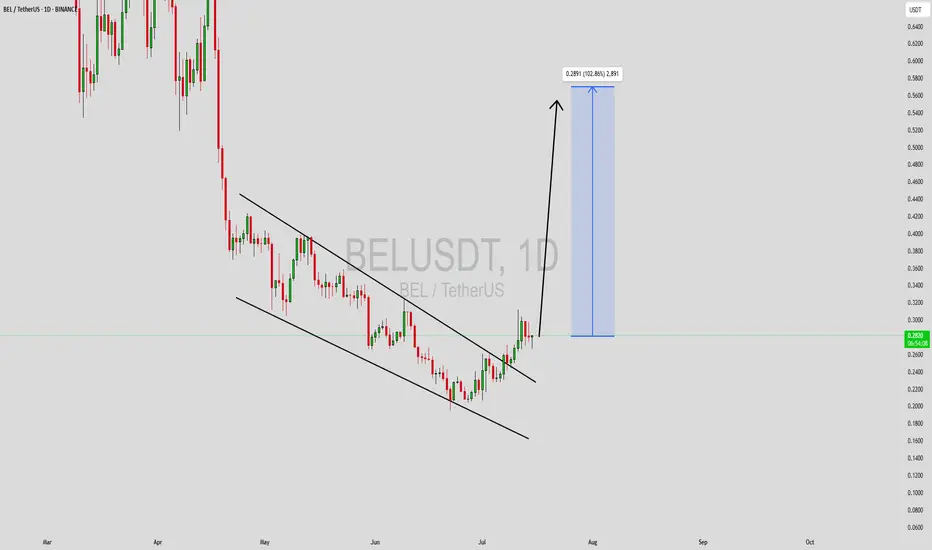
BELUSDT Forming Falling WedgeBELUSDT is currently shaping up a textbook Falling Wedge Pattern, which is widely recognized as one of the strongest bullish reversal patterns in crypto technical analysis. This pattern suggests that the recent downtrend could soon flip into a strong upward move once price breaks above the wedge resistance line. With good volume steadily building up, this setup indicates that both retail and institutional investors are showing increased interest in BELUSDT, anticipating a breakout that could deliver a substantial 90% to 100%+ gain.
The overall sentiment around BELUSDT has become more optimistic as traders and investors see this falling wedge as a prime accumulation zone. The price has been consolidating within the wedge, hinting at diminishing selling pressure and the potential for a sharp upward surge once the bulls take control. This consolidation phase provides a favorable risk-to-reward scenario for traders looking to enter early before the breakout rally begins in full force.
Another key point to note is that the market context for BELUSDT supports this bullish outlook. The crypto market has shown signs of renewed momentum, and altcoins like BEL often benefit from capital rotation when major coins like Bitcoin and Ethereum stabilize. Good trading volume further reinforces the likelihood of a clean breakout, giving traders confidence that any move higher could sustain and reach its target levels.
✅ Show your support by hitting the like button and
✅ Leaving a comment below! (What is You opinion about this Coin)
Your feedback and engagement keep me inspired to share more insightful market analysis with yo
BELUSDT 1D#BEL has broken out of the falling wedge to the upside on the daily chart, and a retest is currently in progress.
In case of a successful bounce and a breakout above the daily SMA50, the targets are:
🎯 $0.3240
🎯 $0.4039
🎯 $0.4684
🎯 $0.5329
⚠️ As always, use a tight stop-loss and apply proper risk management.

BELLUSDT Forming Bullish BreakoutBELLUSDT is shaping up as an interesting crypto pair to watch closely in the coming weeks. The chart structure shows a well-defined falling channel, which historically indicates a potential trend reversal when price breaks above the channel’s resistance. With the volume staying healthy, it is clear that investors are starting to accumulate positions in anticipation of a bullish breakout. This is often the early signal that smart money is entering the market before a major move.
Currently, the technical projection for BELLUSDT suggests an impressive upside potential of around 90% to 100%+. This aligns with broader market expectations as altcoins begin to show signs of recovery after extended downtrends. If this breakout confirms with increased volume and strong daily closes above the resistance line, BELLUSDT could attract more momentum traders, further driving the price upward toward the projected target area.
What makes BELLUSDT particularly attractive is the recent surge in investor interest and positive sentiment building around the project. When paired with technical clarity like this, it creates an ideal scenario for traders looking for high-reward setups. Keep an eye on the breakout zone and be ready to manage positions accordingly, as such moves can develop rapidly.
In summary, BELLUSDT is offering a compelling technical setup that could deliver significant returns for traders who position themselves wisely. Adding this pair to your watchlist and monitoring volume trends will be key in catching the next big move.
✅ Show your support by hitting the like button and
✅ Leaving a comment below! (What is You opinion about this Coin)
Your feedback and engagement keep me inspired to share more insightful market analysis with you!

$BEL - Buy Zone ActivatedBINANCE:BELUSDT :- Price points have been activated on the W chart. Looking a discounted buy zone at this point. Time to jump in. The target i'd llok for at this point is around $0.48. All the best..

GOOD POINT Hello friends
As you can see, the price has fallen to the bottom of the next channel with the channel break and now the important point is to see if the price is supported considering reaching the bottom of the channel and the important Fibonacci support?
To solve this issue, we suggest you buy stepwise, of course with capital and risk management...
*Trade safely with us*

BEL/USDTKey Level Zone: 0.3900 - 0.3920
HMT v8.1 detected. The setup looks promising, supported by a previous upward/downward trend with increasing volume and momentum, presenting an excellent reward-to-risk opportunity.
HMT (High Momentum Trending):
HMT is based on trend, momentum, volume, and market structure across multiple timeframes. It highlights setups with strong potential for upward movement and higher rewards.
Whenever I spot a signal for my own trading, I’ll share it. Please note that conducting a comprehensive analysis on a single timeframe chart can be quite challenging and sometimes confusing. I appreciate your understanding of the effort involved.
Important Note :
Role of Key Levels:
- These zones are critical for analyzing price trends. If the key level zone holds, the price may continue trending in the expected direction. However, momentum may increase or decrease based on subsequent patterns.
- Breakouts: If the key level zone breaks, it signals a stop-out. For reversal traders, this presents an opportunity to consider switching direction, as the price often retests these zones, which may act as strong support-turned-resistance (or vice versa).
My Trading Rules
Risk Management
- Maximum risk per trade: 2.5%.
- Leverage: 5x.
Exit Strategy
Profit-Taking:
- Sell at least 70% on the 3rd wave up (LTF Wave 5).
- Typically, sell 50% during a high-volume spike.
- Adjust stop-loss to breakeven once the trade achieves a 1.5:1 reward-to-risk ratio.
- If the market shows signs of losing momentum or divergence, ill will exit at breakeven.
The market is highly dynamic and constantly changing. HMT signals and target profit (TP) levels are based on the current price and movement, but market conditions can shift instantly, so it is crucial to remain adaptable and follow the market's movement.
If you find this signal/analysis meaningful, kindly like and share it.
Thank you for your support~
Sharing this with love!
HMT v2.0:
- Major update to the Momentum indicator
- Reduced false signals from inaccurate momentum detection
- New screener with improved accuracy and fewer signals
HMT v3.0:
- Added liquidity factor to enhance trend continuation
- Improved potential for momentum-based plays
- Increased winning probability by reducing entries during peaks
HMT v3.1:
- Enhanced entry confirmation for improved reward-to-risk ratios
HMT v4.0:
- Incorporated buying and selling pressure in lower timeframes to enhance the probability of trending moves while optimizing entry timing and scaling
HMT v4.1:
- Enhanced take-profit (TP) target by incorporating market structure analysis
HMT v5 :
Date: 23/01/2025
- Refined wave analysis for trending conditions
- Incorporated lower timeframe (LTF) momentum to strengthen trend reliability
- Re-aligned and re-balanced entry conditions for improved accuracy
HMT v6 :
Date : 15/02/2025
- Integrated strong accumulation activity into in-depth wave analysis
HMT v7 :
Date : 20/03/2025
- Refined wave analysis along with accumulation and market sentiment
HMT v8 :
Date : 16/04/2025
- Fully restructured strategy logic
HMT v8.1 :
Date : 18/04/2025
- Refined Take Profit (TP) logic to be more conservative for improved win consistency

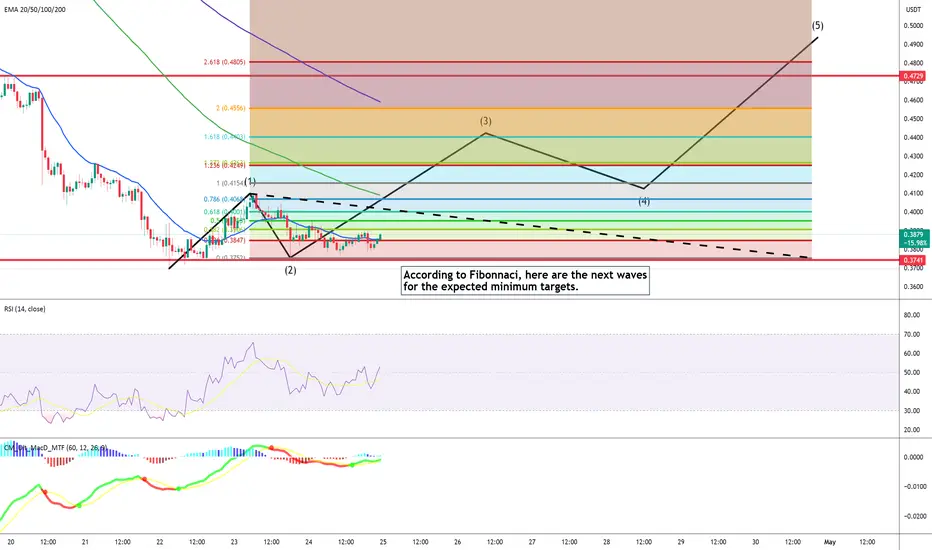
BELUSDT 1H TIMEFRAME - ELLIOT WAVES FROM FIBONACCI RETRACEMENTI just played with the Fibonacci retracement tool and traced the 5 waves with the minimum expected values.
--> If the probabilty with the retracements remains like this, then we could expect at least these results with the retraced minimum values .
--> Else if it collpases under the starting point of the wave 1 then these retracements should be ignored.
BELUSD - Quick tradeCurrently, this is one of the coins that has dropped the most.
The highlighted box should act as a support zone, with bullish divergence showing on the RSI for the 5min, 15min, and 1h charts.
A strong retracement is possible, but I plan to take profits quickly.
Will put orders at 0.3987 .

BELUSDT 1W AnalysisBEL ~ 1W Analysis
#BEL Buy gradually from here if you still have a Conviction on this coin with a short -term target of at least 20%+.

BELUSDT – Huge Volume Spike - Strong Resistance!🔴 First Strong Resistance Identified!
The red box is the key resistance level where selling pressure is expected. This is a crucial area that will determine the next major move.
📉 How I’m Approaching This Trade:
✔ Short Opportunities: If price rejects from this zone, I will look for lower time frame confirmations to enter a short position. No confirmation, no trade.
✔ Break & Retest: If price breaks above with volume and retests the level as support, I may shift my bias and look for a long opportunity.
🔥 Why You Need My Analysis:
I operate at a level most traders can’t even comprehend—using secret protocols that give me the highest win rate in the market. While others are guessing, I’m executing trades with absolute precision.
📌 Stay Ahead – Follow My Trades:
Most traders have no idea how to navigate these zones, but that’s why I consistently dominate the market. Follow closely—every move matters.
I keep my charts clean and simple because I believe clarity leads to better decisions.
My approach is built on years of experience and a solid track record. I don’t claim to know it all, but I’m confident in my ability to spot high-probability setups.
If you would like to learn how to use the heatmap, cumulative volume delta and volume footprint techniques that I use below to determine very accurate demand regions, you can send me a private message. I help anyone who wants it completely free of charge.
I have a long list of my proven technique below:
🎯 ZENUSDT.P: Patience & Profitability | %230 Reaction from the Sniper Entry
🐶 DOGEUSDT.P: Next Move
🎨 RENDERUSDT.P: Opportunity of the Month
💎 ETHUSDT.P: Where to Retrace
🟢 BNBUSDT.P: Potential Surge
📊 BTC Dominance: Reaction Zone
🌊 WAVESUSDT.P: Demand Zone Potential
🟣 UNIUSDT.P: Long-Term Trade
🔵 XRPUSDT.P: Entry Zones
🔗 LINKUSDT.P: Follow The River
📈 BTCUSDT.P: Two Key Demand Zones
🟩 POLUSDT: Bullish Momentum
🌟 PENDLEUSDT.P: Where Opportunity Meets Precision
🔥 BTCUSDT.P: Liquidation of Highly Leveraged Longs
🌊 SOLUSDT.P: SOL's Dip - Your Opportunity
🐸 1000PEPEUSDT.P: Prime Bounce Zone Unlocked
🚀 ETHUSDT.P: Set to Explode - Don't Miss This Game Changer
🤖 IQUSDT: Smart Plan
⚡️ PONDUSDT: A Trade Not Taken Is Better Than a Losing One
💼 STMXUSDT: 2 Buying Areas
🐢 TURBOUSDT: Buy Zones and Buyer Presence
🌍 ICPUSDT.P: Massive Upside Potential | Check the Trade Update For Seeing Results
🟠 IDEXUSDT: Spot Buy Area | %26 Profit if You Trade with MSB
📌 USUALUSDT: Buyers Are Active + %70 Profit in Total
🌟 FORTHUSDT: Sniper Entry +%26 Reaction
🐳 QKCUSDT: Sniper Entry +%57 Reaction
📊 BTC.D: Retest of Key Area Highly Likely
I stopped adding to the list because it's kinda tiring to add 5-10 charts in every move but you can check my profile and see that it goes on..
A tiny part of my runners;
🌊 WAVESUSDT.P: Demand Zone Potential
🟣 UNIUSDT.P: Long-Term Trade
🔵 XRPUSDT.P: Entry Zones
🔗 LINKUSDT.P: Follow The River
📈 BTCUSDT.P: Two Key Demand Zones
A tiny part of my runners;
💼 STMXUSDT: 2 Buying Areas
🐢 TURBOUSDT: Buy Zones and Buyer Presence
🌍 ICPUSDT.P: Massive Upside Potential | Check the Trade Update For Seeing Results
🟠 IDEXUSDT: Spot Buy Area | %26 Profit if You Trade with MSB
📌 USUALUSDT: Buyers Are Active + %70 Profit in Total
🌟 FORTHUSDT: Sniper Entry +%26 Reaction
🐳 QKCUSDT: Sniper Entry +%57 Reaction
j
📌I keep my charts clean and simple because I believe clarity leads to better decisions.
📌My approach is built on years of experience and a solid track record. I don’t claim to know it all but I’m confident in my ability to spot high-probability setups.
📌If you would like to learn how to use the heatmap, cumulative volume delta and volume footprint techniques that I use below to determine very accurate demand regions, you can send me a private message. I help anyone who wants it completely free of charge.
🔑I have a long list of my proven technique below:
🎯 ZENUSDT.P: Patience & Profitability | %230 Reaction from the Sniper Entry
🐶 DOGEUSDT.P: Next Move
🎨 RENDERUSDT.P: Opportunity of the Month
💎 ETHUSDT.P: Where to Retrace
🟢 BNBUSDT.P: Potential Surge
📊 BTC Dominance: Reaction Zone
🌊 WAVESUSDT.P: Demand Zone Potential
🟣 UNIUSDT.P: Long-Term Trade
🔵 XRPUSDT.P: Entry Zones
🔗 LINKUSDT.P: Follow The River
📈 BTCUSDT.P: Two Key Demand Zones
🟩 POLUSDT: Bullish Momentum
🌟 PENDLEUSDT.P: Where Opportunity Meets Precision
🔥 BTCUSDT.P: Liquidation of Highly Leveraged Longs
🌊 SOLUSDT.P: SOL's Dip - Your Opportunity
🐸 1000PEPEUSDT.P: Prime Bounce Zone Unlocked
🚀 ETHUSDT.P: Set to Explode - Don't Miss This Game Changer
🤖 IQUSDT: Smart Plan
⚡️ PONDUSDT: A Trade Not Taken Is Better Than a Losing One
💼 STMXUSDT: 2 Buying Areas
🐢 TURBOUSDT: Buy Zones and Buyer Presence
🌍 ICPUSDT.P: Massive Upside Potential | Check the Trade Update For Seeing Results
🟠 IDEXUSDT: Spot Buy Area | %26 Profit if You Trade with MSB
📌 USUALUSDT: Buyers Are Active + %70 Profit in Total
🌟 FORTHUSDT: Sniper Entry +%26 Reaction
🐳 QKCUSDT: Sniper Entry +%57 Reaction
📊 BTC.D: Retest of Key Area Highly Likely
📊 XNOUSDT %80 Reaction with a Simple Blue Box!
📊 BELUSDT Amazing %120 Reaction!
I stopped adding to the list because it's kinda tiring to add 5-10 charts in every move but you can check my profile and see that it goes on..
SPOT 2025 Signal - BELUSDTSPOT 2025 Signal
Signal Type: Swing Spot
Action: BUY
Entry: 0.6522
Target: $2.7 | $4.9 | $7.7
Hold Time: 2025
--------------------------------------
Important Note:
This is a long-term signal, and it will not activate until the price hits the trigger point. Patience is key – this isn't a scalping signal where profits come within a few days. Instead, it's an accumulation signal designed for steady growth.
Rest assured, like all our signals, this one is backed by a 100% confirmed upward trend (W formation). The signal will reach its targets in two distinct phases.

BELUSDT 1WBEL ~ 1W Analysis
#BEL Buy gradually from here with a short -term target of at least 20%+.

Good moment for Short BELGood moment for Short BEL.
We are in the flat, and now moving from up to down level. In the current moment on the middle value of this channel. I think this level will be broke. Good risk reward ratio. Will see.

Analysis and Trading Recommendation for BELUSDT: Targeting a 70%Trading Plan
Type: Spot trading, utilizing only available capital, avoiding leverage or borrowing to maintain low risk exposure.
Entry Point: $0.083 – the current price, supported by technical indicators and early signs of buying interest.
Profit Target: $0.1411 – a 70% gain, based on a key resistance level observed in previous price action.
Holding Period: 2 weeks – an appropriate timeframe to capture the anticipated price movement while allowing for market fluctuations.

Rebuy Setup For BEL (12H)Given the bearish CH and the formation of lower highs, BEL is expected to retrace toward lower levels.
If the price drops further, we will look for buy/long positions around the green zone.
A daily candle closing below the invalidation level will invalidate this analysis.
For risk management, please don't forget stop loss and capital management
Comment if you have any questions
Thank You

BEL/USDThello friends
Considering the drop we had, now we see the formation of a double bottom, which we can expect to move the specified resistance range.
*Trade safely with us*

BELUSDT.1DMarket Structure & Key Levels:
Current Price & Trend:
BEL is trading at $0.9101, showing a +2.12% gain.
The price has recently broken a key support-to-resistance flip, indicating potential further upside.
Key Support & Resistance Levels:
S1 ($0.7980): A critical support zone, where buyers may step in if a pullback occurs.
S2 ($0.6036): A stronger demand zone, which previously acted as a bottom structure.
R1 ($1.1931): A major resistance zone that needs to be cleared for further bullish continuation.
R2 (Trendline Resistance): The macro resistance level, marking the long-term supply zone.
High: $1.1942 (local top).
Low: $0.4451 (historical bottom).
Technical Indicators & Market Sentiment:
🔹 Trendline Analysis:
BEL is currently trading above previous consolidation levels, signaling a potential breakout structure.
A breakout above R1 could accelerate bullish momentum toward R2 (long-term resistance).
🔹 Potential Bullish Continuation Scenario:
If BEL successfully breaks R1 ($1.19) and sustains above it, it may target $1.30-$1.50 in the short term.
A move above R2 would confirm a larger trend continuation, potentially reaching $1.75-$2.00.
🔹 Bearish Pullback Scenario:
If BEL fails to break R1, a pullback toward $0.80 (S1) is likely.
A breakdown of $0.80 could lead to a deeper correction toward $0.60 (S2).
🔹 Liquidity & Volume Analysis:
Buying volume is increasing, suggesting accumulation before a potential breakout.
A strong bullish candle closing above R1 would confirm further upside.
🔹 Market Psychology:
Traders are watching $1.20 closely as a breakout level.
A rejection at R1 could lead to a short-term correction, allowing new buyers to enter at lower levels.
Conclusion & Trading Strategy:
Given the current price structure, my trading plan involves two key scenarios:
1️⃣ Bullish Breakout Strategy:
If BEL closes above $1.20 with high volume, I will enter a long position, targeting $1.30-$1.50.
A move beyond $1.50 would open the door for $1.75-$2.00 in the mid-term.
2️⃣ Bearish Pullback & Retest:
If BEL fails to break R1, I will look for support at S1 ($0.80) before re-entering.
A breakdown below $0.80 would signal a short-term downtrend, with $0.60 as a key support.
Risk Management:
Stop-loss for longs: Below $0.85 to protect against false breakouts.
Stop-loss for shorts: Above $1.25 in case of a breakout.
Leverage approach: Conservative, as BEL is currently in a breakout phase with high volatility.
Final Thought:
BEL is at a key inflection point, where a break above $1.20 could trigger a strong bullish rally, while failure to hold current levels could lead to a pullback toward support zones. I will closely monitor volume and price action to determine the optimal trading opportunity.

BEL/USDThello friends
According to the drop we had, we got the best support for buying for you, so that if you reach it, you can buy with risk management.
*Trade safely with us*

Long BELThe market a long time in the flat channel. Now we are on the middle level of this channel. The good point to by with small risk and good reward. Hope that price will move up to test the up level of channel. Will see...

BELUSDT: Manipulation Masterclass – Why Buyers Are in Control!BELUSDT Analysis Manipulation and Momentum: A Strong Bullish Setup
BELUSDT has manipulated a key level and surged upwards, suggesting there’s little reason for the price to revisit lower zones.
Highlights:
Active Buyers: Momentum is building as buyers step in, pushing the trend upward.
Blue Box Levels: Carefully selected zones for potential entries into the trend.
Confirmation Matters: As always, wait for lower time frame upward market structure breaks, supported by CDV and volume profile, to confirm your trades.
Key Observations:
"The blue boxes are very carefully picked using volume footprint, volume profile, cumulative delta volume, and liquidity heatmap. When trading this zone, I will look for buyers and upward market structure breaks in lower time frames for confirmation."
BELUSDT looks strong and ready for continuation. Follow the data and enter with confidence when confirmed. 🚀
Let me tell you, this is something special. These insights, these setups—they’re not just good; they’re game-changers. I've spent years refining my approach, and the results speak for themselves. People are always asking, "How do you spot these opportunities?" It’s simple: experience, clarity, and a focus on high-probability moves.
Want to know how I use heatmaps, cumulative volume delta, and volume footprint techniques to find demand zones with precision? I’m happy to share—just send me a message. No cost, no catch. I believe in helping people make smarter decisions.
Here are some of my recent analyses. Each one highlights key opportunities:
🚀 RENDERUSDT: Strategic Support Zones at the Blue Boxes +%45 Reaction
🎯 PUNDIXUSDT: Huge Opportunity | 250% Volume Spike - %60 Reaction Sniper Entry
🌐 CryptoMarkets TOTAL2: Support Zone
🚀 GMTUSDT: %35 FAST REJECTION FROM THE RED BOX
🎯 ZENUSDT.P: Patience & Profitability | %230 Reaction from the Sniper Entry
🎯 DEXEUSDT %180 Reaction with %9 Stop
🐶 DOGEUSDT.P: Next Move
🎨 RENDERUSDT.P: Opportunity of the Month
💎 ETHUSDT.P: Where to Retrace
🟢 BNBUSDT.P: Potential Surge
📊 BTC Dominance: Reaction Zone
🌊 WAVESUSDT.P: Demand Zone Potential
🟣 UNIUSDT.P: Long-Term Trade
🔵 XRPUSDT.P: Entry Zones
🔗 LINKUSDT.P: Follow The River
📈 BTCUSDT.P: Two Key Demand Zones
🟩 POLUSDT: Bullish Momentum
🌟 PENDLEUSDT.P: Where Opportunity Meets Precision
🔥 BTCUSDT.P: Liquidation of Highly Leveraged Longs
🌊 SOLUSDT.P: SOL's Dip - Your Opportunity
🐸 1000PEPEUSDT.P: Prime Bounce Zone Unlocked
🚀 ETHUSDT.P: Set to Explode - Don't Miss This Game Changer
🤖 IQUSDT: Smart Plan
⚡️ PONDUSDT: A Trade Not Taken Is Better Than a Losing One
💼 STMXUSDT: 2 Buying Areas
🐢 TURBOUSDT: Buy Zones and Buyer Presence
🌍 ICPUSDT.P: Massive Upside Potential | Check the Trade Update For Seeing Results
🟠 IDEXUSDT: Spot Buy Area | %26 Profit if You Trade with MSB
📌 USUALUSDT: Buyers Are Active + %70 Profit in Total
🌟 FORTHUSDT: Sniper Entry +%26 Reaction
🐳 QKCUSDT: Sniper Entry +%57 Reaction
📊 BTC.D: Retest of Key Area Highly Likely
This list? It’s just a small piece of what I’ve been working on. There’s so much more. Go check my profile, see the results for yourself. My goal is simple: provide value and help you win. If you’ve got questions, I’ve got answers. Let’s get to work!

BEL/USDT BYBIT:BELUSDT.P
It can be a great long trade on a short market.🔥
Explanation:
1. The instrument is looking stronger than the rest of the market.
2. The level is 0.9379 and it is clean and clear. There were no false breakouts, the level stays untouchable.
3. Above the level we have a clean zone. The zone is not contaminated by limit orders and lots of trades.
4. We are accumulating near the level.
5. The ATR is around 14%, if we go to the level we'll pass the 50% of the ATR, that's enough to make the trade.
✌️Please pay attention that:
- To enter the long the instrument should come to the level calm and slow, no fast drive.
- Now all the market is that the price can't breakout the level from the first attempt (in rear cases it can ofc). It means that it can be a false breakout and then the true breakout.
Good luck🍀!
