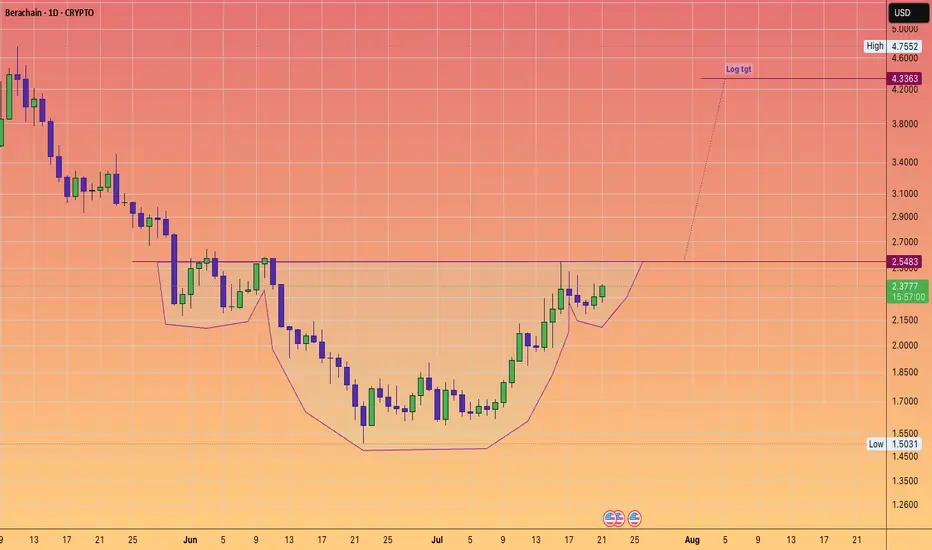
Berachain MOGGING the bears! Back to over $4#InverseHead&Shoulders
clean setup
log tgt provided.
sorry its altseason 100 things going on
no lengthy description needed :)
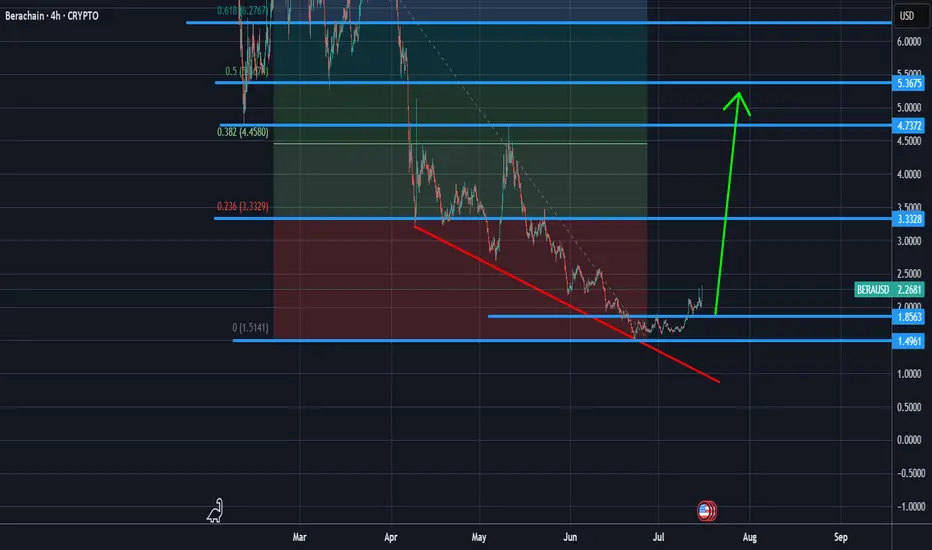
BERAUSD trade ideas
Am bullish all the way on BERACHAINexpecting it to shoot out to the moon. This will go high like bitcoin
Breaking: Berachain Coin ($BERA) Breaks Critical Support LevelBerachain's native coin ( BIST:BERA ) underwent a "Break of Structure" (BOS) cracking through the critical support level dipping 15% today.
It is worth noting that the EVM-identical Layer 1 blockchain that introduces Proof of Liquidity (PoL), a novel consensus mechanism aligning network security with liquidity provision has consecutively dip every week placing the asset on the cusp of reaching its 1-month low as hinted by the RSI at 21.
BIST:BERA is deeply oversold, it will need the general market to revived for BIST:BERA to make a comeback. With CRYPTOCAP:BTC faking the $80k support, most assets are in a state of respite as most of them assets mirror CRYPTOCAP:BTC 's price action.
The grit on BIST:BERA is high, the support point has already being broken. In order for BIST:BERA to make a comeback, it has to break above the 61.8% Fibonacci level which is a point that aligns with the $5- $6 price points.
Berachain Price Live Data
The Berachain price today is $3.66 USD with a 24-hour trading volume of $193,816,088 USD. Berachain is down 14.32% in the last 24 hours. The current CoinMarketCap ranking is #108, with a live market cap of $393,434,029 USD. It has a circulating supply of 107,480,000 BERA coins and the max. supply is not available.

Initial Base BreakoutProof of Liquidity live today. Feel like this one re-rates over coming weeks. Needs above $9 to breakout of its initial base.
Notice how this ranged sideways w/ volume drying up in the base, while the rest of the altcoin market fell off a cliff

BERACHAIN Chart Fibonacci Analysis 030425Trading Idea
1) Find a FIBO slingshot
2) Check FIBO 61.80% level
3) Entry Point > 6.13/61.80%
Chart time frame: B
A) 15 min(1W-3M)
B) 1 hr(3M-6M)
C) 4 hr(6M-1year)
D) 1 day(1-3years)
Stock progress: C
A) Keep rising over 61.80% resistance
B) 61.80% resistance
C) 61.80% support
D) Hit the bottom
E) Hit the top
Stocks rise as they rise from support and fall from resistance. Our goal is to find a low support point and enter. It can be referred to as buying at the pullback point. The pullback point can be found with a Fibonacci extension of 61.80%. This is a step to find entry level. 1) Find a triangle (Fibonacci Speed Fan Line) that connects the high (resistance) and low (support) points of the stock in progress, where it is continuously expressed as a Slingshot, 2) and create a Fibonacci extension level for the first rising wave from the start point of slingshot pattern.
When the current price goes over 61.80% level , that can be a good entry point, especially if the SMA 100 and 200 curves are gathered together at 61.80%, it is a very good entry point.
As a great help, tradingview provides these Fibonacci speed fan lines and extension levels with ease. So if you use the Fibonacci fan line, the extension level, and the SMA 100/200 curve well, you can find an entry point for the stock market. At least you have to enter at this low point to avoid trading failure, and if you are skilled at entering this low point, with fibonacci6180 technique, your reading skill to chart will be greatly improved.
If you want to do day trading, please set the time frame to 5 minutes or 15 minutes, and you will see many of the low point of rising stocks.
If want to prefer long term range trading, you can set the time frame to 1 hr or 1 day.

Ascending TriangleConstructive initial base and showing relative strength to the market. Possible breakout to ATHs as the weight of the market lifts.
Newly listed coins significantly outperforming recently, benefitting from lack of overhead supply, new innovations and learnings from the successful HYPE launch

BERACHAIN Stock Chart Fibonacci Analysis 021825Trading Idea
1) Find a FIBO slingshot
2) Check FIBO 61.80% level
3) Entry Point > 6.0/61.80%
Chart time frame: B
A) 15 min(1W-3M)
B) 1 hr(3M-6M)
C) 4 hr(6M-1year)
D) 1 day(1-3years)
Stock progress: A
A) Keep rising over 61.80% resistance
B) 61.80% resistance
C) 61.80% support
D) Hit the bottom
E) Hit the top
Stocks rise as they rise from support and fall from resistance. Our goal is to find a low support point and enter. It can be referred to as buying at the pullback point. The pullback point can be found with a Fibonacci extension of 61.80%. This is a step to find entry level. 1) Find a triangle (Fibonacci Speed Fan Line) that connects the high (resistance) and low (support) points of the stock in progress, where it is continuously expressed as a Slingshot, 2) and create a Fibonacci extension level for the first rising wave from the start point of slingshot pattern.
When the current price goes over 61.80% level , that can be a good entry point, especially if the SMA 100 and 200 curves are gathered together at 61.80%, it is a very good entry point.
As a great help, tradingview provides these Fibonacci speed fan lines and extension levels with ease. So if you use the Fibonacci fan line, the extension level, and the SMA 100/200 curve well, you can find an entry point for the stock market. At least you have to enter at this low point to avoid trading failure, and if you are skilled at entering this low point, with fibonacci6180 technique, your reading skill to chart will be greatly improved.
If you want to do day trading, please set the time frame to 5 minutes or 15 minutes, and you will see many of the low point of rising stocks.
If want to prefer long term range trading, you can set the time frame to 1 hr or 1 day.
