War of gapsBTC decided to fill the CME gap at 97.3k first, while the gap at 92k remains unfilled, what makes a retracement to 92k at some point still highly likely since CME gaps almost never remain unfilled.

BTC CME Gap in Play – Will It Pull Price Lower?📉 BTC CME Gap Alert
There’s a visible gap between 91,950 and 92,560—these often act like magnets, with price revisiting them more often than not. 🕳️
🔍 Why It Matters:
CME gaps tend to get filled, especially in trending markets.
🎯 What to Watch:
If BTC shows signs of weakness near local highs, a s

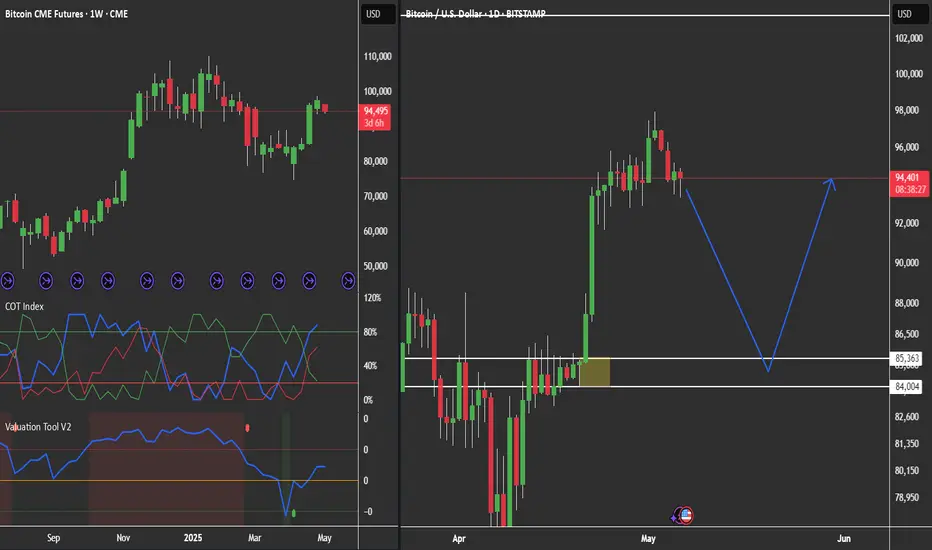
BTCUSDT - 4H - GAP 92K - Chicago Futures - SHSBTCUSDT - 4H - POSSIBLE SHS
TRADEX BOT NEWS:
In addition to the automated execution of individual trading strategies, we are working on enabling the bot to perform COPY TRADING STRATEGIES.
We want Trading View developers to be able to monetize their INDICATORS and STRATEGIES by allowing COPY TRAD

POT Long play $BTCUSDIf by the time that this demand zone get's hit, the red line (retailers) are bearish and atleast 20% line, I'll go for a long play at that Demand zone

When to buy Crypto and when to sell The only measure I've found that seems to have some consistency to assign relative value to crypto is by comparing BTC futures performance VS Nasdaq Total Return...
When BTC futures are in deep discounts it is time to Buy, when in wide premiums, it is time to sell!
Right now it's time to sell!

Bearish sign but we think it pushes to MAJOR RESISTANCEYesterday CRYPTOCAP:BTC formed a BEARISH ENGULFING. We've spoken on this pattern countless times.
However, we didn't bring it up because we didn't/don't think it's relevant.
WHY? Look at the paltry volume. Bitcoin volume is SUPER LOW.
BTC is still in Bullish mode from Late 2022.
---
We turned B

Bitcoin CME Futures Daily Trend AnalysisMarkets move in cycles, and different cycle durations help confirm trends ranging from short-term to long-term. Based on my analysis of the 5-day cycle, the Bitcoin CME Futures show a bearish signal. This suggests that the closing price on May 16, 2025, is likely to be lower than the opening price o

Big, but biggerIn fact, I think it's possible that BTC will leave a CME gap (yellow box) unfilled for the first time since October 2020, and that we're repeating the marked 2020 fractal in a much bigger way.

Bitcoin: Strength Within the TrendThe Bitcoin chart continues to look constructive, showing strength within a long-term uptrend that’s been in place since 2021.
🔍 While the daily chart may not tell the full story, a look at the weekly chart reveals the bigger picture:
✅ Price recently bounced off the 55-week moving average
✅ Structu

See all ideas
Summarizing what the indicators are suggesting.
Oscillators
Neutral
SellBuy
Strong sellStrong buy
Strong sellSellNeutralBuyStrong buy
Oscillators
Neutral
SellBuy
Strong sellStrong buy
Strong sellSellNeutralBuyStrong buy
Summary
Neutral
SellBuy
Strong sellStrong buy
Strong sellSellNeutralBuyStrong buy
Summary
Neutral
SellBuy
Strong sellStrong buy
Strong sellSellNeutralBuyStrong buy
Summary
Neutral
SellBuy
Strong sellStrong buy
Strong sellSellNeutralBuyStrong buy
Moving Averages
Neutral
SellBuy
Strong sellStrong buy
Strong sellSellNeutralBuyStrong buy
Moving Averages
Neutral
SellBuy
Strong sellStrong buy
Strong sellSellNeutralBuyStrong buy
Displays a symbol's price movements over previous years to identify recurring trends.
Related futures
Frequently Asked Questions
The current price of BTC Futures Contract is 104,568.8 USD — it has fallen −1.44% in the past 24 hours. Watch BTC Futures Contract price in more detail on the chart.
The volume of BTC Futures Contract is 786.48 K. Track more important stats on the BTC Futures Contract chart.
The nearest expiration date for BTC Futures Contract is Jun 27, 2025.
Traders prefer to sell futures contracts when they've already made money on the investment, but still have plenty of time left before the expiration date. Thus, many consider it a good option to sell BTC Futures Contract before Jun 27, 2025.
Buying or selling futures contracts depends on many factors: season, underlying commodity, your own trading strategy. So mostly it's up to you, but if you look for some certain calculations to take into account, you can study technical analysis for BTC Futures Contract. Today its technical rating is buy, but remember that market conditions change all the time, so it's always crucial to do your own research. See more of BTC Futures Contract technicals for a more comprehensive analysis.