EURO FX Futures (6E1!), H4 Potential for Bearish DropType: Bearish Momentum
Resistance: 1.00155
Pivot: 0.98445
Support: 0.95785
Preferred Case: On H4, as the price moving to test the descending trendlines, we have a bearish bias that the price may drop from the pivot at 0.98445, which is in line with the 23.6% fibonacci retracement to the 1st support at 0.95785 where the swing low is.
Alternative scenario: Alternatively, the price may rise to the 1st resistance at 1.00155, which is in line with the overlap resistance and 61.8% fibonacci retracement.
Fundamentals: There are no major news.
EURUSD1! trade ideas

EURO FX Futures (6E1!), H4 Potential for Bearish DropType: Bearish Momentum
Resistance: 1.01315
Pivot: 0.99670
Support: 0.95785
Preferred Case: On H4, as the price moving to test the descending trendlines , we have a bearish bias that the price may drop from the pivot at 0.99670, which is in line with the 23.6% fibonacci retracement to the 1st support at 0.95785 where the swing low is.
Alternative scenario: Alternatively, the price may rise to the 1st resistance at 1.01315, which is in line with the overlap resistance.
Fundamentals: There are no major news.

EURO FX Futures (6E1!), H4 Potential for Bearish DropType: Bearish Momentum
Resistance: 1.01315
Pivot: 0.99670
Support: 0.95785
Preferred Case: On H4, as the price moving to test the descending trendlines, we have a bearish bias that the price may drop from the pivot at 0.99670, which is in line with the 23.6% fibonacci retracement to the 1st support at 0.95785 where the swing low is.
Alternative scenario: Alternatively, the price may rise to the 1st resistance at 1.01315, which is in line with the overlap resistance.
Fundamentals: There are no major news.

EURO FX Futures (6E1!), H4 Potential for Bullish RiseType: Bullish Momentum
Resistance: 1.03220
Pivot: 0.99670
Support: 0.97270
Preferred case: On the H4 chart, we have a bullish bias, as the price breaking the long term descending trendline and above ichimoku cloud . The price may rise to the 1st resistance at 1.03220, which is in line with the 38.2% fibonacci retracement and overlap resistance from the pivot at 0.99670, where the 23.6% fibonacci retracement is.
Alternative scenario: Price may go back down to the 1st support at 0.97270, where the previous swing low is.
Fundamentals: There are no major news.

EURO FX Futures ( 6E1!), H4 Potential for Bullish MomentumType: Bullish Momentum
Resistance: 1.03220
Pivot: 0.99670
Support: 0.97270
Preferred case: On the H4 chart, we have a bullish bias, as the price breaking the long term descending trendline and above ichimoku cloud. The price may rise to the 1st resistance at 1.03220, which is in line with the 38.2% fibonacci retracement and overlap resistance from the pivot at 0.99670, where the 23.6% fibonacci retracement is.
Alternative scenario: Price may go back down to the 1st support at 0.97270, where the previous swing low is.
Fundamentals: There are no major news.

Volume profile scenarios at London Session and rest of dayTrade one SELL scenario, T1, will come as a small correction on the London Session targeting the Value area of Volume Profile, and Moving Average.
Trade two Buy scenario, T2, will come as a continuation of MA break. There is the possibility that the price will fall down to Volume Profile VA in conjunction with MA.
SL will be under POC
TP - 2 or 3 RR
If SL hit, then we wait for the price to break above VA and then enter Buy again.
Don't stumble trading. Trade Safe!

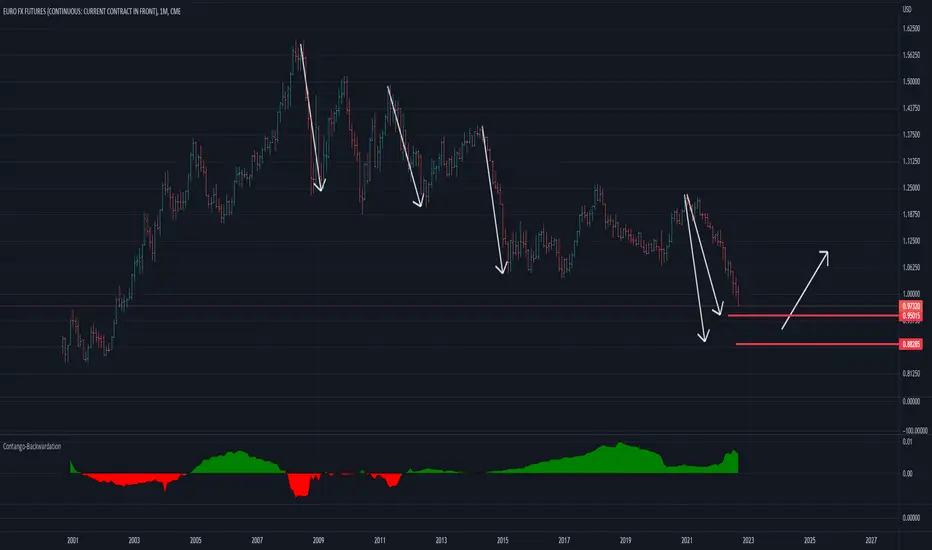
Will EURUSD Rally This WeekThis is the Futures Contract of EURUSD.
The Futures Contract is simply where price is PREDICTED to trade to in the future. Traders Buy Futures Contracts to hedge their trades. #TradingMadeSimple
So buy reading the Futures contract it gives the Sniper an edge to have a very good objective high probability perspective of where the market will probably trade to.
This is the Monthly TF.
The White Lines represent monthly SR. These are the brick 🧱 walls; the strongest areas of SR in the Forex Market.
I’ve broken down the sell to the most probable Low that was created on the last day of trading in the month of September.
Adding that the fundamentals for the EURO 💶 and the Dollar are perplexingly distraught there could be a major shift from EURO Falling to the depths of disparity and the Dollar 💵 soaring to the depths of no return.
This sets up a very high probability for EURO to Rally in October or at least consolidate a while before breaking North to possibly take out those Equal Highs I have annotated with the red SR LINE.
This would put the EURO 💶 above parity before the holiday season and bring the dollar 💵 down before Christmas here in the states.
With all of that said who’s buying EURO next month?
Never over leverage.
Trust your trade set up aka Detailed ANALYSIS based on your technicals AND fundamentals.
Have fun!!!
Never risk more than you are prepared to lose because anything can happen in these Markets!
I AM Pro Trading Made Simple.
Master Jedi - Sensi of #SniperGang 🏦🏦🏦

In the past the EURO Futures have always dropped more then 19%so waiting for a trend change price has to be below 0,95, so maybe in 2023
a change can happen
why people recommend to buy crypto or gold in such a clear dollar bullish environment I can not understand.
There will be a bounce soon but definatly not a trend change, if the euro future can not go above prior month high...
6E1! Futures Ideas for the next daysSome ideas of possible operations on Future FX 6E for the next few days. I intend to apply them as intraday hedging positions, as an alternative to my usual scalping.
Specifically, before carrying out my possible operations, I will need to have volumetric confirmation and volatility indications that reflect the previous conditions to determine a real interest in those price areas
Let's see how the situation will evolve.
Please do not take any of these ideas as a possible operational invitation.
These are personal impressions, and do not want to give rise to any kind of investment

Going Long on M6E Little scalpHello
Her it is a little scalp on M6E
I expect the Market will try to fill The FVG0 The we will see a run going long to fill The FVG1 and maybe the FVG2 too, im going long and my target its FVG1 the easiest one

Euro E-mini FUTURES (E71!), H4 Potential for Bearish DropType : Bearish Drop
Resistance : 1.0010
Pivot: 0.9929
Support : 0.9887
Preferred Case: On the H4, with price moving below the ichimoku indicator, we have a bearish bias that price will drop from pivot at 0.9929 where the previous swing lows are to the 1st support at 0.9887 where the swing low is.
Alternative scenario: Alternatively, price could break pivot structure and rise to 1st resistance at 1.0010 where the swing high and 23.6% fibonacci retracement are.
Fundamentals: Eurozone Services PMI are out today, most of them are lower than forecast.

buy euroAs we note
The euro has broken a strong collecting area
With an increase in the volumes of buyers, which confirms that we will notice a strong rise of the euro in the coming days

EURO FX FUTURES (6E1!), H4 Potential for Bearish DropType : Bearish Drop
Resistance :1.01020
Pivot: 0.99945
Support : 0.99945
Preferred Case: On the H4, with the price moving below the ichimoku cloud , we have a bearish bias that the price may drop from the pivot at 0.99945, where the 38.2% fibonacci retracement are to the 1st support at V, where the 61.8% fibonacci projection and swing lows are.
Alternative scenario: Alternatively, price could rise to 1st resistance at 1.01020, which in line with swing high and 38.2% fibonacci retracement .
Fundamentals: Spanish Flash CPI y/y is out today, showing 10.4%, which is lower than the expectation and previous. Additionally, German Prelim CPI m/m will be out today, the expectation is lower than the previous. Therefore, we would hold a bearish bias of the EURO FX future.

EURO FX FUTURES (6E1!), H4 Potential for Bearish DropType : Bearish Drop
Resistance :1.01020
Pivot: 0.99945
Support : 0.99945
Preferred Case: On the H4, with the price moving below the ichimoku cloud, we have a bearish bias that the price may drop from the pivot at 0.99945, where the 38.2% fibonacci retracement are to the 1st support at V, where the 61.8% fibonacci projection and swing lows are.
Alternative scenario: Alternatively, price could rise to 1st resistance at 1.01020, which in line with swing high and 38.2% fibonacci retracement.
Fundamentals: Spanish Flash CPI y/y is out today, showing 10.4%, which is lower than the expectation and previous. Additionally, German Prelim CPI m/m will be out today, the expectation is lower than the previous. Therefore, we would hold a bearish bias of the EURO FX future.

6E! Bullish longing a trade when price dip slightly lower.
good RR when ID and S is aligned.
Using ID techniques to enter and S patience to hold on the trade.

New Eur Fut Bullish AnalysisBreak out of range.
bullish unless price breaks below support
tg - 1.055

Futures (E71!), H4 Potential for Bearish MomentumType : Bearish Drop
Resistance : 1.0314
Pivot: 1.0151
Support : 1.0005
Preferred Case: On the H4, as the price is below descending trendline and the MACD indicators are below zero, we have a bearish bias that price may drop from the pivot at 1.0151 where the 61.8% fibonacci retracement is to the 1st support at 1.0005, which is in line with swing low.
Alternative scenario: Alternatively, price could rise to 1st resistance at 1.0314 where the 61.8% fibonacci retracement is.
Fundamentals: Rhine River, a pillar of the German, Dutch and Swiss economies for centuries is set to become virtually impassable at a key waypoint later this week, which impacted the transport of diesel and coal.

EURUSD - m15 buyBuy stop - key red level, need to break out
Targets depend on your frame
Minimum target is to complete the ABC to the upside.
Trade safe

Futures (E71!), H4 Potential for Bearish MomentumType : Bearish Drop
Resistance : 1.0314
Pivot: 1.0151
Support : 1.0005
Preferred Case: On the H4, as the price is below descending trendline and the MACD indicators are below zero, we have a bearish bias that price may drop from the pivot at 1.0151 where the 61.8% fibonacci retracement is to the 1st support at 1.0005, which is in line with swing low.
Alternative scenario: Alternatively, price could rise to 1st resistance at 1.0314 where the 61.8% fibonacci retracement is.
Fundamentals: Rhine River, a pillar of the German, Dutch and Swiss economies for centuries is set to become virtually impassable at a key waypoint later this week, which impacted the transport of diesel and coal.
