SASA Polyester (BIST) Technical Analysis: Bullish Falling Wedge Price Movement: The stock experienced a significant upward rally, as highlighted in blue. The percentage gain noted in the image is around 1321.64%, indicating a massive price surge. This rally is measured from a lower price level to a peak at approximately 9.50.
Bullish Falling Wedge: After the price reached its peak, the stock has been consolidating within a "falling wedge" pattern, which is typically considered a bullish continuation pattern. The falling wedge pattern is represented by two converging downward sloping trendlines, indicating that the price is making lower highs and lower lows.
Trendline Analysis: The yellow lines show a long-term trendline supporting the stock's upward movement, as well as a wedge pattern where the price is currently contained. The breakout from this wedge is expected to occur to the upside, as indicated by the schematic of the "Bullish Falling Wedge" in the bottom-right corner.
Current Price: The current price is hovering around 3.95, which is at a critical support level within the falling wedge. Traders will likely watch for a breakout above the upper trendline for a bullish signal, or a breakdown below the lower trendline for potential bearish momentum.
Volume: The volume is quite significant, showing strong activity at this price level, which can potentially fuel a breakout from the wedge pattern.
In conclusion, the chart suggests that if the stock breaks above the upper trendline of the falling wedge, it could resume its upward trajectory. Traders are likely watching for a bullish breakout confirmation.
SASA trade ideas

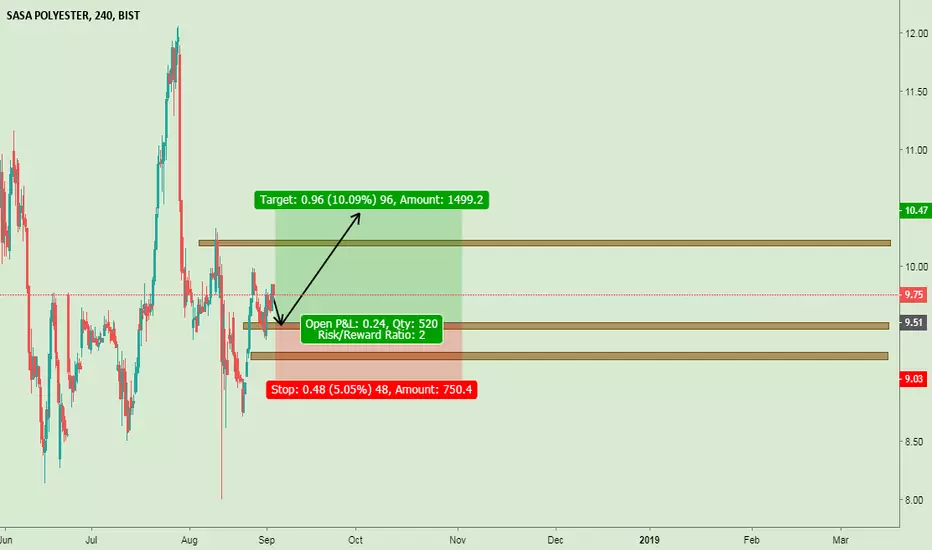
I call LONG for #SASAnot a financal advice. I believe that bulls wont let this opportunity slide. I will be following TRY50 as resistance. I am not a trader and I dont trade. experimental and educational content.

SASA - SAR - RSI - MACD - BOL (1H - 4H - 1D) - Sup and ResIt´s graphic in 1H - 4H - 1D formed the same pattern. The indicators are supporting a raising before going down for the partial correction until to the support line.
The price can be seen around 45 Turkish Liras in 3 months if it goes down with the will for touching to the support line.

SASA might be a good buy around these levels short timeSASA might be due a short bounce and an easy profit of around 5-10$, If the weekly closes above 114TRY it might even run back up to 150TRY levels which is even better but that's a weekly chart analysis and we're here for a daily swing trade buying at around 104-105TRY levels.


SASA about to explodePrice is consolidating at this level. Looking at the triangle formation, it may explode upwards.
TP Level 1: 65 TL
TP Level 2: 73.5 TL
TP may be reached by the first half of April.
Invest responsibly.

SASA (BIST) - Close the gapHumbled, we would like to thanks for your support who has already liked, commented and followed us. Your support, strengthens us, to help in analyzing the market.
If you have any questions, do not be hesitant to send us message (inbox). Again, We have also provide signal recommendation with detail instruction
SASA (BIST) - Close the gap

SASA Düzeltme Beklentisi1 ay içerisinde, 34-35 seviyelerine düzeltme mümkün; yaklaşık %25.
Kırılan direnç, destek olarak tekrar test edilmeli.
Destek çizgisi ile fib 0.382'nin kesişimi bu seviyede.
RSI da şişmiş vaziyette, havasının alınması gerekiyor.


SASASASA 23 MART tarihinden beri oluşturduğu kanal içerisinde yükseliş trendi devam etmektedir.Hedefler grafik üzerindedir.

SASA düzeltmelerSASA artan karlılığına rağmen piyasa belirleyicilerinin baskılarından dolayı beklenti rakamlarına ulaşamamaktadır. COVID aşı haberlerinin gelmesi Türkiye ve yurtdışı piyasalarının yeni yıla doğru rahatlatmasını öngörüyorum. YTD.

SASA - Correction Waves ( Doğrulama Dalgaları )TURKISH:
SASA genel olarak yükselmiş olsa da teknik analiz olarak hala potansiyeli var.
- 0.618 geri çekilme seviyesinden geri dönerek fibonacci 1 seviyesine kadar yükseleceği kanaatindeyim.
- Stop-loss olarak 20 EMA olarak belirlendi.
- RSI'ın içinde olduğu kanal da hafif inip sonrasında yükseleceğini doğrular nitelikte.
Düşünceleriniz, tavsiyeleriniz, bahsetmek istedikleriniz varsa yorumlara yazarsanız seve seve konuşabiliriz.
Hatırlatma:
Yazdıklarım şahsi fikirlerimi içerir. Bu fikirlerden yola çıkarak yapılacak olan al-sat işlemlerinden doğan kar veya zararlardan şahsım sorumlu değildir.
ENGLISH:
SASA is a little bit of high but according to tecnical analysis, has a little bit more high potential.
- I think it'll bounce at 0.618 fibonacci retracement level to the 1 fibonacci retracement level.
- Stop loss is 20 EMA
- The channel that RSI creates, corrects the rebounce of price.
If you have any ideas, advices and things that you want to mention of; you can write it down to the comment. We can gladly talk about it.
DISCLAIMER:
The ideas which i published are just my personal ideas. I am not accepting any responsibility for the trades based on that ideas.