Attempting to Time The Next Gold Rally (FPT & EPP Analysis)This video attempts to show you how to use Fibonacci Price Theory (FPT) and the Excess Phase Peak (EPP) patterns to attempt to time/estimate the next big Rally in Gold/Silver.
This is more of an educational video as timing market moves accurately is nearly impossible (IMO).
Some techniques (such as predictive modeling or other types of price pattern analysis) can help us estimate when the markets may make a big move, but they are still only about 55% to 75% accurate in most cases.
I've found the best solution is to more clearly identify price support/resistance using FPT and the EPP pattern to attempt to determine what stage of the EPP pattern price is currently in and how that relates to FPT short-, intermediate-, and long-term price structures.
In my mind, using price as the core element of my analysis eliminates the potential of getting confused by technical indicators and other data.
Price is the ultimate tool when attempting to trade or analyze the charts.
This video is designed to help you understand how to use the two techniques/theories (FPT & EPP) I teach to better understand price setups/trends/opportunities.
Get some.
#trading #research #investing #tradingalgos #tradingsignals #cycles #fibonacci #elliotwave #modelingsystems #stocks #bitcoin #btcusd #cryptos #spy #es #nq #gold
XAGUSD1! trade ideas

Silver1! Weekly Chart analysis-NFASilver1! Weekly Chart analysis-NFA
-Price came back inside weekly range after sweeping Buyside.
-Expecting price to bounce from next Weekly BISI (Support Level)
- i want the price(candle body) to stay above midpoint of green rectangle(BISI/Support)
-Weekly market structure also forming an inverted head and shoulder
-Any bearish weekly candle close below green support rectangle will invalidate the long setup and next target will be Sellside.

SILVER TECHNICALS MCXThis chart is a technical analysis of Silver Futures (MCX) on a daily timeframe. Here are some key technical insights:
1. Price Channels: The chart has two primary trend channels, one in blue (upward sloping) and another in red. These channels suggest that the price is moving within a rising trend, with the blue channel indicating a broader trend and the red lines showing a shorter-term trend within that range.
2. Fibonacci Levels: There are multiple Fibonacci retracement levels shown, which act as potential support and resistance levels. Key levels visible on the chart include:
• 23.6% (₹95,002), 38.2% (₹93,183), 50% (₹91,855), 61.8% (₹90,206), and 78.6% (₹88,693).
• These levels are commonly used by traders to identify potential reversal zones. The price has been moving close to these levels, which might serve as points of interest for bullish or bearish reactions.
3. Support and Resistance Levels: The levels ₹86,431 and ₹115,040 are highlighted in larger fonts, indicating strong support and resistance zones.
• ₹86,431 appears to be a key support level, aligning with a lower boundary near the blue channel and some Fibonacci levels.
• ₹115,040 is a significant resistance level, marking the upper limit of the price forecast in this analysis.
4. Price Action: The recent price movement shows a downward correction within the broader upward trend. Currently, the price is testing lower support areas within the channel and Fibonacci retracement levels, which may indicate a possible support zone if buyers re-enter.
5. Volume and Indicators:
• The volume bars at the bottom show trading activity, with recent volume spikes that may indicate significant buying or selling pressure.
• There is an oscillator (possibly MACD or RSI) below the volume bars, showing red and green areas, which suggests fluctuating momentum. Green areas indicate bullish momentum, while red shows bearish pressure.
6. Projection Lines: Vertical lines on Dec 26, 2024, and April 11, 2025, might mark anticipated future price areas or significant time zones where traders expect changes in trend direction.
Summary
The chart suggests that silver is currently in a corrective phase within a broader upward trend. Traders would watch for support around ₹86,431 and potential upside toward ₹115,040, with Fibonacci levels serving as key interim points for support and resistance. This setup would appeal to both breakout and pullback traders, depending on where the price moves relative to these levels.

sell silver today.sell 91200
target 88550
education purpose only.
it is fundamental and technical research.

Long trade
Wed 6th November 2024
Buyside trade
Tokyo Session PM
7.00 pm
Entry 31.290
Profit level 32.460 (3.74%)
Stop level 30.925 (1.17%)
RR 3.21
Position protected (1.34%)
Entry reason: Reading the footprint chart and price action

Will Silver Close at the High This Year?In September, we discussed the potential of silver forming a 'Cup & Handle' pattern, similar to what we observed with gold at the end of 2023. We saw how gold performed in 2024.
If the Silver can settle at around here at the end of this year, establishing this formation, we should be able to see the rising trend of the Silver in 2025.
In this tutorial, we will discuss why silver may close higher towards end of the year.
Silver Futures & Options
Ticker: SI
Minimum fluctuation:
0.005 per troy ounce = $25.00
Micro Silver Futures
Ticker: SIL
Minimum fluctuation:
0.005 per troy ounce = $5.00
Disclaimer:
• What presented here is not a recommendation, please consult your licensed broker.
• Our mission is to create lateral thinking skills for every investor and trader, knowing when to take a calculated risk with market uncertainty and a bolder risk when opportunity arises.
CME Real-time Market Data help identify trading set-ups in real-time and express my market views. If you have futures in your trading portfolio, you can check out on CME Group data plans available that suit your trading needs www.tradingview.com

Hedging Price Risk in Silver in a Pivotal Week This is a big week for financial markets, a long-anticipated election in the US is likely to have widely varying impacts across major asset classes. Safe haven assets such as silver stand to benefit from the uncertainty.
There is also an FOMC meeting scheduled on 7/Nov (Thu) where the Fed is widely expected to cut rates by 25 basis points. A lower rate environment also serves as tailwind for silver.
Finally, the Chinese parliament is expected to announce details of fiscal stimulus on 8/Nov (Fri). Fiscal stimulus in China also stands to benefit silver through higher investment demand as well as industrial demand.
In what should fundamentally be a strong week for silver, prices have entered the week on a bearish note following a 3.4% decline last week. While fundamental outlook for Silver remains bullish, this eventful week may drive unwanted volatility. Indeed markets are expecting large moves in silver prices with silver options IV near a 1-year high.
Source: CME Group CVOL
Investors can strategically deploy CME silver weekly options along with a long position in silver to capitalize on the fundamental increase while remaining protected against volatility.
BULLISH FUNDAMENTAL OUTLOOK FOR SILVER
Mint Finance covered some of silver’s bullish fundamental drivers in a previous paper .
In brief, robust growth from the photovoltaic (PV) sector is driving high demand. PV installations are surging, with global solar installations up 29% year-over-year, driven by aggressive climate policies and energy transition goals. This increase has directly boosted silver consumption, essential for PV production.
At the same time, silver markets have stayed in a supply deficit for the past four years. Silver miners have struggled to keep pace with the rapidly increasing industrial demand.
China’s massive stimulus package—its largest since the pandemic—also plays a crucial role, freeing up liquidity to revitalize its struggling economy. This stimulus supports sectors like PV and electronics, key industries for silver usage, while bolstering consumer confidence, which translates into heightened demand for silver in electronics and jewellery.
Investment demand for silver has started to pick up pace. Since July, U.S.-listed silver ETFs have seen over $942 million in inflows, particularly after the Fed’s rate cuts, which makes non-yielding assets like silver more attractive.
HIGHER SILVER JEWELLERY DEMAND IN INDIA
The recent festival season in India saw high demand for silver as buyers opted for it over gold. Silver sales by volume are expected to have increased 30-35% YoY while gold sales fell by 15% according to data from the Indian Bullion & Jewellers Association.
Rising investor interest in silver is partly due to its relative affordability compared to gold, which is trading at an all-time high. While high gold prices are dampening demand, especially for physical gold and jewellery, silver remains more accessible, supporting increased investment.
Rising investment demand, particularly for jewellery, risks pushing silver further into deficit. While jewellery demand for silver had been modest in recent years, 2022 saw a significant increase. According to the Silver Institute, jewellery demand is projected to grow by 4% in 2024 (but below 2022 levels), with actual demand potentially exceeding this due to the strong seasonal trend. Increased demand would further tighten silver supplies, likely driving prices higher over the next year.
UPCOMING FOMC MEETING AND CHINA STIMULUS TO DRIVE SENTIMENT
China’s parliament has started it five-day meeting on 4/Nov (Mon) and is expected to announce the details of the fiscal support on 8/Nov (Fri). Analysts suggest the fiscal plan could reach 10 trillion yuan ($1.4 trillion), with most funds likely allocated to refinancing local government debt. A substantial fiscal stimulus plan is likely to support silver prices.
Recent economic data from China has also shown a recovering industrial sector as China’s manufacturing PMI rose from 49.8 to 50.1 in Oct as the manufacturing sector shifted into expansion after 5 months of contraction. In case the trend continues, stronger industrial demand also stands to push silver prices higher.
SILVER IN THE MIDST OF CORRECTION DURING UPTREND
Silver continued its bullish momentum from September into October but has corrected sharply over the past week. During the rally earlier this year, when silver prices corrected, they were able to find support at the 38.2% and 61.8% Fibonacci levels. With Silver presently just above the 38.2% level, it may find support here.
Silver’s performance in the past two months has closely aligned with monthly pivot points. In both September and October, prices tested these pivot levels before moving higher. However, recent tests have shown smaller deviations from the pivot compared to prior months, suggesting that volatility could push prices slightly lower during this month’s test.
There is strong reason to believe that the general bullish trend is likely to continue into next year. According to a poll at the LBMA precious metal conference, delegates expect silver prices to rise to USD 45/oz over 2025, reflecting a 37% increase from present levels. Precious metal analysts were highly optimistic about silver, stating that higher industrial demand combined with continued supply deficit was likely to drive strong gains.
SEASONALITY SUGGESTS POTENTIAL FOR LARGE GAINS IN NOVEMBER
Silver prices closed out October with a 4.6% increase but are currently nearly flat for November. Historically, November has been a mixed month for silver, with an average price increase of 1.88% since 2000, though with high standard deviation. Notably, only 42% of Novembers have shown positive gains.
Despite this variability, past performance shows periods where silver either consistently declined or consistently rallied over multiple Novembers. Over the last two years, November has seen significant growth in silver prices; if this recent trend persists, silver could experience strong gains this month.
SILVER’S PERFORMANCE AROUND ELECTIONS
Certain safe haven and risk assets (gold, silver, BTC) stand to benefit from a Trump presidency. Historically, elections have impacted silver prices in varying ways. Following the Trump victory, silver stands to benefit.
Looking at silver’s historical performance in the two weeks following elections since 1980, prices increased by an average of 0.7% when a Republican replaced a Democrat president.
The Democrat-to-Republican shift has led to price rallies in two-thirds of cases.
SILVER’S PERFORMANCE AROUND FOMC MEETINGS
As mentioned, lower rates have a positive impact on non-yielding investment assets such as silver while also boosting industrial demand during periods with loose monetary policy. During the Fed easing cycles in 2001, 2007, and 2019, silver reacted positively to Fed rate cuts in 68% of cases (performance measured 1 week after FOMC meeting with monetary easing) with an average of 0.9% appreciation on the CME Silver front month contract.
Source: CME FedWatch
CME FedWatch tool is suggesting that a 25-basis point rate cut is most likely at the upcoming meeting on 7/Nov with a probability of 98%. As the outcome is largely anticipated, the impact of the meeting on silver prices may be minimal.
HYPOTHETICAL TRADE SETUP
Silver remains bullish with strong fundamental drivers including the rapid growth in the PV industry and strong investment demand.
This week, several major events are expected to drive significant volatility in the silver market. While these events are generally anticipated to boost silver demand, prices may remain unstable and could see short-term declines.
Silver is currently trading near its support levels, but increased event-driven volatility this week could lead to significant price swings. In late October, for example, silver briefly surged nearly 4% above usual resistance levels during short bursts of volatility. Although trading volume remained concentrated near the support level, the risk of sudden, sharp moves remains. This could result in a long silver position being prematurely closed out.
With a long position in silver futures at risk from near-term event risks, investors can deploy CME weekly options to hedge a long position from near-term volatility which increases tail risk.
In the following hypothetical trade setup, investors can combine a long position in CME micro silver futures expiring in December (SILZ4) at an entry of 32 with a protective put using CME silver weekly options expiring on 8/Nov (Fri) (SO2X4) at a strike level of 31 (delta 20, premium of 0.087/oz or USD 435) offers a compelling trade setup while remaining hedged against near-term volatility.
Using a delta-20 put option keeps the position fully delta-hedged for the week, as the delta of the long micro silver position aligns with the option’s delta at 20. Since each micro silver contract is one-fifth the size of a full contract, this setup effectively maintains the hedge.
In case prices dip below 30.64 by Friday due to volatility from the election, FOMC meeting, and China parliamentary meeting, the put option would offset any losses from the futures leg.
In the later part of the month, the outlook for silver is likely to be bullish given the fundamental factors highlighted above, in case prices rise, the position would become profitable above 32.44, offsetting the premium paid for the short-term option.
The scenarios in which the position loses:
1) In case prices remain between 30.64 and 32.44
2) In case prices fall below 30.64 following the put option expiry on 8/Nov
The scenarios in which the position profits:
1) In case prices fall below 30.64 before the put option expiry on 8/Nov
2) In case prices rise above 32.44 at any point
It should be noted that it would be prudent to set a stop loss on the long futures position following options expiry at 31 to minimize losses in case of a decline after options expiry.
MARKET DATA
CME Real-time Market Data helps identify trading set-ups and express market views better. If you have futures in your trading portfolio, you can check out on CME Group data plans available that suit your trading needs tradingview.com/cme .
DISCLAIMER
This case study is for educational purposes only and does not constitute investment recommendations or advice. Nor are they used to promote any specific products, or services.
Trading or investment ideas cited here are for illustration only, as an integral part of a case study to demonstrate the fundamental concepts in risk management or trading under the market scenarios being discussed. Please read the FULL DISCLAIMER the link to which is provided in our profile description.

SILVER Downtrend Alert! Short Trade Setup Ready for Major ProfitSILVER Commodity Technical Analysis (INDIAN Market):
On the 1-hour timeframe, Silver (Commodity) is showing a clear bearish pattern, validating a short trade entry at 95437. The price is approaching key target levels, with TP1 (92725) nearly achieved, suggesting a continuation of the downtrend in the short term.
Trade Summary:
Entry Level: 95437
SILVER Target Levels:
TP1: 92725 (nearly hit)
TP2: 88337
TP3: 83948
TP4: 81236
Stop Loss: 97631
The Risological Dotted Trendline adds further confirmation to the bearish sentiment, guiding this setup toward anticipated targets. Silver’s momentum suggests traders should watch closely as it edges toward additional profit-taking levels!
For extra safe traders, the Trailing Stop for this position is at 96,160

Gold & Silver Struggling To Break Away From Consolidation PhaseI created this video to highlight why I believe Gold & Silver could stay within a very wide consolidation range until after November 7~10 as the US markets enter a SHOCK phase after the elections.
Yes, I believe Gold & Silver will ultimately rally much higher, but my weekend research suggests the US & Global markets will stay in a low liquidity phase for about 7 to 10+ days after the election and I believe THAT is the reason why Gold & Silver will appear TRAPPED in a sideways price range.
Ultimately, we'll see what happens with Gold and Silver and if my research is correct or not. I just wanted to alert traders that Gold/Silver and other metals/miners appear to be trapped in a price anomaly event over the next 10+ days that suggests metals will fall downward, trade within a sideways price range, and attempt to move out of that range after November 11.
Let's see how it plays out.
Get some.
#trading #research #investing #tradingalgos #tradingsignals #cycles #fibonacci #elliotwave #modelingsystems #stocks #bitcoin #btcusd #cryptos #spy #es #nq #gold

SPY/QQQ Plan Your Trade 11-1 Update: Silver Still LeadingPlease watch this video to understand why I believe the downside risks are still dominant related to price trending.
Yes, we've seen a solid recovery today, but watching Silver and RSP, it appears the Excess Phase Peak pattern is still progressing toward a breakdown new low.
I urge all traders to stay very cautious of the risks throughout today and Monday.
The markets need to climb higher quite a bit to invalidate this pattern - and I don't see that happening before Nov 5.
Buckle up.
Get some.

Gold & Silver Enter Phase #3 of the Excess Phase Peak PatternGet ready. Both Gold & Silver have moved into Phase #3 of the Excess Phase Peak Pattern - suggesting Gold & Silver will consolidate briefly before either attempting to break downward toward an ultimate low or revert higher, trying to take out the recent highs.
I estimate that Gold and Silver will break downward as fear and panic settle into the market ahead of the US elections.
If you've been following my research for the past 4+ weeks, you already know I predicted this move nearly a month ago, and now we are seeing Gold and Silver roll strongly to the downside.
What is interesting is that they both set up excess phase peak patterns. Gold set up a very quick Phase #1 & #2 (flagging) pattern, whereas Silver's #1 & #2 setup took much longer.
I believe Silver is leading the markets a bit right now throughout this Excess Phase Peak pattern.
If my research is correct, Gold and Silver will break downward over the next 4+ days to identify a substantially lower low - the Ultimate low.
After that, Gold and Silver will base/bottom and move into a very strong recovery phase.
Are you ready for market opportunities over the next 5+ years? Follow my research/videos to learn how you can capitalize on these big moves.
Get some.
#trading #research #investing #tradingalgos #tradingsignals #cycles #fibonacci #elliotwave #modelingsystems #stocks #bitcoin #btcusd #cryptos #spy #es #nq #gold

Still room left / 70s and 2000s bullJust compare the %-Distance during the last 2 bull-runs.
We have some upside left.

Daily Pre-Market Analysis: GOLD & SILVER BUY Watch!Tuesday Oct 29th
I have a bullish bias on the day for both Gold and Silver.
A pullback on the 1H TF to a +FVG, and we may get the buy entry I am looking for.
Check the comments section below for updates regarding this analysis throughout the week.
Enjoy!
May profits be upon you.
Leave any questions or comments in the comment section.
I appreciate any feedback from my viewers!
Like and/or subscribe if you want more accurate analysis.
Thank you so much!
Disclaimer:
I do not provide personal investment advice and I am not a qualified licensed investment advisor.
All information found here, including any ideas, opinions, views, predictions, forecasts, commentaries, suggestions, expressed or implied herein, are for informational, entertainment or educational purposes only and should not be construed as personal investment advice. While the information provided is believed to be accurate, it may include errors or inaccuracies.
I will not and cannot be held liable for any actions you take as a result of anything you read here.
Conduct your own due diligence, or consult a licensed financial advisor or broker before making any and all investment decisions. Any investments, trades, speculations, or decisions made on the basis of any information found on this channel, expressed or implied herein, are committed at your own risk, financial or otherwise.

GOLD and Silver Futures OUTLOOK for the week of Oct. 28, 2024Coming into this week we can see both Gold and Silver are trading away from bullish imbalances, also forming SMT's off those imbalances. We also see that both commodities have CISD's coming off the same lows. In my opinion Gold is showing relative strength, given the fact that it has a failure swing at the lows, while the contrary for Silver. My focus will be towards gold being the stronger pair to long in this scenario. Looking forward to a productive week. Bless.

SILVER MCXSilver MCX - Current Trend Lines
Support & Resistance level & Zone for Silver - MCX to watch out for as per 15min chart.

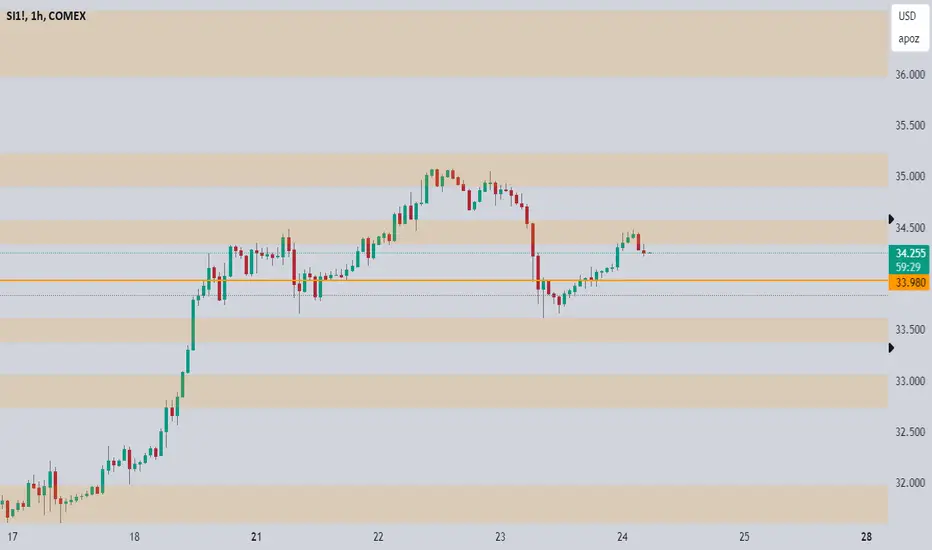
SILVER WEEKLY ALERTSILVER WEEKLY ALERT
After sharp corrective pullback yesterday, silver bounced back to trade around 34.40.
Price is currently in wave 3 targeting 35.35 to 35.55 area initially.
After wave 3 is completed we may see a sharp corrective pullback that is WAVE 4 targeting 32.40 to 32.90 area.
Wave 5 will then target the final rally towards 36.12 area.

Directional bias for trade filtering on lower TF , or 70 win %
Hi there!
I’m excited to share a system I’ve developed called 'Zones.' These zones offer a directional bias, helping predict where price is likely to move next with a current follow-through rate of 70%. In other words, if the price exits one of the orange zones, there’s a 70% chance it will reach the next orange zone, at least touching the boundary, rather than reversing back and closing within the previous zone.
You can trade these zones directly for a 70% win rate, or use them as a directional bias to complement your existing strategy on a 1-minute or 5-minute chart (which I highly recommend).
Important note: When the price briefly exits a zone but doesn’t close outside it, this is not considered a valid exit — we call this a "spike" or wick. For the 70% win rate to apply, the price must close outside the zone.
These zones are the result of years of research, experimental machine learning development, and collaboration with colleagues who have decades of experience in physics. And the best part? I’m offering them completely free.
The real challenge isn’t just following a system with a 70% win rate — it’s whether you can overcome your own psychology and avoid sabotaging your success. If you had a winning strategy, what’s really stopping you from being consistently profitable? Often, the answer is ourselves.
My zones are built on theoretical thermodynamics and mathematical proofs that help predict the likely trajectory of a system, similar to particle movement in physics.
Keep in mind, the orange zone line represents an unpredictable area — while the price often touches the line, there are instances where it may not reach it. Due to the inherent limitations of modern physics, this zone remains an unsolvable area, adding a layer of uncertainty to the system.
I promise, none of the paid indicators, whether it’s LuxAlgo or anything from a Pine Wizard or trading “guru,” can match the accuracy of these zones. But don’t take my word for it — try them for yourself and see the results!
Directional bias for trade filtering on lower TF , or 70 win %Hi there!
I’m excited to share a system I’ve developed called 'Zones.' These zones offer a directional bias, helping predict where price is likely to move next with a current follow-through rate of 70%. In other words, if the price exits one of the orange zones, there’s a 70% chance it will reach the next orange zone, at least touching the boundary, rather than reversing back and closing within the previous zone.
You can trade these zones directly for a 70% win rate, or use them as a directional bias to complement your existing strategy on a 1-minute or 5-minute chart (which I highly recommend).
Important note: When the price briefly exits a zone but doesn’t close outside it, this is not considered a valid exit — we call this a "spike" or wick. For the 70% win rate to apply, the price must close outside the zone.
These zones are the result of years of research, experimental machine learning development, and collaboration with colleagues who have decades of experience in physics. And the best part? I’m offering them completely free.
The real challenge isn’t just following a system with a 70% win rate — it’s whether you can overcome your own psychology and avoid sabotaging your success. If you had a winning strategy, what’s really stopping you from being consistently profitable? Often, the answer is ourselves.
My zones are built on theoretical thermodynamics and mathematical proofs that help predict the likely trajectory of a system, similar to particle movement in physics.
Keep in mind, the orange zone line represents an unpredictable area — while the price often touches the line, there are instances where it may not reach it. Due to the inherent limitations of modern physics, this zone remains an unsolvable area, adding a layer of uncertainty to the system.
I promise, none of the paid indicators, whether it’s LuxAlgo or anything from a Pine Wizard or trading “guru,” can match the accuracy of these zones. But don’t take my word for it — try them for yourself and see the results!

SILVER READY FOR 120000 LEVELMCX:SILVER1! trade at 99000 level. You can watch for a huge upside move upto 120000 level...

silver: a long road aheadI think: the long-term goal can reach 53, but we need to study carefully, because silver is also an industrial material, a commodity.
Silver: - is building a price base 2 with a target of 44.
-At the end of the previous 20 year bull cycle, a 10 year bull cycle follows to create a set of 30 year cycles.

Dont Buy Silver Here; Watch Gold/Silver RatioSilver has been mostly sideways since 2021 and till 2024, when metal clearly formed a corrective price action because of choppy and overlapping moves. Ideally, that was a very big triangle that sent prices sharply higher this year as shown on weekly chart below. We have seen some nice turn up, due to inflation hedge, CB easing and geopolitical tensions. In fact, we can see some volatility in last few weeks with sharp move out of a big contracting range; its an impulsive reaction since price broke above $25, but notice that price now trades $34-37 area as expected; marked as potential resistance zone identified by swing highs from 2012, 2013, and Fibonacci levels.
The reason why we should be aware of a resistance on silver and also gold, is gold/silver ratio (XAUSD/XAGUSD ), which is pointing higher after an A-B-C corrective setback. Based on past correlations, bullish gold/silver ratio is usually bearish for metals, so if ratio start moving higher, then watch out for a limited upside on silver. From an Elliott wave perspective this push higher on XAUSD/XAGUSD chart would deffinitely not be a surprise because of bullish pattern.
If someone wants to join uptrends on gold and silver, then due to the reasons described above, it may not be a bad idea to wait on some pullback first. $30 can be an interesting levels in such case.

Head & Shoulder Breakout in Silver.Silver is ready to rocket.
After giving a gap up breakout of H&S pattern Silver Fut is looking superb for a new record high.
We should see silver around 1,11,000 by Diwali.

SILVER Rockets Beyond All Targets – 6,000 Points Secured!SILVER Futures (15m time frame), Long Trade
Entry: ₹92,508
Current Price: ₹98,451
All Targets Hit!
Key Levels:
Entry: ₹92,508 – Positioned after a clear bullish breakout from consolidation, following a strong uptrend.
Stop-Loss (SL): ₹91,769 – Placed below recent support to manage risk in case of a reversal.
Take Profit 1 (TP1): ₹93,420 – Already hit, confirming momentum continuation.
Take Profit 2 (TP2): ₹94,896 – Successfully reached, indicating a sustained buying interest.
Take Profit 3 (TP3): ₹96,373 – Achieved, reinforcing the trend strength.
Take Profit 4 (TP4): ₹97,285 – All targets met, signaling a powerful bullish surge.
Trend Analysis:
The price movement stayed well above the Risological Dotted Trendline, indicating strong bullish momentum. Each take profit level was hit, showcasing a clear uptrend without significant pullbacks.
The long entry capitalized on a breakout of consolidation with growing volumes. The continuation of higher highs confirms that buying pressure remains strong, allowing all targets to be comfortably reached.
With the current price significantly above all targets, the trade has yielded excellent returns.
