XAUUSD – New Week Technical Bias (Market Open)
Bias Overview:
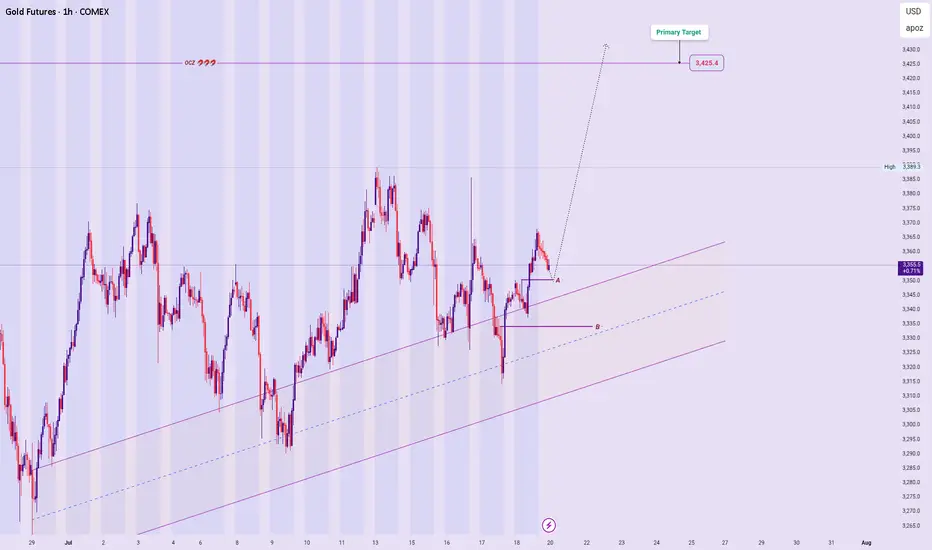
Current outlook remains aligned with previous bullish analysis, supported by the broader Ascend Sequence on higher timeframes.
Price Expectations:
Anticipating a micro decline toward Price Zone A as a potential springboard for a bullish continuation.
While less likely, a deep
Related commodities
Twitter Speculation sent Gold FLIP Floppin!So yesterday there was a few Tweets that caused chaos in the market. Fed Rumors about Powell getting fired. Im still looking for my long. Waiting for a sweep on levels before getting active.

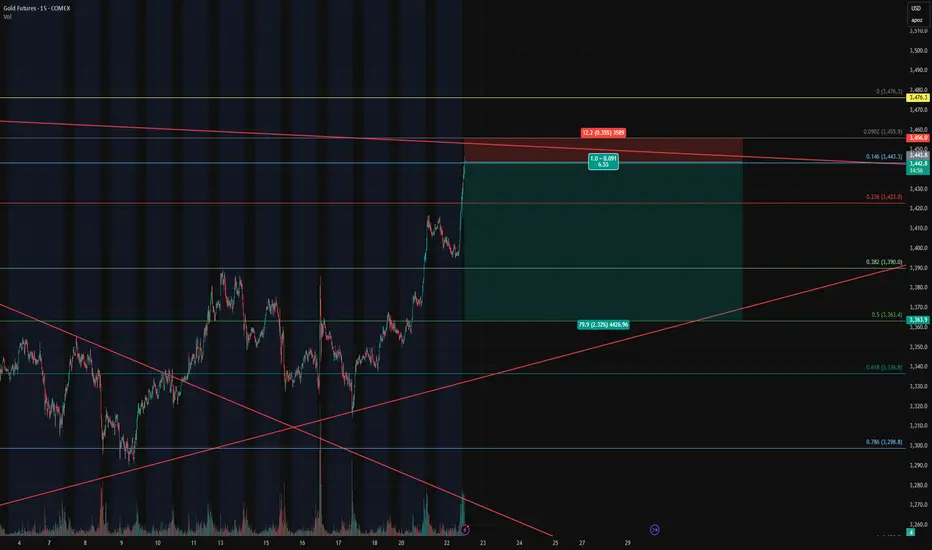
Gold Futures – Closing Longs and Flipping Short at Key Fib🔴 Gold Futures – Closing Longs and Flipping Short at Key Fib Confluence
Instrument : Gold Futures – COMEX ( COMEX:GC1! )
Timeframe : 15-Minute
New Position : Short
Entry Zone : ~3442
Target : ~3362
Stop Loss : ~3458
Risk/Reward : Approx. 6.5+
Setup Type : Reversal from Overextension / Fi
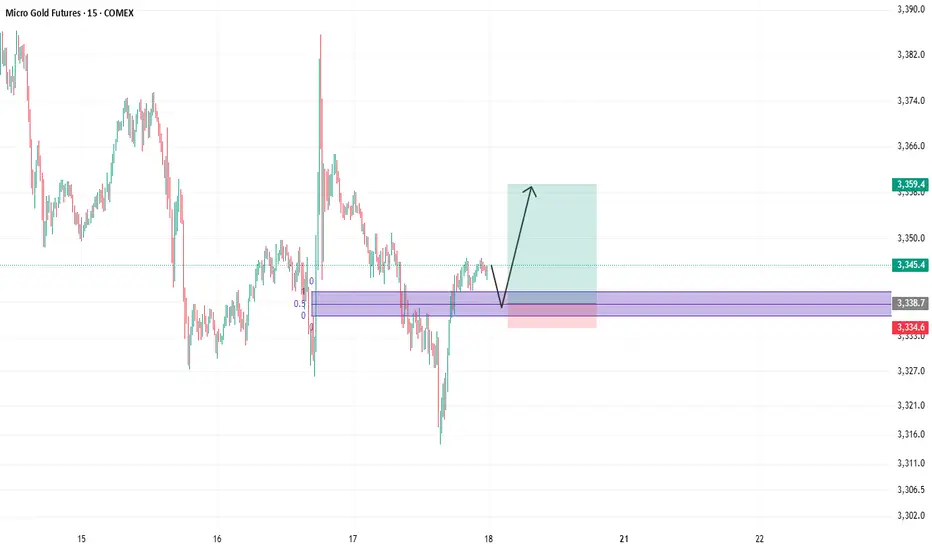
Longing GoldWell, it does look like a good long trade in here.
My confidence is moderate in this trade.
I would say 4 out of 10, this could hit. personally iam going to take this trade but will be more cautious with the amount of contracts that i will be putting on the line.
Gold Bulls Reloading? Smart Money Buys!The technical outlook on XAU/USD shows a well-defined bullish trend, developing within an ascending channel that started in late June. Price recently pushed toward the upper boundary of this channel, reaching a key resistance zone between 3,410 and 3,420 USD, which aligns with a previous supply area
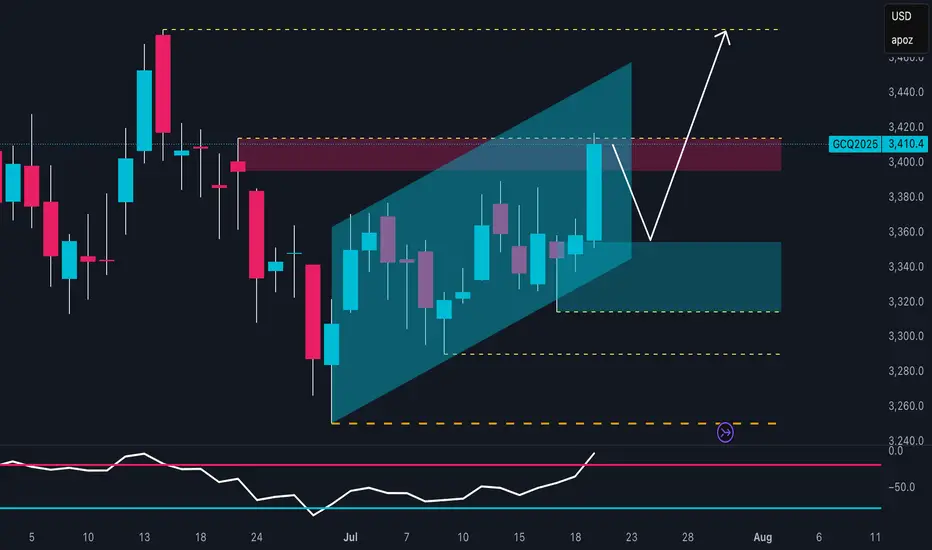
Gold. 14.07.2025. The plan for the next few days.The nearest resistance zones are where it's interesting to look for sales. It's not certain that there will be a big reversal, but I think we'll see a correction. We're waiting for a reaction and looking for an entry point.
The post will be adjusted based on any changes.
Don't forget to click o

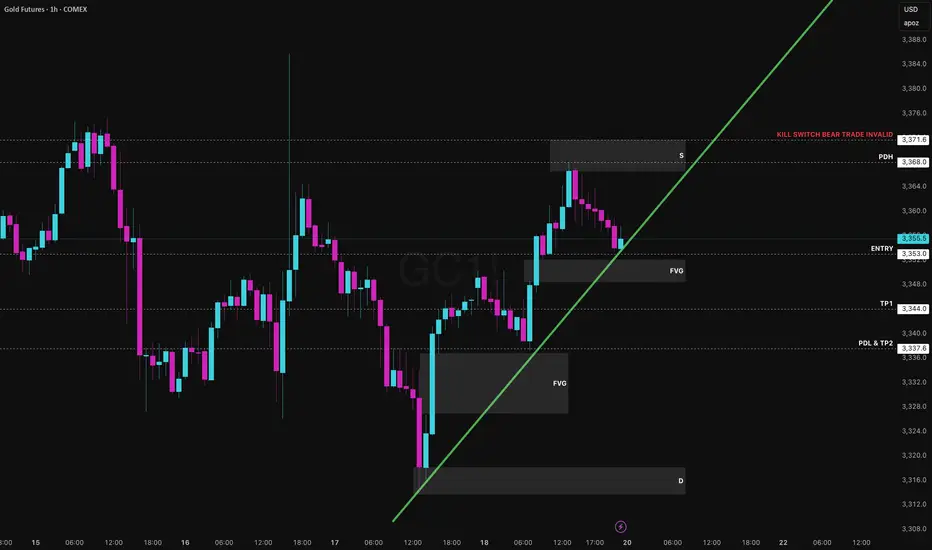
GC Ready to Bleed? This Setup Has Teeth.As we head into the new trading week, GC presents a clean, disciplined short setup developing right below Friday’s key high. Price tapped the Previous Day High ($3,368) and supply zone before rejecting, failing to hold bullish momentum into the weekend close.
The market structure is currently defin
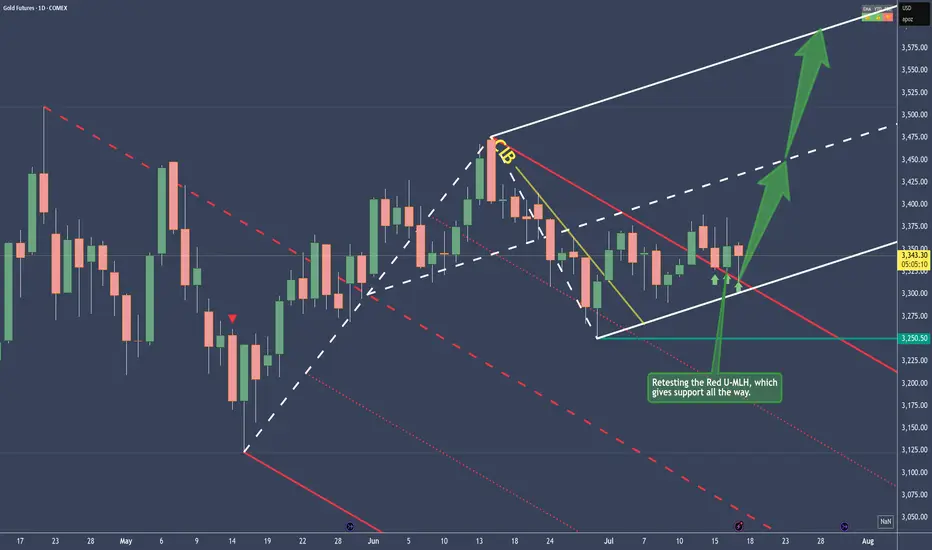
Gold - Bullish and here's whyPrice traveled within the Red Fork, until it broke the CIB Line, which is indicating a Change In Behavior.
From there on, sideways action, until the break of the Red U-MLH happened.
After the close above the Red U-MLH, price has tested it the 3rd time now. At the time of writing, the Bar looks lik
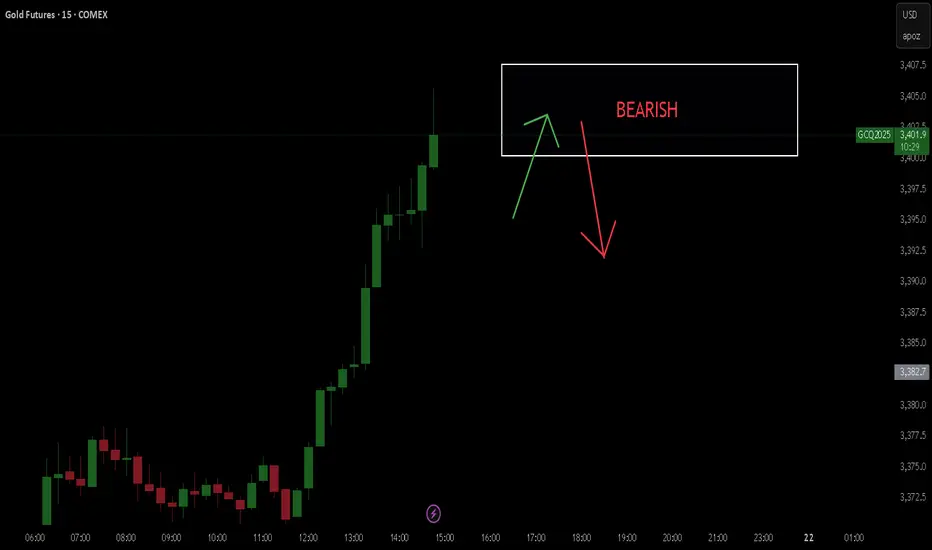
High probability that gold will fallHello,
I hope you're doing well. Here, I'm sharing my analysis of the gold futures market.
Now I see that there's a good chance, about 80%, that it will fall.
See all ideas
Summarizing what the indicators are suggesting.
Neutral
SellBuy
Strong sellStrong buy
Strong sellSellNeutralBuyStrong buy
Neutral
SellBuy
Strong sellStrong buy
Strong sellSellNeutralBuyStrong buy
Neutral
SellBuy
Strong sellStrong buy
Strong sellSellNeutralBuyStrong buy
A representation of what an asset is worth today and what the market thinks it will be worth in the future.
Displays a symbol's price movements over previous years to identify recurring trends.
Frequently Asked Questions
The current price of Gold TRY per gram Futures is 4,617.8 TRY / GRM — it has fallen −0.51% in the past 24 hours. Watch Gold TRY per gram Futures price in more detail on the chart.
The volume of Gold TRY per gram Futures is 52.34 K. Track more important stats on the Gold TRY per gram Futures chart.
Open interest is the number of contracts held by traders in active positions — they're not closed or expired. For Gold TRY per gram Futures this number is 490.95 K. You can use it to track a prevailing market trend and adjust your own strategy: declining open interest for Gold TRY per gram Futures shows that traders are closing their positions, which means a weakening trend.
Buying or selling futures contracts depends on many factors: season, underlying commodity, your own trading strategy. So mostly it's up to you, but if you look for some certain calculations to take into account, you can study technical analysis for Gold TRY per gram Futures. Today its technical rating is strong buy, but remember that market conditions change all the time, so it's always crucial to do your own research. See more of Gold TRY per gram Futures technicals for a more comprehensive analysis.