Performance Audit GC Precision Week (W/E July 11, 2025)This week’s operations focused solely on GC (Gold Futures) with a disciplined structure-first model. Only five trades were executed — all pre-validated, rule-based, and logged. The result: +6.8% portfolio gain, a controlled 1R max risk profile, and no strategy deviation.
No forecasts. No overtrading. Only defined setups and asymmetric execution.
Staakd isn’t about high-frequency noise it’s about data-driven decisions, edge alignment, and position sizing that compounds over time.
Weekly Summary
Trades Taken 5
Wins 4
Losses 1
Win Rate 80%
Avg R/R Ratio 2.1:1
Net R Gained +6.4R
Portfolio Growth +6.8%
Max Drawdown (in-session). < 1R
Strategy Deviation 0%
Overtrading Incidents 0
Context:
Most professional day traders target 1–3% per week. Prop firms often expect 8–10% per month. A +6.8% weekly gain, on just 5 trades with strict risk control, reflects not just profitability — but edge, structure, and execution precision.
Systems Deployed
ORB Breakout Model — NY Open-based volatility extension
Pre-Market Liquidity Sweep Model — Asia Close setups
Supply/Demand with Imbalance Filtering
Session Volatility Overlay — Trade windows confined to high-probability timeframes
All positions were triggered only after full multi-signal confirmation:
▫️ HTF structure validation
▫️ Liquidity mapping
▫️ FVG/inefficiency alignment
▫️ Volume + time-of-day confluence
No trades taken outside predefined protocols. No scalping. No overrides.
Trade Validity Scoring
Entry Logic Precision 91.6%
Setup Integrity 100%
SL Discipline 100%
Journal Compliance 100%
Emotional Bias Detected 0%
The one loss was structurally valid, aligned with bias, and managed with precision. Losses don’t damage equity emotional errors do. None occurred.
Next Week Model Update
Asset Focus: GC (Gold Futures) remains primary
Schedule: Monday–Thursday only (Friday excluded for edge decay)
Sessions: NY Open and Asia Close exclusively
Setup Preference: Structure > Imbalance > Sweep
Trade Limit: 1 per session max
Bias: Continue compounding gains through mechanical execution
Why Follow Staakd?
If you’re tracking setups like a quant not a gambler and you value transparency, discipline, and systems over hype: @stakkd on TradingView Every move is structured. Every result is tracked. No guesswork. Just edge.
XAUTRY1! trade ideas
Gold. The plan for the next few days.The nearest resistance zones are where it's interesting to look for purchases. We are waiting for a reaction and looking for an entry point.
The post will be adjusted if there are any changes.
Don't forget to click on the Rocket! =)

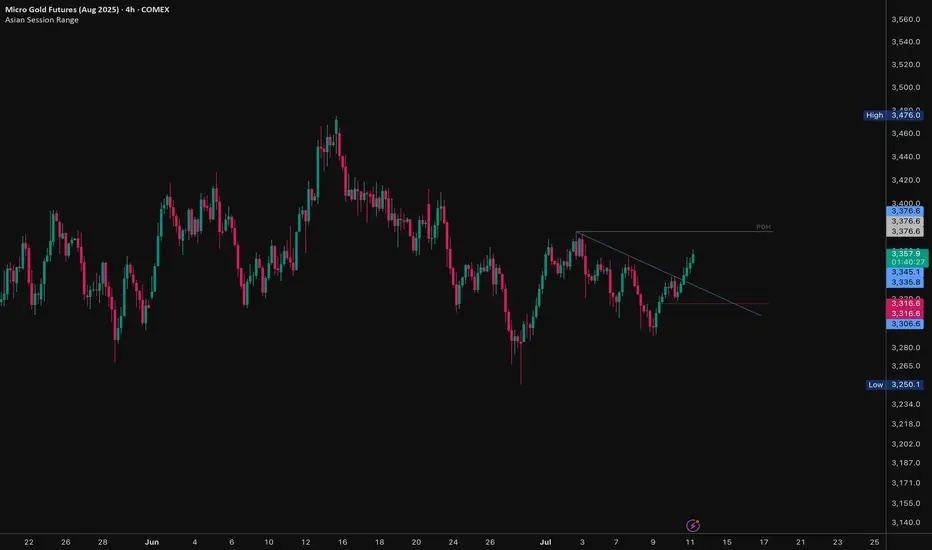
Gold - Watching for Trendline Retest Gold has shown a significant breakout from a recent downtrend resistance line on the 4-hour chart. The price action suggests a shift in momentum, but a potential retest of the broken trendline offers a high-probability entry point.
Technical Analysis:
Trendline Breakout Confirmed: The provided chart clearly shows XAUUSD breaking above a descending trendline that has defined the recent short-term consolidation/downtrend. This breakout indicates a potential resumption of bullish momentum or the end of the consolidation phase.
Immediate Resistance: The price has encountered resistance near the area of the previous daily high (PDH) or a local swing high around 3,376.6. This level will be the immediate target for buyers if the breakout holds.
Potential Retest Zone: A common occurrence after a trendline breakout is a "retest" of the broken resistance level, which now acts as support. The trendline itself and the immediate support levels identified on the chart (e.g., 3,335.8 to 3,316.6) form a potential retest zone.
Trade Idea & Strategy:
The primary trade idea is to wait for a technical confirmation of the breakout by observing a retest of the broken trendline.
Entry Strategy (Bullish Confirmation):
Wait for the price to pull back towards the broken trendline (approximately 3,330 to 3,345 area, depending on the exact slope).
Look for bullish reversal signals (e.g., candlestick patterns like hammers, engulfing patterns, or significant buying volume) at the trendline support.
Enter a long position upon confirmation of support at the retest zone.
Potential Target 1: The recent swing high/PDH area around 3,376.6.
Potential Target 2: If Target 1 is cleared, the high of 3,476.0 (or previous major resistance levels).
Stop Loss: Place a stop loss below the low of the retest candle or below the significant support area (e.g., below 3,300), invalidating the bullish setup.
Alternative Scenario (Bearish Rejection):
If the price fails to hold the trendline support during the retest and decisively breaks back below it, the breakout may be considered a false breakout. In this scenario, the market could revert to the previous downtrend structure.
Disclaimer: This is an analysis for educational purposes and is not financial advice. Always perform your own research and risk analysis before trading.
NY Open PlaybookGold is extended heading into NY, but structure is clean and bullish. We’re sitting above PDH and holding a reclaimed supply zone. If $3,364 holds, we expect continuation toward $3,384–$3,390. If NY rejects at the top, watch for a clean reversion to $3,346 and possibly lower. Key decision level is $3,364.
Key Levels
PDH - $3,359
Previous day high (currently holding above)
PDL - $3,310
Previous day low
Displaced HVRA - $3,346 – $3,350
Reclaimed supply → demand (buy zone)
FR Demand Block - $3,324 – $3,335
Fair range support if trend fails
Primary HVRA - $3,372 – $3,384
Main target / short trigger zone
ATE Extension - $3,390+
Final bullish extension target
Bullish Scenarios
(b]Reactive Long
Entry: $3,346 – $3,350
SL: $3,343 (aggressive) or $3,339 (safe)
TP1: $3,364
TP2: $3,372
TP3: $3,384
Momentum Breakout Long
Trigger: Break + hold above $3,364
SL: $3,358
TP1: $3,372
TP2: $3,384
TP3: $3,390+
Bearish Scenario
Rejection Short
Entry: $3,372 – $3,384 (on wick/failure)
SL: $3,390
TP1: $3,358
TP2: $3,346
TP3: $3,335
Direction is binary at $3,364. Whether we rotate down or extend up, both plays are valid execute with discipline, not bias.

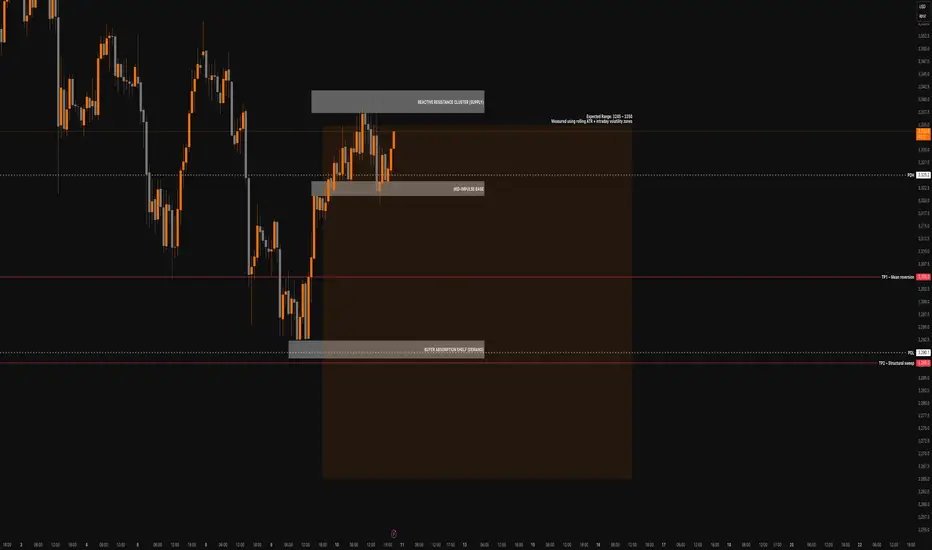
Gold Futures Short Bias Into NY CloseGC is stalling beneath the 3330–3336 resistance cluster after failing to break out during NY session. Price rejected the fair value gap (3312–3318) and is now compressing just above the mean-reversion anchor (LWN). There’s no momentum reclaim from buyers, and structure suggests weakness into Friday.
We’re positioning short into expected downside continuation.
Key Levels
Reactive Resistance Cluster: 3330–3336
FVG (rejected): 3312–3318
Mean-Reversion Anchor (LWN): 3290–3300
Absorption Shelf (Target Zone): 3275
PDH/PDL (provisional): 3325 / 3280
VWAP: Flattened, near 3302
Short Setup (Active)
Entry: 3332
Stop: 3340
TP1: 3305 – Mean reversion
TP2: 3288 – LWN sweep
TP3: 3275 – Absorption shelf
Staakd Setup: 1:5.7 R:R to final target
Bias confirmed by rejection from inefficiency and absence of buyer follow-through
QM Probabilities
Bear Move 60–65% Structure favoUrs continued rejection + flush to 3275
Bull Move 35–40% Requires reclaim of 3318 + aggressive close above VWAP
Range/Flat Possible pre-close Tight range unless displaced overnight
Staakd Bias:
Structure is holding beneath resistance. Without a reclaim of 3318, we remain short-biased into Friday with eyes on 3275. Probability favours continuation unless buyers reclaim initiative fast.
Follow for post-close recap and updated levels ahead of Friday's NY open and we hope your trades worked out how you expected today.
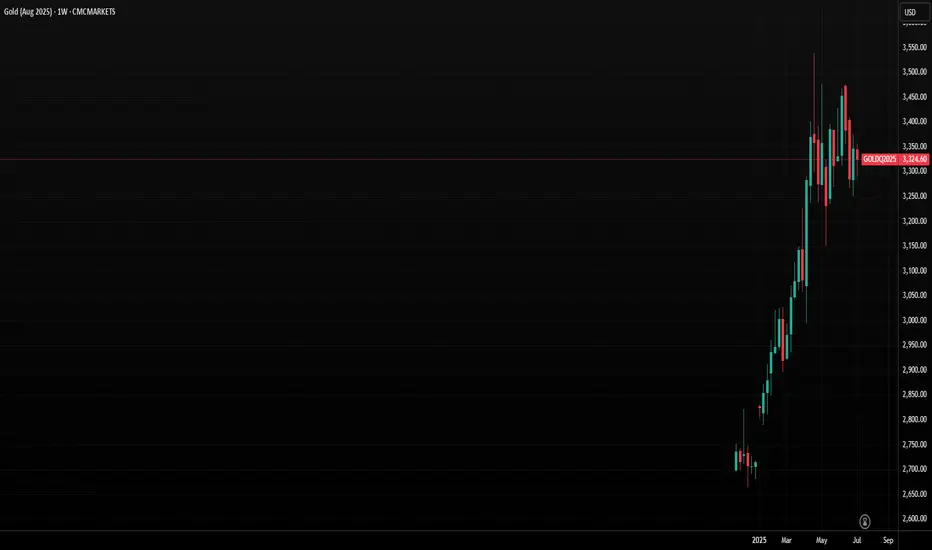
Gold at Critical Juncture as Bearish Momentum GrowsGold is showing signs of breaking down as the US dollar recovers from a steep decline. Gold and the dollar typically have an inverse relationship over the longer term. The precious metal has been trading sideways since April, but more importantly, it has been trending lower since mid-June. Gold is now approaching a critical juncture, testing an uptrend established in mid-May. Although it has previously held this support level, gold appears likely to break lower this time.
The Trend Lower Is Strengthening
The Relative Strength Index (RSI) is now trending steadily lower, forming a series of lower highs. This suggests that gold’s momentum is currently bearish, indicating potential for continued weakness in the days ahead. To reverse this bearish momentum and shift to a bullish outlook, the RSI would need to rise firmly above 50.
More significantly, gold is now very close to breaking a significant uptrend at $3,300, which was previously tested on June 27 and June 30. On both occasions, the price dipped intraday below this trendline but managed to close above it. The trendline was retested on 8 July, initially holding, but gold is dipping below this critical support level again on 9 July. A close below the trendline on July 9, followed by continued declines starting on July 10, would confirm that the uptrend has broken. This breakdown would signal further downside risk, with initial support at $3,230, followed by $3,170.
Triple Top
Perhaps even more crucially, a triple-top pattern established at the $3,400 becomes increasingly likely each time gold trends lower. The $3,170 support level is particularly significant because it forms the neckline of this triple-top pattern. A decisive break below $3,170 would confirm the triple top pattern and indicate a deeper decline, potentially targeting the range between $2,950 and $3,000.
Written by Michael J. Kramer, founder of Mott Capital Management.
Disclaimer: CMC Markets is an execution-only service provider. The material (whether or not it states any opinions) is for general information purposes only and does not take into account your personal circumstances or objectives. Nothing in this material is (or should be considered to be) financial, investment or other advice on which reliance should be placed.
No opinion given in the material constitutes a recommendation by CMC Markets or the author that any particular investment, security, transaction, or investment strategy is suitable for any specific person. The material has not been prepared in accordance with legal requirements designed to promote the independence of investment research. Although we are not specifically prevented from dealing before providing this material, we do not seek to take advantage of the material prior to its dissemination.
Bearish Rejection from SupplyDuring the NY session open, Gold (GC1!) broke above the 30-min ORB high at 3335.8, briefly entering a known supply zone (3342–3345). The move lacked follow-through and immediately reversed — signalling a liquidity sweep and classic NY session trap setup.
This invalidates the bullish breakout and supports a short-biased play back toward the ORB low and into deeper demand.
Trade Details:
Entry: 3336.0 (short after failed breakout + rejection candle)
Stop Loss: 3342.0 (above the supply zone high)
Take Profit 1: 3327.1 (ORB low)
Take Profit 2: 3320.0 (prior demand zone)
Take Profit 3 (optional): 3315.0 (liquidity void fill)
Risk:Reward: ~1:1.3 to TP1, ~1:2.2 to TP2
Position Type: Short
Execution Time Frame: 5-min/15-min
Model Tags: Liquidity Sweep, NY Session Fade, Supply Rejection
🔍 Quant Notes:
Price action exhibited a false breakout — NY session opened with an expansion move above ORB high, which was immediately rejected.
Re-entry into the ORB range confirms buyer exhaustion and makes a move back to the ORB low highly probable.
Bearish bias is reinforced by multiple upper wicks, supply zone rejection, and failed structure reclaim.
Key Confirmation:
Bearish engulfing or strong close back below 3335
Failure to reclaim EMAs or trend line
Momentum shift on 5-min with volume divergence
Closing Thoughts:
A failed ORB breakout into supply during NY open is a classic trap — and today’s price action on GC1! fits the model. This short setup targets the full ORB range retrace with potential continuation if sellers hold control.

Gold Trade Setup – Long Invalidated, Watching Retest for ShortGold has been consolidating between $3,200 and $3,500, recently pressing against a descending resistance line that has rejected price several times. I was favoring the upside, but our long setup was invalidated — the stop loss at $3,330 was hit.
Price is now retesting ascending support, and I'm shifting focus to a short opportunity, using our previous long entry level (~$3,333) as a key area of interest for entries.
Here’s the updated plan:
Short Entry: Around $3,333
Stop Loss: $3,340
Take Profit: $3,303
Remaining cautious but opportunistic — the larger structure is vulnerable and could break further if support fails.

Gold Trade Setup – Watching the BreakoutGold Trade Setup – Watching the Breakout
Gold is currently consolidating between $3,200 and $3,500, with price action now pressing against a descending resistance line that has triggered multiple rejections in the past. We’re approaching a key decision point.
I'm favoring the upside in this setup — the momentum and structure suggest a potential breakout — but I fully recognize the downside potential and want to be prepared for both scenarios. Tight risk controls are key here.
Here’s how I’m positioned:
• Long Entry: Around $3,333
- Stop Loss: $3,330
- Target: $3,363 (looking for this level to be reached by end of day)
• Short Entry: Around $3,336
- Stop Loss: $3,340
- Take Profit: $3,303
The structure could resolve sharply in either direction, so I’m staying nimble and reactive.

GoldI am the best Trader in the World !
Even if other many professional traders says that Gold will go up , I am here to tell you No ! the Gold will very soon Collapse more than 11% !

Sell GC based on 15M bearish unicorn breakerGC swept previous day high, 4h high during London open. It reversed sharply making 15M bearish change in state of delivery (CISD) and moving through 15M breaker and forming 15M FVG. Nice ICT unicorn breaker!
I have my sell limit placed at the low of 15m FVG. Will be targeting RR 1:2.


Early impulsive action got me active! This was a move I was looking to happen yesterday but got slapped trying. It just rocks out like that some time and you have to wait for the next opportunity. In this move early and looking for it to continue if it can hold well above yesterdays high. Trailing stop with every 50 ticks cause anything can happen turning price around and I dont want to give to much back.

Gold Potential Bullish Break Showcasing Loxx's HandiworkNo surprise that bullish momentum is clearly evident on the Monthly & Weekly time frames with Higher timeframe hulls sloping on the M W D charts
What is interesting is how Loxx's PAARSX indicator, on the daily timeframe, clearly shows
a dark blue cycle downwards while price consolidates (yellow boxes under the price action)
providing us with hidden bullish divergence and another potential breakout very similar to the previous 2 ledge and wedge patterns.
Adaptive-Lookback Stochastic Top & Stochastic of Two-Pole SuperSmoother
Bottom show some solid daily historical entries. I can only imagine the 4 hour chart entries look just as profitable and enticing
This trader will be going long soon

Extremely bullish on gold I am long Gold, 1hr breaker after attacking sellside mutiple times, dxy is correcting right now as well. its wednesday so we could see mid week reversal, we also have equal highs. We are also inversing a 1hr fvg (RED) which adds confluence with the breaker. solid setup, invalidation is 3303 and tp is 3372.

GOLD Breakout likely above 96550MCX:GOLD Breakout is in making. Confirmed with OI analysis.
Short position must have Strict SL at 96550.
Rally can push gold towards 97K++

Retail trapped. Volume confirmed. Liquidity targeted.🔻 We are in a highly reactive zone where emotional long entries and early short SLs create perfect liquidity magnets.
🔍 Key Levels & Zones:
• Early Short SL Zone → 3337.2
• Retail FOMO Entry Block → 3251.9
• Volume-based Rejection Point → 3392.0 (SL/TP sweep)
• TP1 & TP2 Zones → 3251.9 / 3208.0
• Bonus TP → 3159.9 → Complete sweep of long SLs and demand exhaustion
• Final Trap Exit Zone → 3157.4 — Institutional reload zone
💡 Volume confirms this cycle of:
• Trap > SL hunt > Emotional entry > Volume fade > Dump > Accumulation > Reversal
🧠 This is NOT financial advice. I post to share deeper insight into manipulation mechanics & sniper-level liquidity structure analysis.
If you’re still trading candles, you’re playing retail games. Start seeing the architecture.
🧷#XAUUSD #SmartMoney #LiquiditySweep #VolumeStrategy #TradingPsychology #RetailTrap #SniperMindset

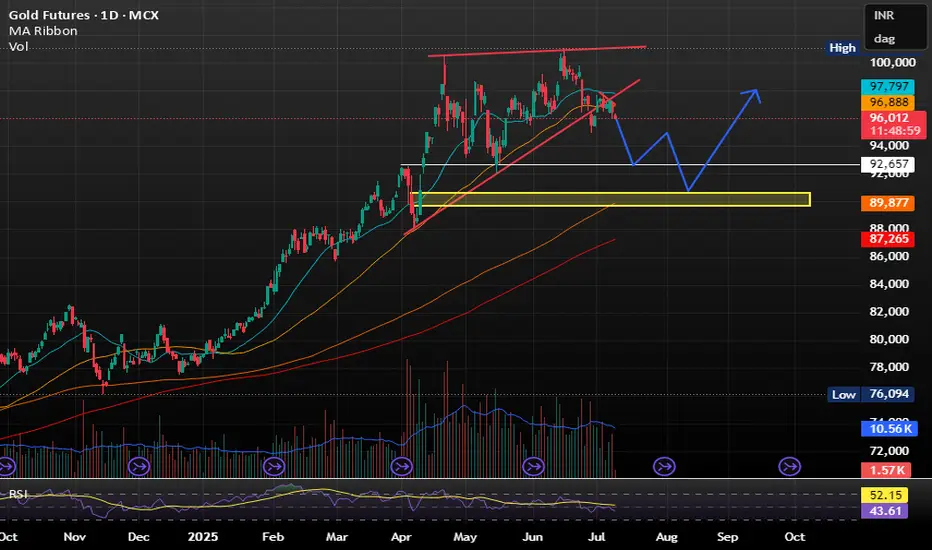
Gold MCX Bullish MoveGold as long as it is staying above the ichimoku cloud it can show a bullish move from here within a few days.. this month we can expect some movement on the upside clearing highs.
Stop loss can be kept near 94700-95300 levels with target of 102000 - 105000 with this month.

Shorting gold again Well, it does look like there is still some room for a short trade that might actually hit.
Personally, iam not 100% confident in this trade, but i would have liked to see more confirmations before taking the short entry, yet still i think it is still worth the risk.
if you want more confirmations then here is the thing, wait the price to close below this yellow line, and i mean a close not a wick, then wait the price to pullback and take a short position.
my confidence in this setup is 6 out of 10.

Compression Structure at Key Inflection PointDescription:
GC is currently trading within a high-probability inflection zone defined by confluence between structural demand, a well-defined fair value gap, and multi-timeframe descending trend line resistance. The asset is compressing between key volume thresholds and macro trend lines, presenting a binary scenario with favourable asymmetry in either direction.
Context & Market Structure
Chart Basis: 4H
Instruments Used:
GC1! (COMEX Gold August 2025 Futures)
20 & 50 EMA for short-term dynamic structure
Manual markups: S/D zones, FVGs, trendlines
Session Data: NY session highs/lows (previous day)
Key Technical Elements
Descending Trendline (Macro):
Initiated from swing high on July 5th, currently acting as dynamic resistance. Confirmed via 3+ touchpoints. Linear regression indicates slope remains intact.
Rising Trend line (Structural Support):
Originates from June 26th low supporting current bullish attempts. Intersection with demand and session low adds weight to this level.
Demand Zone (3280–3286):
Structurally valid with absorption wicks and bullish reaction. Volume clusters indicate localized buyer interest. Rejecting this zone twice already.
Fair Value Gap (FVG) (3297–3304):
Formed post-impulsive leg. Statistically, ~78% of FVGs in gold futures are filled within 2 sessions when no continuation candle follows which is the current setup.
Supply Zone (3314–3318):
Defined from previous consolidation pre-selloff. Aligns with ORB high + unfilled inefficiency, creating layered resistance.
Previous NY Session Levels:
High: 3310.0
Low: 3277.5
Price trading midpoint of this range increased probability of expansion after compression.
Scenario Mapping
Bullish Scenario:
Trigger: Break and 15-min hold above 3305
Validation: Acceptance into FVG zone + reclaim of previous session high
Target: 3316–3320 (supply zone + inefficiency fill)
Extended Target: 3334 swing high (mean reversion area)
Bearish Scenario:
Trigger: Breakdown below 3277.5 session low
Validation: Failure to reclaim demand zone; increased volume on breakdown
Target: 3250 (local HVN & previous accumulation node)
Extended Target: 3227 structural low (trend continuation)
Bias Model:
Volatility Compression: 3-day ATR declining; tightening range.
Mean Reversion Probability (MPR): 58% if price returns to mid-FVG before rejection.
Expansion Probability (EXP): 64% post-session high/low sweep.
Trend Alignment Bias: Bearish until > 3305 is sustained. Below 3280, short bias accelerates.
Summary:
GC1! is currently in compression between confirmed demand and a clean FVG/supply stack, with trend lines boxing in price from both directions. A breakout from this tri-zone structure is statistically likely in the next session. I remain neutral-biased with actionable directional triggers above 3305 or below 3277.
Not a market to guess, wait for confirmation. High-quality setups require patience at the edge of structure.
Staakd Rating: ★★★★☆ (4.6/5)


Gold Eyes Recovery From $3,269 Support ZoneGold dropped 0.65% to trade around $3,290.0, resuming its bearish bias. Immediate support rests at $3,269.1, backed by anchored VWAP. The bullish view holds above this level, aiming for $3,348.9.
A close below $3,259.1 would expose the $3,150.8 support.

GOLD IS MELTING LIKE A ICEGOLD IS MELTING LIKE A ICE -
Trading below 20SMA and 50SMA making it less attractive at current price level.
ALSO RELATIVE STRENGH IS WEAKNING .
As per my view Sell on rise will be profitable for short term .
DOWNSIDE TARGET SHOULD BE WITHIN 92000 TO 90000 .