Palladium's missile is ready for deployment to tag all-time highThis is a hot trading opportunity as price could retest the all time high.
+45% from the current level
XPDUSD1! trade ideas


Palladium, Atypical potential LONG Atypical unbalance in Palladium Cot report
Long Positions shows total unbalance situation,
at 582K advantage against short
Watch out potential unexpected rocket Rally
(Re-balance of March 9th trough)

PALLADIUM: STILL 298 DROP POINTS !!
Descending channel forming a five-wave corrective zig zag with projection at 161.8% fibo and price level target: 1651.5

Palladuim futurethe markets now in down trend .
you can buy if the market break blue line with high candle . now you can do nothing

Quickpost: Palladium Futures looks hella bearishI am constantly looking for trend lines to flip from resistance to support and we are finally seeing that right now. The rising blue trend line frustratingly set a higher high with the blue trendline acting as resistance for three retests.
The purple trendline is beginning to assert itself as resistance;
due to the hidden bearish divergence on the MACD histogram I don't suspect we will see as many tests of the purple trendline as we see of the blue;
Also, the MACD looks primed to cross the signal bearishly.
Further that:
Volumewise we can see that there is almost no volume to this rally. The three day chart simplifies some of the variation in the volume and gives a clear picture of the OBV EMAS.
The low daily volume suggest a big move is coming,
the OBV EMAs are about to have a bearish cross with of the 10 and 20 EMAs.
The Volume Profile, Visible Range, shows that the Value Area was supporting the price action and now is acting as resistance.
The next move according to basic VPVR strategies is a move to the point of control, one of the High Volume Nodes, or the lower limit of the value area.
in general this is important because during the Great Recession palladium pumped and dumped as a leading indicator of a broader financial problem. In the past the S&P has dumped as Palladium exhausts a few weeks later, but here they appear to be getting gassed at the same time (SPX is tracking highs)

PALLADIUM FUTURES (PA1!) DailyDates in the future with the greatest probability for a rice high or price low

PALLADIUM FUTURES (PA1!) WeeklyDates in the future with the greatest probability for a price high or price low

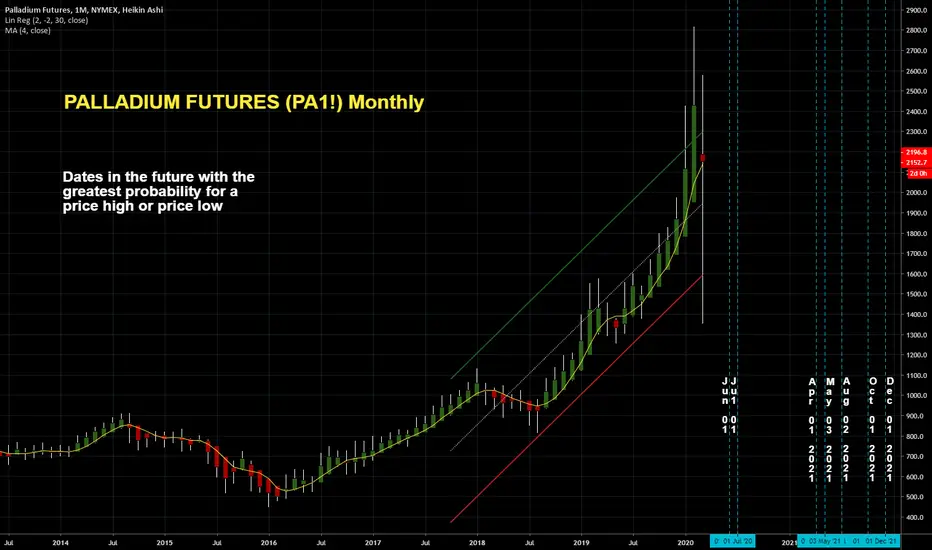
PALLADIUM FUTURES (PA1!) MonthlyDates in the future with the greatest probability for a price high or price low


Silver, Gold and now Palladium !Hey guys, your favorite bear is today interest buy the case of palladium !
Palladium shows signals of accelerated parabolic phase which tends to confirm a bubble market.
Let's recap the state of the precious metals market :
- Silver is in crash phase.
- Gold in an advanced bearish consolidation.
- Palladium in a bubble market.
Technicals indicators :
Price is well overextends over 200, 55, 21 and even over 7 monthly EMA : this is a strong signal of bubble.
RSI shows overbought conditions on monthly chart and bearish divergences on weekly and daily.
TD Sequential gives us a perfect daily 9 candlestick which implies a potential correction.
DISCLAIMER : I'm not financial advisor. I'm doing it for my own entertainment. You are responsable for your losses because you trade at your own risk.
PLEASE KEEP SHOWING ME YOUR SUPPORT : LIKES and follows are very HELPFUL.
Feel free to comment, share and follow for receive more informations.
Cheers !

$PA1! Palladium futures has hit the PRZpalladium futures has hit the PRZ of our bullish cypher harmonic pattern
target is the .618 gap fill off of harmonic, stop below the (X)


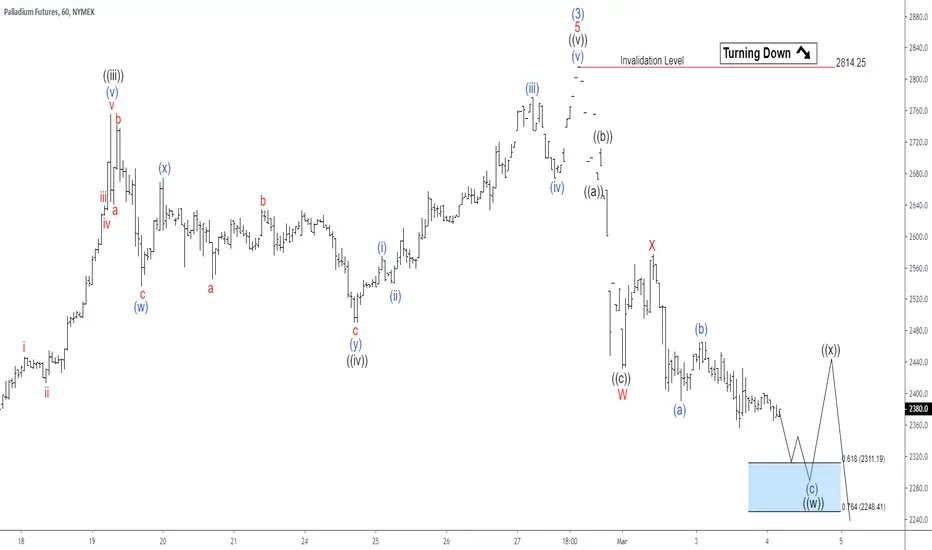
Elliott Wave View: Palladium 7 swing Correction In ProgressShort term view suggests the rally in Palladium to 2814.25 ended wave (3). The wave (4) decline in Palladium is currently in progress to correct cycle from May 13, 2019 low before the rally resumes. Internal of wave (4) is unfolding as a double three Elliott Wave structure. Down from Feb 28, 2020 high (2814.25) , wave ((a)) ended at 2610.1 and bounce in wave ((b)) ended at 2740. Wave ((c)) lower ended at 2387.30 which completed wave W of the double three.
Afterwards, the metal ended the rally in wave X at 2576.9. It has resumed lower and broken below wave W at 2387.3 suggesting the next leg lower has started. Down from wave X high at 2576.9, wave (a) ended at 2391 and wave (b) bounce ended at 2465.10. Expect Palladium to extend lower towards 2248 – 2311 area to end wave ((w)), then it should bounce in wave ((x)) to correct cycle from March 2 high in 3, 7, or 11 swing before turning lower again.
The potential target for wave Y of (4) can be measured as 100% – 123.6% Fibonacci extension of W-X which comes at 2045 – 2146. This area, if reached, can see buyers for further upside or 3 waves bounce at least. We don’t like selling the proposed decline due to the bullish trend in the higher degree.
Long Palladium on pullbackLong term uptrend in pullback. Looking to enter here with stops under support. Looking for trend continuation

Palladium (PA1!) short.All description on the chart.
Please, don't forget to like and follow.
Thank you.


Palladium Technical Breakout 2020-02HVF measured move places target price to ~$2900.
This measured move idea is invalidated if we have a weekly candle close below ~$2300.

SMS Strategy - Palladium Stop Moving UpOur SMS Strategy remains long Palladium from 1936.50 on 1/3/20. Stops are moving up below recent support levels at 2171.30.

Weekly game plan 16 February 2020 - PalladiumWell, the Eye of Sauron is no more :(
Starting to look like a pennant setting up for a trend continuation.

Weekly game plan 9 February 2020 - PalladiumThey Eye of Sauron!!
It's basically just a topping pattern that we've seen has the power to burst bubbles.

Palladium (PA1!) short.All description on the chart.
Please, don't forget to like and follow.
Thank you.
