BIST30 (USD) Monthly: Head & Shoulders Confirmed? Neckline RetesType: Bearish
The Turkish Stock Market (BIST30 or XU030), when viewed in US Dollar terms on the monthly chart, presents a textbook Head and Shoulders (H&S) topping pattern.
We can observe the Left Shoulder, a higher Head, and a lower Right Shoulder, indicating waning bullish momentum at the peak o
About BIST 30 Index
The Borsa Istanbul 30 Index also referred to as BIST30 is a capitalization-weighted index of top 30 companies listed in the Istanbul Stock Exchange with the highest market value. Companies listed are from various sectors, the leading sector of the BIST30 is banking with 32.5%, leading companies are Garanti Bankasi A.S. with 10.69% volume and Akbank T.A.S. with only 0.68% behind the leader.
Related indices

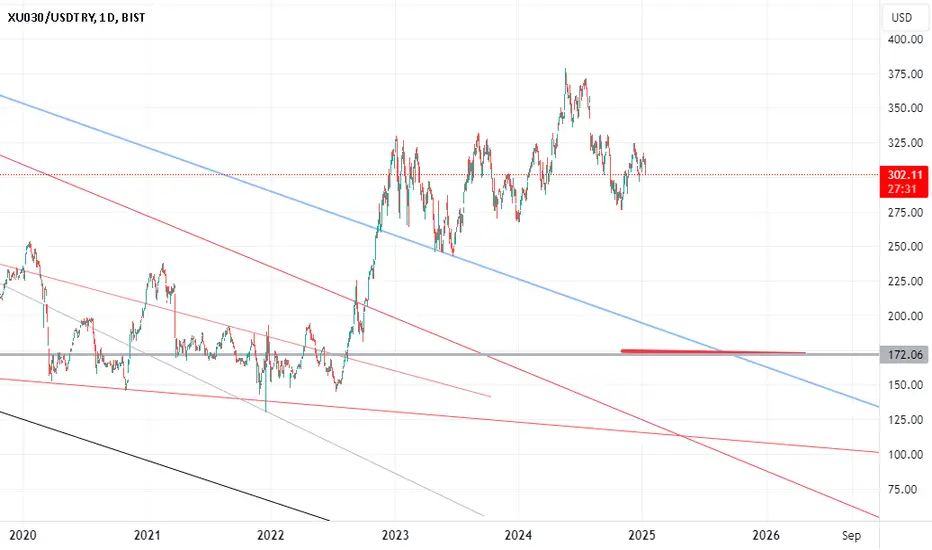
BIST30 (XU030) - 1 DThe corrective move in the BIST30 index, which began in July 2024, has completed the first two legs of a three-wave structure and is currently unfolding the final downward leg. While the overall pattern appears to be a classic flat (regular) correction, the possibility of it evolving into a WXY comp

Maybe it is a good time to pair trade THYAO against LufthansaIt is not maybe. It is a good idea to sell THYAO's future contract short and buy Lufthansa stock.
Trading the THYAO on futures is also a good idea at a time when rates need to go lower. This way, traders can sell the THYAO short and lend the TRY at a higher rate.

XU30 on a major resistence log XU30 is on a major resistence.
This resisitence worked over years.
it may go down for a while. resistence is pretty strong


XU030 - BIST30 SELLIf you think my analyzes are successful and meaningful, please contribute by commenting and liking.


Yukarı kırdı yükseliyor.Tam alma vakti.Şimdi al. Tam alma vakti.Şimdi al. Tam alma vakti.Şimdi al Super economy is coming.
1. Inflation started to fall.
2. Oil prices began to fall very quickly.
3.Metals are falling.
4. The stock market will continue to break new records.
Halil ÖLMEZ
Dec 21
Comment: Happy New Year. I

See all ideas
Summarizing what the indicators are suggesting.
Oscillators
Neutral
SellBuy
Strong sellStrong buy
Strong sellSellNeutralBuyStrong buy
Oscillators
Neutral
SellBuy
Strong sellStrong buy
Strong sellSellNeutralBuyStrong buy
Summary
Neutral
SellBuy
Strong sellStrong buy
Strong sellSellNeutralBuyStrong buy
Summary
Neutral
SellBuy
Strong sellStrong buy
Strong sellSellNeutralBuyStrong buy
Summary
Neutral
SellBuy
Strong sellStrong buy
Strong sellSellNeutralBuyStrong buy
Moving Averages
Neutral
SellBuy
Strong sellStrong buy
Strong sellSellNeutralBuyStrong buy
Moving Averages
Neutral
SellBuy
Strong sellStrong buy
Strong sellSellNeutralBuyStrong buy
Displays a symbol's price movements over previous years to identify recurring trends.