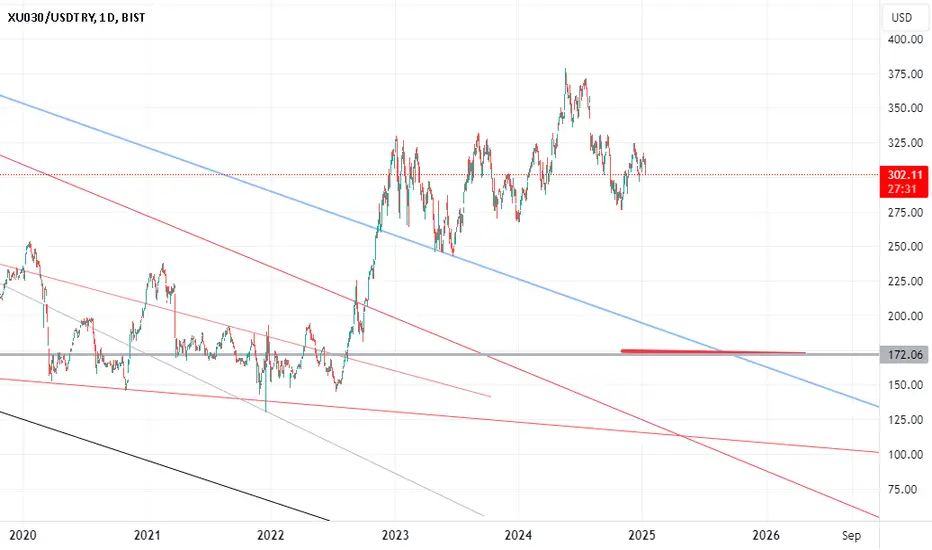
BIST30 (USD) Monthly: Head & Shoulders Confirmed? Neckline RetesType: Bearish
The Turkish Stock Market (BIST30 or XU030), when viewed in US Dollar terms on the monthly chart, presents a textbook Head and Shoulders (H&S) topping pattern.
We can observe the Left Shoulder, a higher Head, and a lower Right Shoulder, indicating waning bullish momentum at the peak of what has been a significant rally.
The fact that this pattern is forming on the monthly timeframe underscores its long-term significance, suggesting a major structural shift rather than just a short-term correction.
The Neckline Break & Retest:
Crucially, the BIST30 (USD) has recently broken below its multi-month neckline, a key support level that connected the lows between the shoulders and the head. This breakdown served as the initial confirmation of the H&S pattern.
What we are witnessing now is the classic retest of this broken neckline. Price has rallied back towards this former support, which now acts as strong overhead resistance.
This retest often provides a 'last kiss goodbye' before the larger bearish move unfolds.
The market's reaction at this retest level will be paramount. A strong rejection from the neckline, potentially accompanied by increasing bearish volume or bearish candlestick formations on lower timeframes (e.g., weekly), would further validate the H&S breakdown and strengthen the bearish outlook.
Potential Price Target:
Based on the classic H&S methodology, we can project a potential price target. By measuring the vertical distance from the peak of the 'Head' to the neckline and projecting it downwards from the breakdown point, we derive a preliminary bearish target around 220 USD for BIST30 (XU030)
XU030 trade ideas

BIST30 (XU030) - 1 DThe corrective move in the BIST30 index, which began in July 2024, has completed the first two legs of a three-wave structure and is currently unfolding the final downward leg. While the overall pattern appears to be a classic flat (regular) correction, the possibility of it evolving into a WXY complex correction—albeit less likely—still remains valid. I anticipate that this correction will conclude with one final leg to the downside. Both time-based and price-based target levels have been marked. In my assessment, the likelihood of the correction ending within the initially identified support zone is higher than the probability of a deeper retracement.

Maybe it is a good time to pair trade THYAO against LufthansaIt is not maybe. It is a good idea to sell THYAO's future contract short and buy Lufthansa stock.
Trading the THYAO on futures is also a good idea at a time when rates need to go lower. This way, traders can sell the THYAO short and lend the TRY at a higher rate.

XU30 on a major resistence log XU30 is on a major resistence.
This resisitence worked over years.
it may go down for a while. resistence is pretty strong


XU030 - BIST30 SELLIf you think my analyzes are successful and meaningful, please contribute by commenting and liking.


Yukarı kırdı yükseliyor.Tam alma vakti.Şimdi al. Tam alma vakti.Şimdi al. Tam alma vakti.Şimdi al Super economy is coming.
1. Inflation started to fall.
2. Oil prices began to fall very quickly.
3.Metals are falling.
4. The stock market will continue to break new records.
Halil ÖLMEZ
Dec 21
Comment: Happy New Year. I want to see you all happy and peaceful. I love you all.

#viop30 #bist30As you see take profit points on chart. Don’t you think it’s time for take your profit and escape bear teeth?
BIST:XU030DZ2021


20September10000@DJI20September10000@DJI
dünyanın
en büyük endeksi
tarihini belirler bütün
borsa endeksleri
Dow Jones Industrial'i
tıpatıp takip ederler.
A bear market begins! Until the 20th of September


16March28888@DJI16March28888@DJI
16 mart dünyanın
en büyük endeksi
tarihini belirler bütün
borsa endeksleri
Dow Jones Industrial'i
tıpatıp takip ederler.

BIST30 Short Term - could go both waysResistance 1655, Support 1580. To enter LONG, lets see one or two days closing above 1655. Stay calm

XU030 longthis is my weekly analysis of XU030. We might be a part of the 5th blue way. after correction of blue way, brown way (big picture) 5th way may start. This might be the last upward move of this year. Then I expect sharp declines in the market. Anyway, enjoy watching this movie at the moment


BIST30 un önü açık Günlükte 1588 test edilmemiş direnç olarak kabul edilebilir. Destek olarak 1546 ilk destek ve 1509 seviyesi test edilmiş destek olarak görülebilir. Yatırım tavsiyesi değildir. Öğrenme amaçlı çalışmadır.


BIST30 FUTURES CONTRACT SHORT TERM LONGInevidently imposing a decline after this panting climb, since the pattern most likely to be a Bearish Harmonic Pattern (a declined Gartley, emerging Bearish Crap...) So many allusions to a new peak although fundamentals are hiding big questions...
