XU100 trade ideas

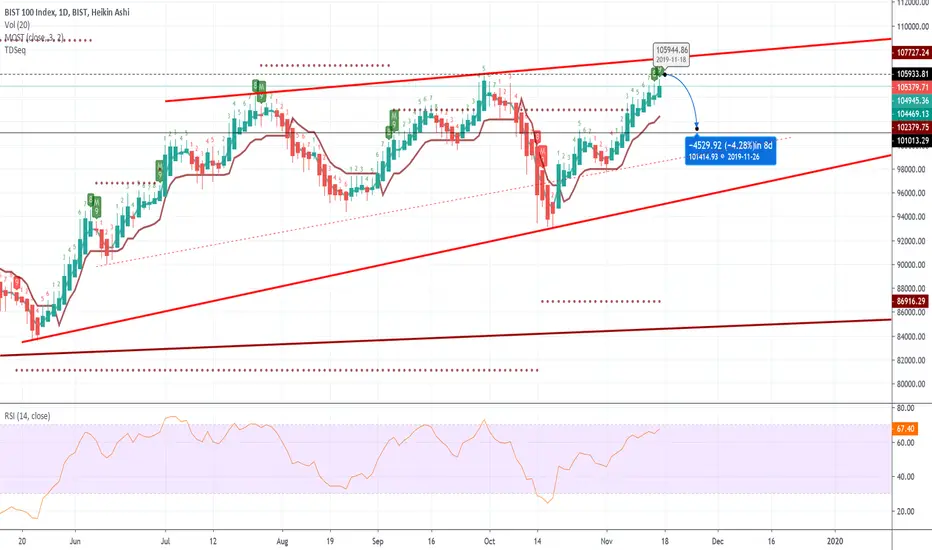
BIST100 FORECAST & TECHNICAL ANALYSISMarket break the resistance and waiting for small pullback for confirm .I expect that ,market will continue to uptrend with small pullbacks.


XU100- Possible Reverse Head&ShouldersTurkish stock index BIST 100 seems like forming a reverse head and shoulders formation.
Target of this formation is first 88.500 which is the height of shoulder, and than 86.000 which is the height of head.
After completing this move, a great opportunity is to buy this index because prior to this correction, prices were around 120.000. For the last 20 years annual increase rate of this index is around 24%

XU100 BIST100 Head&Shoulders FormationWe can see the head&Shoulder formation hapenning on Turkish Index 100 (Bist100).
Targets of this formation is;
- 99840 and than 99110 relatively.
Increase in the USD/TRY ratio is approving this formation.

Xu100 DailyOn technical side,
1) There is a trendline which stands for 102.000 level support. If the price produces a round to this level,it may complete head and shoulder formation.
2) The major support line stands for 100.000 level. There is 50 day MA around this level. Index may find its boost from these levels.
Also,
Wolksvagen planted its first fabricate to Manisa Turkey. Very good news for Index.


Xu100, bist100Kisa vade on gorumuz siyah yuvarlak icindeki destekler calismassa bir muhdet beklemede kalmak mantikli .

BIST100 PRICE INDEX WAVES OVER 100MA & USD/TRY FLIPSBIST100 PRICE INDEX WAVES OVER 100MA & USD/TRY FLIPS
According to this idea. Buying BIST100 under 100MA and fliping to USD/TRY over 100MA seems logical ;)
This is not a trading advice.

Tomorrow BIST100 may bounce back from support Downtrend line started in July 30th (orange) is still working neatly. Second time value touched to orange resistance on August 8th, steep downfall has been started. Now 96069 is a very important support. I think that support will stand still against the fall and bounce the value upwards. Tomorrow we can see just a little bit more downmove and than a steep move to 97000’s. Even it may break the resistance and go to 97790 - 98990 channel.
For the timing of buying and playing long, we can watch the RSI to break the downtrend line and watch the moving average line will pass thorough bollinger middle band. That would be the right time to go in. Of course we have to put our stop loss on just below the 96069 support line.
Good luck!


BIST 100 Buy Opportunity for short termWhen we look at the Bist100 index's hourly watches, the decline that started on July 27 seems to have gradually turned towards a horizontal course.
As we enter the chart a little further, we can see that there are trading opportunities in short time periods. Looking at the half-hour and 15-minute figures, we see that the steepest downtrend that started on August 29 was broken as of today. Similarly, Moving Average seems to have broken the Bollinger middle band upwards. The RSI side also supports output.
Here, the price can throw itself into a new channel (99243 - 99937) by breaking the resistance of 99243. If 99243 is broken, there may be a buying opportunity.
However, it is also necessary to pay attention to the corrections that may take the value back under the green fall band in a possible correction.
Good luck everybody

BIST 100 index may start to bearish period this weekStarting with the FED's announcement, USD/TRY started to go up. This means Turkish Market top 100 BIST 100 may start a downtrend. Usually BIST 100 and USD/TRY moves opposite directions. Uptrend of BIST 100 started on May 22nd.
When we look at the daily chart price is on support level, RSI is also on support level
On 4hours chart; price is on support, RSI broke the support downwards, moving average is testing the bollinger baseline, parabolic SAR started to point down movement, last but not the least is bollinger bands narrowed down for a steep movement.
Lastly on 1hour chart; moving average has already broken the bollinger baseline downwards, RSI and SAR indicators are also confirming the down move.
Price should be checked to see when the price breaks the support. If the movement will start, first aim would be 101578, if that support will be broken also 100792 will be the next support.
PS: These are just my opinions, you should double/triple check my drawings before making a decision :)
