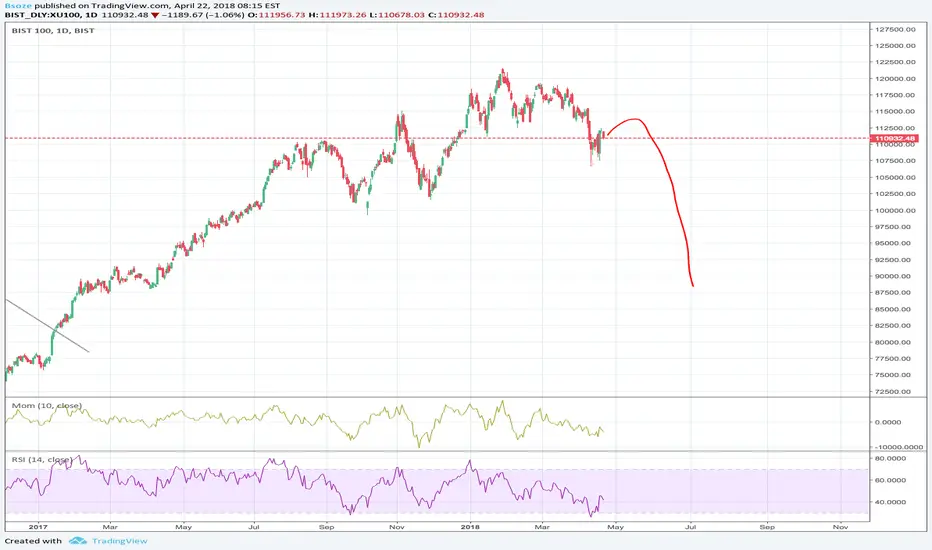
BIST 100Chart Patterns showing signs of weakness and potential topping formation. While as the announcement of the election, RSI and Momentum should be closely watched for any positive or negative divergence.
XU100 trade ideas


BIST100 forecast 2020 years.BIST 100 index forecast until 2020
recent weeks, until end of April 2018 index will start to go down.
most probably this trend will retrace to 100.000 levels.


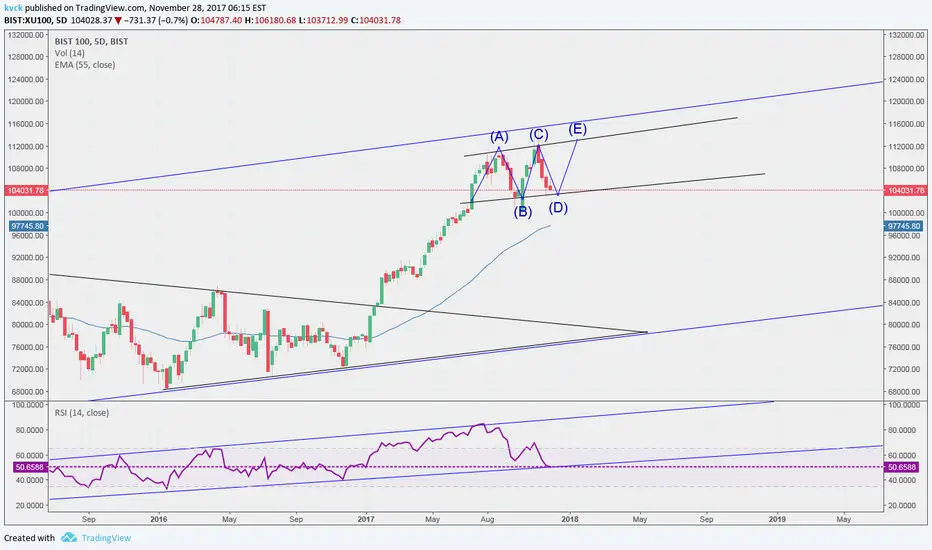
USD BASED XU100As I mentioned before the index reversed from double top. But the trend is still up. If the trend line cannot support from that point since the momentum is very strong, the index can form a ABCD pattern. or can find support from the lower trend line. All is possible.


Long range shortWill not fall right now. Be careful. Maybe rise a bit more.
Temkinli olunuz, sadece gordugumu paylastim buna gore islem yapmayiniz.

#BIST #BIST100BIST may contract in the next days, a potential H&S supports the idea.
A final uptrend to 115K is still a possibility.

Borsa Istanbul (BIST): a last move to 113,000 is still possibleXU100 has still potential to move up to 113,000 level. But on a longer term, it needs a consolidation or retreat to 9x,xxx level.


long then a big shortfundamentally I see no reason why we can spike up however from TA what I see is an ascending triangle, which can be broken up, hitting the resistance of the rising wedge and then bouncing downwards sometime next year causing a slowdown.

within the yellow boxupper bound of the box might be tested, while no one can know what is gonna happpen, one may expect this tendency in the close future

xu100 -- megaphone formation in RSImegaphone formation in rsi yet the price action suggests a continuation of a healthy uptrend! difficult chart to play but lucky enuf the stops are real close... how do you trade the whipsaws?

