5-20-25 WARNING : Bitcoin Sets Up MASSIVE Double-Top WarningI highlighted this incredible price/technical pattern in my morning Plan Your Trade video. But, I thought it was important enough to create a separate video highlighting this incredible Double-Top warning and to try to tell all of my followers to start actively protecting capital over the next 2-3+ weeks.
As much as I would like to say this won't happen (meaning some type of crisis event or global financial crisis) causing a collapse in Bitcoin (and the US/Global markets) - but I believe the continued constraints on the global markets, related to Trump's policies and attempts to reduce US govt spending) will act as a devaluation event for global economies.
Think about it for a minute...
1. If the US is able to remove $500-900 Billion in fraud/waste/NGO spending (of which, a portion of that spending is dedicated to supporting global initiatives/spending), this will result in a contraction (in some form) for some global economies.
2. If the US is able to negotiate more favorable tariff rates for US goods supplied to the world (where foreign nations reduce or eliminate tariffs on US goods), this will also act as a reduction in economic income for many foreign nations.
3. These combined and continued efforts to restructure the US economy into a strong and more dynamic global economic driver (more fairly balanced in terms of global trade) will come at the expense of breaking away from what has traditionally been untouched.
This breaking of the past, in terms of what nations expected related to US spending and tariffs on US Goods, may represent a 15-25% (or more) contraction in foreign economic activity.
If this disruption from "what was normal" results in the US Fed, or global central banks, taking emergency measures to address short-falls in their economies, this could prompt a series of events that could result in a broad devaluation type of event (very similar to what happened after COVID in 2022-2023).
That event was prompted by the US Fed raising rates trying to stop inflation. This event could be the result of slower/lower economic outputs/expectations related to the changing tariff rates and the reduction in US spending throughout the world. Central Banks and regional governments may attempt to provide some type of capital stimulus to transition through this phase - but I see that as "building a bigger bubble - just waiting to pop".
The smart move for global central banks is to follow the US's lead and start to move towards more austerity/accountability regarding their own economies/spending and attempt to let the devaluation price phase play out.
Either way, time will tell if I'm correct or not.
You have been warned. IMO, you have about 3-6 weeks before BTCUSD potentially tops and may roll into a very strong breakdown phase.
Get Some.
#trading #research #investing #tradingalgos #tradingsignals #cycles #fibonacci #elliotwave #modelingsystems #stocks #bitcoin #btcusd #cryptos #spy #gold #nq #investing #trading #spytrading #spymarket #tradingmarket #stockmarket #silver
BITCOIN trade ideas

Healthy BTC Retrace in Trend Next Breakout Target 112K Then 122KBitcoin continues to respect the bullish market highlighted in our previous analysis, where the AB=CD structure pointed toward significant upside potential. The market has since retraced into a well defined re-accumulation zone, aligning precisely with prior expectations.
Price has held firmly above the round figure support ($100k), with the current structure confirming a healthy correction within trend.
As long as the re-accumulation zone between 104k–107k holds, momentum remains skewed to the upside. The projected 2.618 extension sits near the 122k mark, where the current setup aims to complete.
The broader structure still respects higher timeframe demand and ascending channel boundaries, keeping bullish continuation valid unless 100k decisively breaks. Watch for confirmation breakout above 112k to activate the next leg of the move.
If you found this analysis insightful, drop a like to support the work and leave a comment with your perspective whether you agree, disagree, or have an alternate scenario in mind. Let's grow together through collective insights.

The Bitcoin “Big Short”: Whales Are Quietly Leaving the PartyBitcoin just broke $111,000. Headlines are celebrating. Retail is euphoric. But under the surface, on-chain data tells a very different story: wallets holding over $1,000,000 in BTC—commonly referred to as whales—are quietly exiting.
According to Glassnode, the number of $1M+ wallets has dropped by nearly 9% over the last 60 days, even as price soared to new highs. This isn't a coincidence. It's the classic distribution phase—whales cashing out while late-stage buyers, lured in by ETF hype and bullish momentum, absorb the risk.
Bloomberg Crypto reported this month that over $10 billion in BTC has been moved from cold storage to exchanges, much of it from long-dormant wallets and miner reserves. This pattern echoes what we saw before the 2021 crash—strategic selling into strength.
ETFs: Fuel and Trap
Spot Bitcoin ETFs were pitched as the final gateway to mass adoption. In reality, they’re a liquidity funnel. Retail investors pile in via retirement accounts and brokerages, buying exposure—but not the asset itself. Meanwhile, institutional whales sell BTC into these passive flows.
As Bloomberg’s ETF Weekly noted in May 2025, “The majority of ETF inflows are retail-led, while OTC desks are reporting increased large-lot sell requests.” It’s a perfect storm: passive inflows mask whale exits, and the average buyer is blind to what’s really happening on-chain.
On-Chain Red Flags
The blockchain doesn’t lie. Key warning signs are flashing:
$1M+ wallets falling: Down from ~139K to ~126K since March.
Exchange reserves rising: Indicating coins are being positioned for liquidation.
Long-term holder profit-taking: SOPR is above 1.6—profit margins not seen since the last major top.
Dormant coins awakening: Older UTXOs (2+ years) are being spent at the fastest rate since late 2021.
Even miners are capitulating. Miner-held balances are down 12% YTD, and transfer spikes suggest they're taking advantage of inflated prices to fund operations.
Why It Matters
This isn’t FUD. It’s math. When the most informed market participants offload supply into a leveraged, overextended retail-driven rally, the result is rarely soft. If BTC loses key support around $95K, the slide to $60K—or lower—could be violent and fast.
The chart may look bullish. But the blockchain shows distribution, not accumulation. The whales aren’t tweeting. They’re cashing out.
Retail is late to the party. The smart money is already gone.
Bitcoin (BTC/USD) 1H Chart Analysis – Double Top Signals BearishPattern Formed: DOUBLE TOP
⚠️ Bearish Reversal Pattern Spotted!
📍 Formed near 111,794.8
⬆️ Price tested the top twice and failed – strong resistance confirmed!
Key Zones:
🔶 SUPPLY ZONE (Resistance):
🟧 111,794.8 - 111,829.8
🔼 Expect selling pressure here!
🔷 SUPPORT Zone (Broken!):
🔻 Price fell below this level, confirming a bearish breakout
🟩 TARGET ZONE:
🎯 102,500.0
✅ This is the likely drop target based on the pattern
🧊 Other minor supports:
* 102,820.6
* 102,750.8
* 102,227.0.
Indicators:
📈 Trend Line
* Supported the price during the uptrend
* ❌ Now broken — indicates momentum shift
📉 EMA 70 (Red Line)
* Current Price (108,238.6) is below EMA 70 = 109,245.0
* Indicates bearish pressure.
Trade Setup:
🔽 Short Entry Idea: After support break
🛑 Stop Loss: 111,829.8
🎯 Take Profit: 102,500.0
⚖️ Risk-Reward looks attractive!
Summary:
📉 Bearish bias confirmed by:
* Double Top pattern
* Supply zone rejection
* Support break
* EMA crossover
🚨 Traders Watch Out: Bears are in control — next major stop likely at 102,500.0!

Is Bitcoin Ready for Its Next Leg Up? Here’s What We Know So FarBitcoin BITSTAMP:BTCUSD is so back — not just back like “we recovered the dip,” but back like “new all-time highs, let’s go shopping for Lambos on moons” back.
If you’ve been following our Top Stories coverage, you’ll know that the OG token vaulted past $109,500 last week, then kissed $111,900 in “Tom Cruise falling off a building” style. Only that there wasn’t a fall to the ground. Instead, Bitcoin prices got stuck near $110,000 and are now waiting for the next catalyst.
Where are we in the cycle? The memes are pumping. Maxis are chest-thumping (this one’s for you, Saylor ). And the market? Well, it’s trying to figure out if this rocket still has fuel, or if we’re hovering at apogee before gravity reminds us it’s still a thing.
Let’s break down what’s really going on — with numbers, context, and just enough forecast to keep it spicy.
🚀 Bitcoin Goes Bionic
Call it what you want — a breakout, a blowoff, or a moonshot — Bitcoin just rewrote the record books. The OG coin is up 48% since its April lows, a run that’s as explosive as it is poetic.
Remember the bearish chants echoing when BTC dipped near $74,000 in early spring? And all those Bitcoin permabears saying it’s all going to zero? Yeah, those are suddenly hard to hear over the rocket engines.
This is the moment Bitcoin believers have been waiting for. Institutional interest continues to show inflows are strong. Adoption is real and making solid progress. And price action is loud — loud enough to drown out the skeptics still quoting tulip bubbles from 1637.
💥 Why the Breakout? A Perfect Storm
Looking at the fundamentals and the technicals — this wasn’t a fluke. It was a perfect cocktail of macro tailwinds, regulatory green lights, and unrelenting digital gold fever.
ETF flows? Exchange-traded funds are collecting record levels of fresh capital — all eleven of them .
Institutional demand? Climbing faster than Saylor can tweet.
Macro backdrop? Soft dollar, muted inflation, and a shiny 90-day trade truce between the US and China paired with one between the US and the EU .
Regulatory mood? A lot less hostile than the Biden administration, with a stablecoin bill clearing the Senate’s procedural vote and Texas passing a law to hold Bitcoin in its reserve fund.
Bitcoin didn’t ride the wave — it was the wave. And with volatility finally working for traders, not against them, the rally gained real traction.
📉 Not All Risk is Behind Us
Now before we start naming stars after Satoshi, let’s pump the brakes (just a little). The flagship crypto might be chilling around $110,000, but this asset class has the emotional range (and discipline) of a toddler. We’ve seen rallies like this before. We’ve also seen how quickly they unravel.
Upcoming economic data could throw a wrench in the gears. Here’s what to watch for this week:
Wednesday: Fed minutes
Thursday: GDP figures
Friday: Core PCE inflation
Any surprises here — especially hotter-than-expected inflation or hawkish Fed sentiment — could rattle the risk-on party. Bitcoin loves liquidity. If the Fed hints at tightening, the rocket might need to refuel mid-air.
🧭 Key Levels to Watch
Technically, the $111,900 print is your short-term ceiling. It’s the new line in the sand — the price everyone’s watching, waiting for a clean break or a hard rejection.
On the downside, $105,000–$106,000 is developing as support. Break that, and $100,000 becomes the psychological safety net. Below that? Well, let’s not talk about it unless we have to.
Until then, price is consolidating. Think of it like a pit stop — a chance for bulls to breathe, for bears to panic quietly, and for traders to argue about Fibonacci levels.
🛰️ Is $120K Next? Or Is This the Top?
But let’s dig into it a little bit. The real question is whether this rally still has legs. Some traders are calling $120,000 a “magnet level.” Others are treating current prices like the top and selling into strength.
The answer? Probably both.
Momentum is still there — just cooled off a bit. Volume’s down slightly. Social buzz is still high up there. The market’s in a classic “wait-and-see” phase, prepping for a bigger move in either direction.
What could break the stalemate?
A blockbuster inflation report (bullish if soft).
Another policy win from Washington.
Or the most powerful force of all: a dovish stance from the man who moves markets with a simple “Good afternoon” (bonus points if you guess who that is!)
📢 Final Word: Celebrate, But Stay Sharp
If you’ve been long since the dip, this is your moment. Pop some virtual (or real?) champagne. Screenshot that green PnL. Post a gif of Elon and Trump dancing.
But if you’re entering now, zoom out. Yes, momentum is bullish. Yes, fundamentals are stronger than ever. But Bitcoin doesn’t do straight lines for long. And your stop-loss isn’t going to set itself.
Whether $120K is next or we pull back to reset, the next few sessions will be crucial.
Your move : Are you buying this breakout? Waiting for confirmation? Or just enjoying the view from orbit? Let us know how you’re playing this Bitcoin beast — because one thing’s certain: it’s never boring up here.

Bitcoin - Here we have the all time high!Bitcoin - CRYPTO:BTCUSD - is just getting started:
(click chart above to see the in depth analysis👆🏻)
It was really just a matter of time until we see a new all time high on Bitcoin. Consindering that over the past two months alone, Bitcoin rose another +50%, this was a clear indication that bulls are taking over. But this all time high is clearly not the end of the bullrun.
Levels to watch: $300.000
Keep your long term vision!
Philip (BasicTrading)

BTCUSD NEXT MOVE (EXPECTING MILD BEARISH)(28-05-2025)Go through the analysis carefully, and do trade accordingly.
(TODAY ANALYSIS IS LOW ACURACY ANALYSIS)
Anup 'BIAS for BTCUSD (28-05-2025) (SHORT TERM)
Current price- 109000
"if Price stay below 1,10,000 then next target is 1,08,000, 1,07,000 and 1,06,000 above that 1,11,000.
-POSSIBILITY-1
Wait (as geopolitical situation are worsening )
-POSSIBILITY-2
Wait (as geopolitical situation are worsening)
Best of luck
Never risk 2% of principal to follow any position.
Support us by liking and sharing the post.

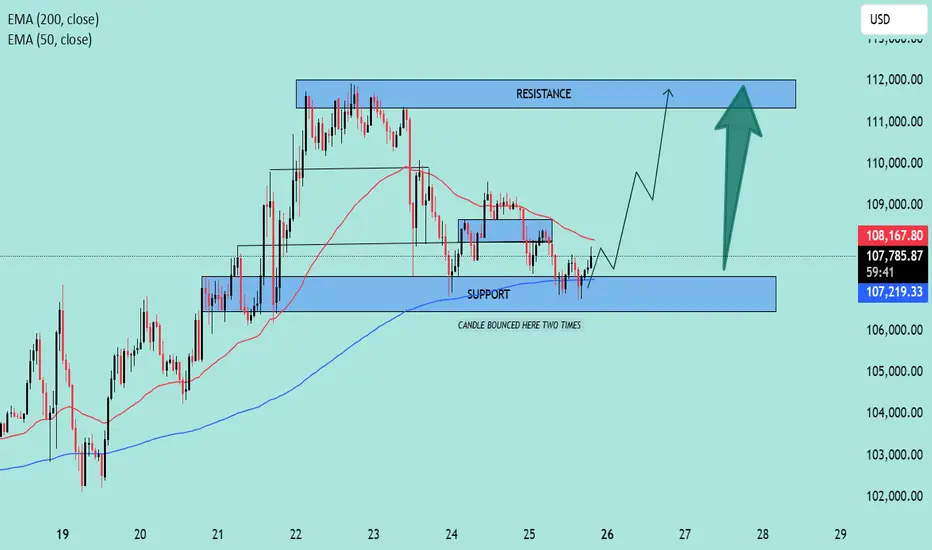
BTC/USD Rebound in Play! | Key Support Holding, Eyes on $112K📊 BTC/USD Technical Analysis
🗓️ Chart Date: May 25, 2025
🔍 Key Levels:
🔵 Support Zone: $106,800 – $107,300
Notably, price bounced twice in this region, indicating strong buying interest.
This area aligns closely with the 200 EMA (currently at $107,213.51), adding further confluence as dynamic support.
🔴 Resistance Zone: $111,800 – $112,300
Previous highs and consolidation make this a significant area where sellers may re-enter the market.
📈 Indicators:
🔵 EMA 200 (Blue): $107,213.51
Acts as a strong dynamic support; price bounced off it recently.
🔴 EMA 50 (Red): $108,182.91
Price is currently below the 50 EMA, suggesting short-term bearish pressure remains until this level is reclaimed.
🧠 Market Structure & Price Action:
After a sharp drop from the resistance zone, price found solid footing at the support zone.
Recent candles show rejection wicks from the downside, hinting at potential bullish reversal.
A breakout above minor consolidation and 50 EMA could trigger a bullish continuation toward the resistance.
📌 Forecast:
✅ If the price holds above the support zone and breaks above $108,200, we can expect a bullish move toward $112,000.
⚠️ However, a failure to break above the 50 EMA could lead to a retest of the support zone.
🧭 Trade Idea (Not Financial Advice):
📥 Long Bias:
Entry: On confirmed breakout above $108,200
SL: Below $107,000
TP: $111,800 – $112,300
📌 Conclusion:
The chart setup suggests a potential bullish reversal 📈 from a key support zone, supported by EMA 200. Watch for a break above the 50 EMA for momentum confirmation.
🧠 Always confirm with volume and wait for confirmation before entering a position.
BTCUSD NEXT MOVE (EXPECTING MILD CORRECTION)(23-05-2025)Go through the analysis carefully, and do trade accordingly.
Anup 'BIAS for BTCUSD (23-05-2025) (SHORT TERM)
Current price- 1111000
"if Price stay below 1,12,000 then next target is 1,10,000, 1,08,000 and 1,06,000 above that 1,13,000.
-POSSIBILITY-1
Wait (as geopolitical situation are worsening )
-POSSIBILITY-2
Wait (as geopolitical situation are worsening)
Best of luck
Never risk 2% of principal to follow any position.
Support us by liking and sharing the post.

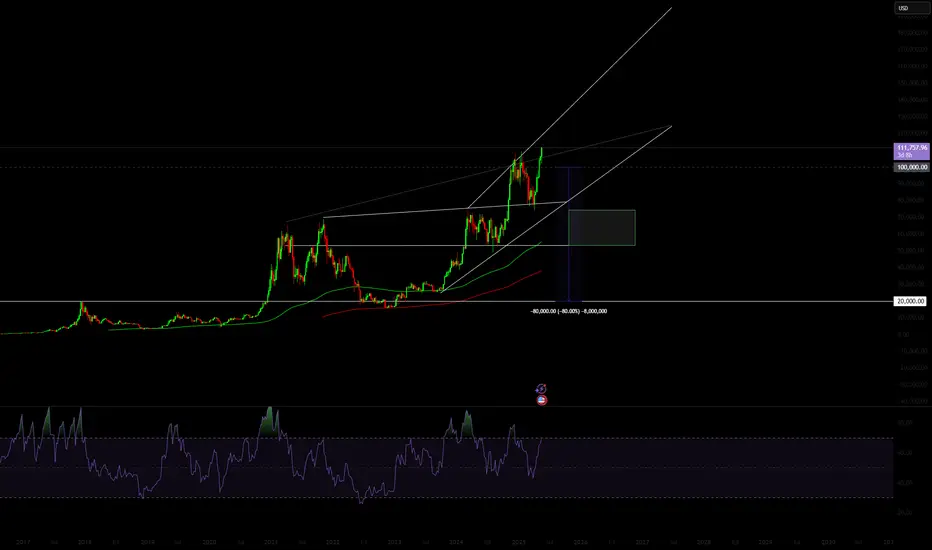
BITCOIN is attempting to converge with past Cycles!Bitcoin (BTCUSD) is experiencing the weakest Bull Cycle in its history, a natural product of the Theory of Diminishing Returns (TDM).
This chart couldn't have put it better as we show all Cycles since BTC's first day, one on top of the other. Naturally the first Cycles were the most aggressive, witnessing extraordinary gains as the upside potential of a fresh market was enormous in its early days.
The 2015 - 2017 (blue trend-line) and 2019 - 2021 (black trend-line) Bull Cycles have been harmonized to a more traditional capital market state and this is obvious on their trend-lines, which exhibit similar parallel price action. Whenever the two diverged, they converged at some point during the Cycle.
The current Cycle (2023 - 2025) following the late February 2025 divergence, is now attempting to converge again with its strong rebound in the past 6 weeks. Being however within a Channel Up throughout the entirety of the Cycle, it appears that it will do so in a structured way and as the TDM suggests, will offer weaker gains.
What we can project, as we've shown on previous studies in great detail, is the timing of the Cycle Top. Based on past Cycles, it should be within October - December 2025. Timing your exit strategy can perhaps be more effective than assigning a certain Target, even though the peak is expected to be anywhere within the $150k - $200k range.
So do you agree that the rise we're witnessing is the Cycle's attempt to converge with past ones and close the gap before it tops? Feel free to let us know in the comments section below!
-------------------------------------------------------------------------------
** Please LIKE 👍, FOLLOW ✅, SHARE 🙌 and COMMENT ✍ if you enjoy this idea! Also share your ideas and charts in the comments section below! This is best way to keep it relevant, support us, keep the content here free and allow the idea to reach as many people as possible. **
-------------------------------------------------------------------------------
💸💸💸💸💸💸
👇 👇 👇 👇 👇 👇

BTC\USD..bitcoin 30m chart pattern I’m planning a **BTCUSD Buy trade** with the following details:
- **Entry**: $108,900
- **Target**: $112,000
Here’s a quick analysis and risk management plan for your trade:
---
### **1. Trade Setup**
- **Potential Profit**: **$3,100 per BTC** (2.85% gain from entry).
- **Risk/Reward Ratio**: Depends on your stop-loss (SL). Example:
- If SL = $107,900 (1% risk), reward/risk = **3.1:1** (favorable).
- If SL = $106,900 (1.8% risk), reward/risk = **1.6:1**.
---
### **2. Key Levels to Watch**
- **Support (Protective SL)**:
- Short-term: **$107,500–$108,000** (psychological support).
- Stronger: **$106,500** (would invalidate bullish momentum).
- **Resistance (Target)**:
- **$112,000** is a psychological round number (may face selling pressure).
- Beyond: Next targets could be $115,000 or $120,000 if bullish.
---
### **3. Execution Tips**
- **Order Types**:
- Use a **limit order** at $108,900 (if waiting for a pullback).
- Or **market order** if bullish momentum is strong.
- **Stop-Loss Suggestions**:
- Conservative: **$107,900** (0.9% risk).
- Aggressive: **$106,500** (2.2% risk).
- **Partial Profit-Taking**: Consider selling 50% at $112,000 and trailing the rest.
---
### **4. Market Context (Verify Before Trading)**
- Check if Bitcoin is in an **uptrend** (e.g., higher lows) or facing resistance.
- Monitor catalysts: ETF inflows, Fed rate decisions, Bitcoin halving effects.
---
### **5. Alternative Strategy**
If unsure about timing, consider:
- **DCA (Dollar-Cost Averaging)**: Split your buy into smaller orders (e.g., 3 entries at $109k, $107k, $105k).
---
**Would you like help with:**
- Chart analysis (e.g., RSI, volume trends)?
- Refining stop-loss/take-profit levels?
- News impacting Bitcoin right now?
Let me know how you'd like to proceed! 🚀

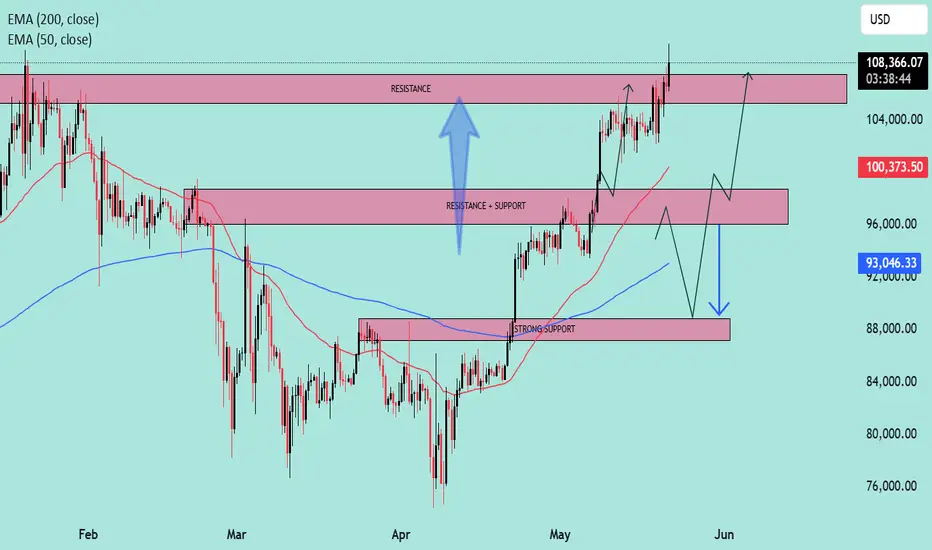
Bitcoin: Too Early To Buy The Retrace.Bitcoin may be entering a brief corrective formation within the broader bullish trend. The large red candle that rejected the 113K resistance (see my previous article), could be the beginning of a retrace that can take price as low as the 102,500 to 100K area IF bearish momentum persists. The mistake to avoid is buying this pullback too early, especially since there is no bullish confirmation on this time frame.
The red candle off the 113K area is what I like to refer to as the "mother bar". As you will notice, the following candle is a bearish pin bar which failed to break back above the 50% point of the mother bar (see blue arrow). This is a "mini" lower high and is typically a bearish sign for those operating on smaller time frames. A break below 106,500 would confirm a sell signal on this time frame as well as smaller time frames like 4H and 1H. This can be attractive for aggressive shorts, BUT it is very important to keep the broader trend in perspective.
This bearish development does NOT constitute a change in the broader trend. This means support levels are still more likely to hold, and resistances more likely to break. The higher probability scenarios in my opinion are bullish reversal patterns between the 102,500 - 100K area. Double bottoms, failed lows etc. on 1H, 4H or this time frame would be ideal for swing trade longs (see illustration). IF the bullish trend is going to stay intact, then a higher high is within reason which can see price test 113K or higher (120K is my next resistance).
Another VERY important consideration is the overall location of price. Currently in a Wave 5 (v) configuration which signifies limited potential in the near future. In other words, RISK is elevated and only continues to increase as price climbs higher. As "optimistic" as everyone may seem to be, this is a time to be more defensive, NOT aggressive. This can be accomplished by reducing expectations, operating on smaller time frames, and taking smaller positions. My Trade Scanner Pro helps to quantify risk which is especially helpful in rising risk environments such as this one.
In contrast, the location to be aggressively bullish was the 76K area low. Sure I can say this after the fact, BUT if you read my analysis and watch my streams from that time, I was pointing out the potential and the bullish signs as they were developing in real time.
Market situations like the one Bitcoin is in right now can be very confusing at times. Navigating this environment successfully depends on how you interpret price structures, trends and levels across multiple time frames and letting the MARKET validate ideas or not the other way around. Always consider arguments on both sides of the market and weigh those arguments against the style or strategy that you intend to deploy. And if confusion ensues, then the easiest thing to do is walk away. When potential is limited, there is nothing to fear in terms of missing out.
Thank you for considering my analysis and perspective.

Bitcoin Sell in may and walk awayMaybe that was the top .Break and retest the uptrend after that a crash might occur towards 85k region.
My plan hasnt change yet , i still think we might see btc during the summer at 65k region.

Golden Cross? No Thanks!! Here’s How to Get In Early.📉 “Golden Cross? No Thanks. Here’s How to Get In Early.”
By FXProfessor
Everyone’s hyped about the Golden Cross again...
📰 “Bullish Signal!”
📈 “50 SMA crossed the 200!”
🎉 “Party time!”
Let me stop you right there.
If you’re waiting for that cross to go long —
You’re not late.
You’re definitely late.
The Golden Cross is a lagging indication.
It’s the afterparty. The smart money already had the drinks and left.
🔍 Here's the deal:
✅ Golden Cross forms after the move
✅ Price is usually already up double digits
✅ Sometimes it triggers right before a top
✅ Even EMAs (which I prefer) are still confirmation tools
✅ The real edge? Structure. Trendlines. Pressure zones.
📊 What I use instead:
-Custom EMAs that react faster
-My signature parallelogram method for early pressure
-Focus on trendlines and structure
-Above all — logic, not hype
- Fundamentals first!
For example, while the Golden Cross just printed, I was already watching $74,394 and $79,000.
Why? Because pressure builds before indicators react.
That's where the best entries live.
So next time someone posts
“Golden Cross confirmed!” 😏 Just smile and remember:
By the time the cross lights up, I’m already halfway to the next target.
Use EMAs if you like. But structure comes first.
That’s where the party starts.
One Love,
The FXProfessor 🧠📈
Disclosure: I am happy to be part of the Trade Nation's Influencer program and receive a monthly fee for using their TradingView charts in my analysis. Awesome people who care about the TRADER FIRST!

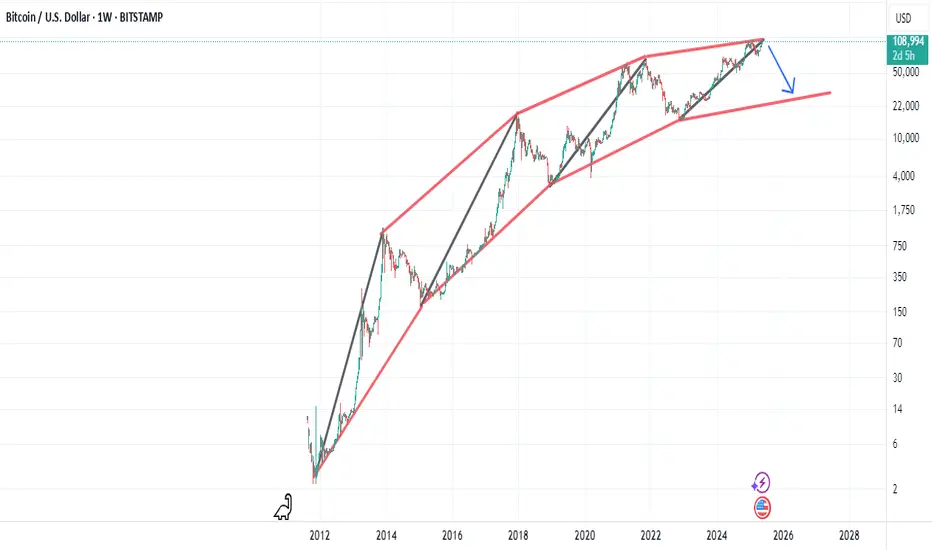
BITCOIN repeating every Cycle's final rally!Bitcoin (BTCUSD) has been on a strong rally since the April 2025 bottom on the 1W MA50 (blue trend-line) and that's perfectly aligned with the 1W MA50 rebound it had on the previous two Cycles in June 2021 and June 2017.
As you can see, those (blue circles) where the All Time High (ATH) Pivot trend-line test before the final (parabolic) rally of the Cycle started, which was its most aggressive part.
In 2017 it was much stronger and the price rallied much higher, which is natural as the market was much less mature (institutionally) than today, but it is not improbable to get a rally similar to July - November 2021.
Can that be enough to push BTC to $150k and beyond? Feel free to let us know in the comments section below!
-------------------------------------------------------------------------------
** Please LIKE 👍, FOLLOW ✅, SHARE 🙌 and COMMENT ✍ if you enjoy this idea! Also share your ideas and charts in the comments section below! This is best way to keep it relevant, support us, keep the content here free and allow the idea to reach as many people as possible. **
-------------------------------------------------------------------------------
💸💸💸💸💸💸
👇 👇 👇 👇 👇 👇

BITCOIN $119k coming shortlyBitcoin (BTCUSD) has been trading within a 6-week Channel Up and Friday's tariff threats led pull-back was its latest Bearish Leg. That pull-back hit the 4H MA50 (blue trend-line) yesterday and rebounded. As long as the 4H MA100 (green trend-line) which is directly below the Channel Up holds, the current rebound is technically the pattern's new Bullish Leg.
All 4 previous Bullish Legs have ended on fairly similar % rises but the weakest has been +11.41%. With the 4H MACD just now completing a Bullish Cross (which has always been a strong buy signal), a repeat of the +11.41% minimum, gives us an immediate $119000 Target.
Do you think that's coming shortly before the beginning of June? Feel free to let us know in the comments section below!
-------------------------------------------------------------------------------
** Please LIKE 👍, FOLLOW ✅, SHARE 🙌 and COMMENT ✍ if you enjoy this idea! Also share your ideas and charts in the comments section below! This is best way to keep it relevant, support us, keep the content here free and allow the idea to reach as many people as possible. **
-------------------------------------------------------------------------------
💸💸💸💸💸💸
👇 👇 👇 👇 👇 👇

BITCOIN This Cycle's peak zone is $150k - $200k.Bitcoin (BTCUSD) is extending its gains week after week since the April 07 bottom on the 1W MA50, which as we've analyzed extensively its a new Higher Low launchpad for the new (current) Bullish Leg, the way it's been consistently doing on the Higher Lows trend-line since the start of this Bull Cycle.
It's in fact the very same Higher Lows trend-line it had during both previous Cycles, which ended up peaking on the Logarithmic Growth Curve's (LGC) top 2 zones (red), breaking also above the 2 SD above band (orange) of the Mayer Multiple Bands (MMB).
This time the price has 'only' broken above the 1 SD MMB (grey), while having breached into just the lower pink LGC zone. This highlights the theory of Diminishing Returns but at the same time also shows the strong upside potential of the market while subject to these conditions.
So assuming it won't hit by the end of this Cycle the 2 SD MMB nor the top 2 zones of the LGC, the bad case scenario seems to be topping the lower pink LGC zone and the good case scenario topping the upper pink LGC zone. Those two give a profit taking range of 150 - 200k respectively and based on the Sine Waves, we should peak around October 2025.
Is that your profit taking zone as well for this Cycle? Feel free to let us know in the comments section below!
-------------------------------------------------------------------------------
** Please LIKE 👍, FOLLOW ✅, SHARE 🙌 and COMMENT ✍ if you enjoy this idea! Also share your ideas and charts in the comments section below! This is best way to keep it relevant, support us, keep the content here free and allow the idea to reach as many people as possible. **
-------------------------------------------------------------------------------
💸💸💸💸💸💸
👇 👇 👇 👇 👇 👇

SPY/QQQ Plan Your Trade For 5-21 : Inside-BreakawayI've been very clear over the past few weeks that I believe the markets are poised for a rollover/topping pattern and I believe BTCUSD is showing us exactly how/when that rollover top is going to play out (June 1-June 9).
In the meantime, I believe the SPY/QQQ are entering a more volatile "early topping" formation while still in an uptrend (Bullish).
I urge traders to start watching various sectors for weakness and keeping your eyes open for any signs the market could be moving into a sideways price rotation.
I think the rollover top will be aligned with some financial event (trade/tariff/other) that will result in a broad disruption of the US/Global markets. And I believe BTCUSD will lead the move by about 4-7+ days.
Gold and Silver are starting to move higher again. That is a sure sign that traders are now more actively seeking to hedge global risks (again).
I believe this move higher in metals may continue through this week and into next week (looking for that top in the SPY/QQQ).
Follow my detailed BTCUSD video to learn why BTCUSD may continue to try to push a bit higher before topping and moving into a broad price decline.
Get some..
#trading #research #investing #tradingalgos #tradingsignals #cycles #fibonacci #elliotwave #modelingsystems #stocks #bitcoin #btcusd #cryptos #spy #gold #nq #investing #trading #spytrading #spymarket #tradingmarket #stockmarket #silver

Technical Levels Respected – BTC Reaches $108K Target what next?📍 BTC Target Hit with Precision!
✅ As predicted in the previous analysis, Bitcoin has successfully tapped the $108K resistance zone — clean and technical execution!
📊 My chart spoke in advance... and the market listened.
🎯 Why miss out on these accurate forecasts?
📉 My strategies are not just random lines — they’re built on solid market structure, EMAs, and key price action zones.
📢 Let’s stay connected!
🧠 I’m committed to sharing educational content and professional trading insights to help you grow as a trader.
💡 Whether you're a beginner or seasoned trader, there’s always something new to learn with me.
📚 Join the journey — learn, trade, and win!
📩 DM or follow to get consistent updates and chart breakdowns.
🚀 Let’s trade smart, not hard!
BTC/USD Bullish Setup: Double Bottom Breakout Targeting $110,000 Trade Setup Analysis
1. Support & Resistance Zones
Support Zone (Buy Zone):
Highlighted in purple, between $103,764 and $104,633, with a noted stop loss area near $104,061.
Resistance/Target Zone (Take Profit Area):
Around $109,878 – $110,002 labeled as “EA TARGET POINT”.
2. Double Bottom Pattern (Bullish Signal)
There are two orange circles at the bottom, indicating a double bottom pattern—often a bullish reversal signal.
This is supported by a neckline break near the entry point at $104,534.
3. Moving Averages
Two moving averages are displayed:
Likely a short-term MA (red) and a medium/long-term MA (blue).
The price crossing above both suggests bullish momentum.
4. Trade Plan
Entry Point: Around $104,534
Stop Loss: Below $104,061
Take Profit (Target): $109,878 – $110,002
Risk/Reward Ratio: High, given the tight stop and wide target.
📈 Price Projection
The blue arrowed path suggests:
A minor dip or consolidation near $104,534, followed by a strong upward move toward the target zone.
The movement outlines a classic cup-and-handle or double-bottom breakout pattern.
🧠 Conclusion
This is a bullish trading setup for BTC/USD with a favorable risk-reward ratio. The chart suggests:
Buying near $104,534
Stop loss just below support
Targeting a move to ~$110,000

Bitcoin to crash to 55K Based on its historical price action, bitcoin might crash to 55K in next one year.

Bitcoin has the potential to return to $30,000A simple idea:
The Bitcoin price trend has clearly weakened, as you can see in the image above, the upward waves are getting weaker (the angle of the blue lines is getting smaller).
The price is moving in a curved channel and has the potential to reach $30,000.
Hellena | BITCOIN (4H): LONG to resistance area of 110,000.Colleagues, I believe that the upward movement is not over yet, so I move wave “3” higher as prolonged.
I believe that the price will reach a strong resistance level of 110,000.
A small correction is possible, as usual.
Manage your capital correctly and competently! Only enter trades based on reliable patterns!
