Cautionary tale on BitcoinI decided to temporarily depart from my usual trade ideas to wave a cautionary finger at the chart of Bitcoin, where I have noticed a rather worrying pattern within the weekly charts. However, before I delve in, I would like to stress that I am a very rigid believer in the long-term prospect of our monetary saviour and what I am supposed to write about only concerns the usual, inevitable cyclicality that always entails the otherwise upward-sloping trajectory of Bitcoin ( CRYPTO:BTCUSD )
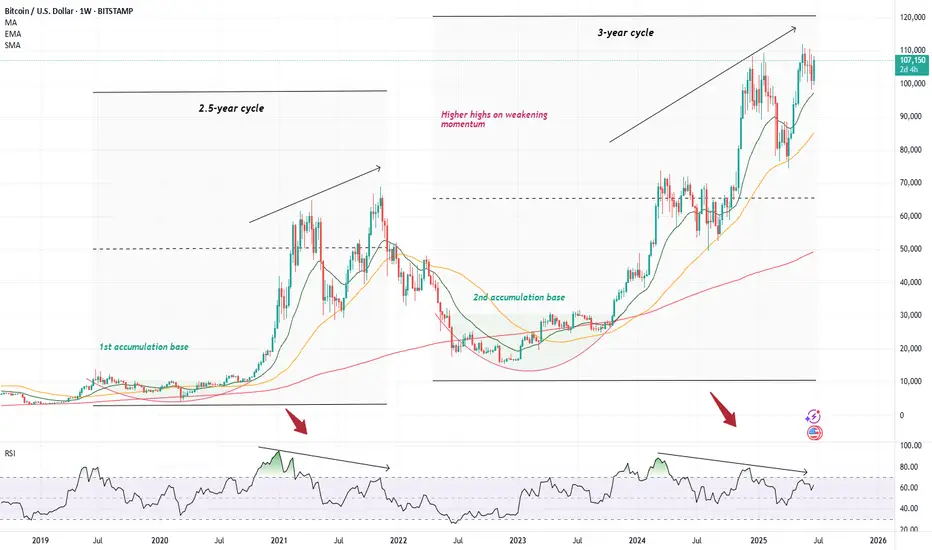
Although overall this has not felt like much of a crypto bull run given the apparently absent performance of altcoins (apart from an occasional 1000x on a well-targeted memecoin), Bitcoin has, in the meantime, trod its usual path upwards. Since the '22 lows, it has mimicked its regular pattern where after a devastating plummet lower, it has spent several long months accumulating until it has burst out of its cocoon to provide a 6x return to its strong believer. However, the mimicking is almost too good as we have now started painting a very similar picture to what eventually transpired to be the '21 top. We have reached a strong above >100k top only to hit a vicious correction (announcement of tariffs), similar to what Bitcoin did in May of 2021 (China crackdown, tech selloff). The price then quickly consolidated - which I am not an avid fan of as a formation of a more robust base would be more preferable (though would take longer ) - and bitcoin shot back up again, quickly reclaiming the previous highs; just like it did in October/November 2021. This creates an unfortunate setup best represented by the series of lower highs on an RS I while the price keep climbing higher - creating the probably best-know bearish signal with higher highs built on weaker and less robust momentum.
We know how this ended in 2021, and I am not suggesting that Microstrategy should blow up, go bankrupt and sell all its bitcoin (though definitely a possibility) - however, one must admit that there are currently quite a lot of uncertainties that could unwind at any time (one such coming on July 8th with the second version of the lets-blow-up-the-stock-market day). With a stock market priced to perfection, and with what seems like a large pile of uncertainties hovering in the air, it seems like any one of these could light up the fire underneath these lovely valuations we have reached, and although I would love for cryptocurrency prices to be completely independent of the stock market, we usually know how this goes.
So, what to do about this? Preferably nothing . If you are as much of a believer as I am in the necessity of bitcoin in today's financial world, this is just another blip in an otherwise long and profitable ride. So, I won't be any selling any of it - hopefully only adding once we decline. I would also add that I am not expecting as much of a bloodbath as last time. I think Bitcoin has reached a point where the 80-90% declines become very rare. However, regarding my other allocations in crypto assets, I am not as optimistic, hence I decided to sell most of everything else. Although I love the premise of Ethereum, the chart looks pretty horrific, currently drawing a perfect head-and-shoulder on a 4h chart (which I might write about as well as a short idea).
I will end this essay the same way I started it - I know absolutely nothing, and maybe I will come back at the end of the summer, beautifully tanned and relaxed as we all are in Europe, and find everything at all-time highs. I just currently believe the risk-reward ratio is not skewed in my favour, and I don't know how about you, but I tend to listen to my probability gods, especially on the eve of another strong SPAC year .
BITCOIN trade ideas
BTCUSD Short Idea - Looking for further downsideBTCUSD (15m timeframe).
* Bearish Trend: Price has been respecting the downtrend line.
* Structure Break (ChoCh): Multiple 'ChoCh' (Change of Character) signals indicate a shift in market structure to bearish.
* Supply Zone Entry: I'm looking for a retest of the recent supply zone around 107,208 - 107,059 for a short entry.
* Stop Loss: Placed above the last significant high and supply zone around 107,861.
* Target: Aiming for 105,445, potentially lower, targeting previous lows and liquidity.
Always manage your risk! Let me know your thoughts."

BTCUSD – Short Setup in Play📉 BTCUSD – Short Setup in Play
Exchange: Coinbase | Timeframe: 1D
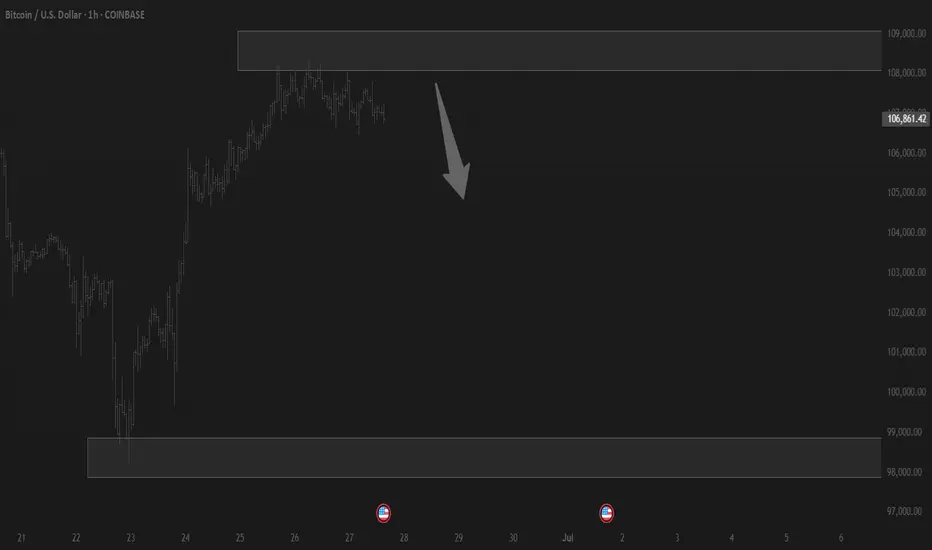
Price has just tapped into a key supply zone after reclaiming a prior level, but momentum looks overextended. If the rejection holds, I’m expecting a drop toward the 103.3K zone, with possible continuation into 102.8K and below.
🔽 Short Bias Active
📍 Entry Region: 107.8K
🎯 Target: 103.3K
⛔ Invalidation: Clean breakout above 112K
A pullback first wouldn’t surprise me—liquidity still needs to be swept.
Let’s see how BTC behaves at the highs. ⚔️
#Bitcoin #BTC #Crypto #PriceAction #TradingView #BTCUSD #GlobalHorns

BTC BULLISH FLAG AND POLE PATTERN 135,000$ TARGETAs seen in the charts, BTC is currently forming a flag and pole pattern.
Expect price to cover one last liquidity sweep before pumping to the 135-140k price range.
ESH.

Bitcoin summer of fun...If we are in a continuation pattern, and Bitcoin breaks the neckline soon.
We could be on the cusp of a very interesting and strong few months of price action.
Continuation upward sloping #inverseheadandshoudlers

SELL BTCUSD trading signalBTCUSD confirmed the weakness at the trendline resistance zone on the h4 time frame.
The h1 time frame price confirmed that the sellers won when the candle closed below the nearest trendline support zone.
In terms of wave structure, there is no strong support zone that is strong enough to keep the BTC price uptrend in the short term. Therefore, the target of the SELL signal can reach 100,400. That is the wick area of the past liquidity candle where the buyers won over the sellers and pushed the price up sharply.

106 Retest?Could very well be possible that we see BTC revisit 106 for a final retest to solidify it as a firm base of support before truly attacking 109-110. BUT, once 109-110 has been broken through it will likely be retested to create another layer of support before seeking new ATHs and price discovery. I am also still of the belief that we will see BTC.D start to really crap the bed in the coming weeks with euphoria finally arriving in middle August according to BTC.D's key support levels.
Stand fast. Keep faith. Remain vigilant.

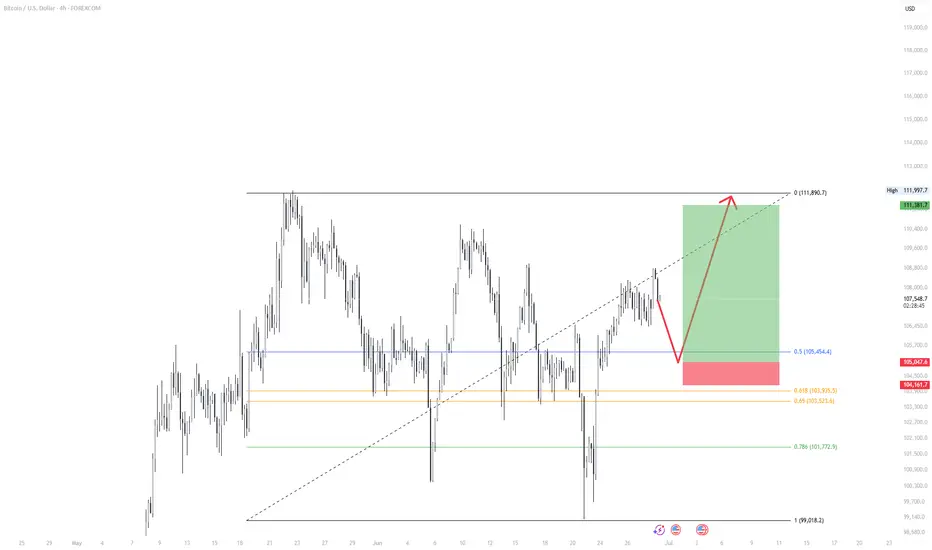
BTC/USD Long Setup – Buy the Dip into SupportMarket Context:
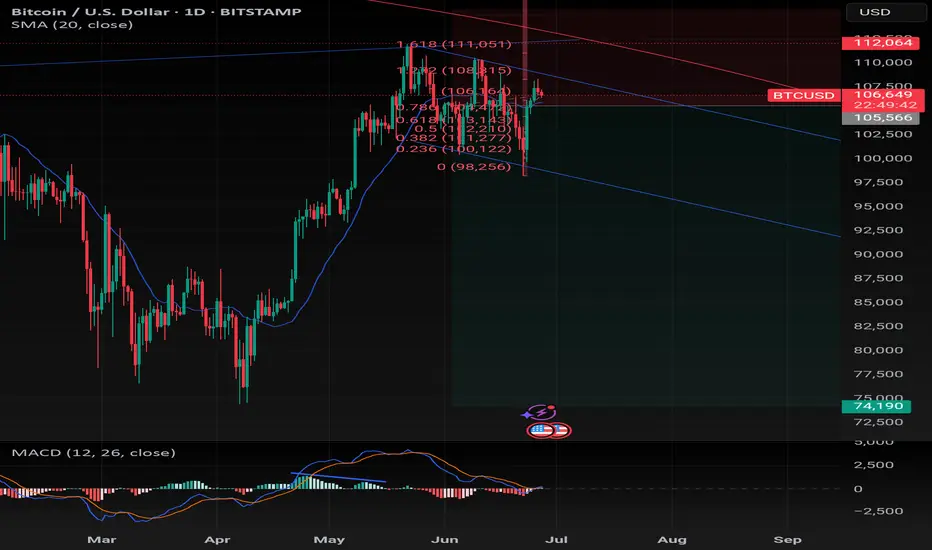
Bitcoin is currently in a retracement phase after rejecting from the local high near 111,900. Despite the short-term pullback, the broader structure remains bullish. This setup is based on a retracement into a key support zone, offering a potential entry for the next leg up.
Setup Idea:
Price is pulling back into a confluence area that includes:
The 0.5 Fibonacci retracement at 105,454
Previous structure support
A retest of the broken diagonal trendline
This zone is expected to act as demand, providing a favorable long entry opportunity.
Trade Plan:
Entry zone: Around 105,400
Stop loss: Below 104,100 (beneath structure and fib zone)
Target: Retest of the previous high near 111,890
Risk/Reward: High R potential with clearly defined invalidation
Notes:
If price breaks below 105,000 and fails to show buying strength, the setup becomes weaker. A decisive break below 103,900 invalidates the trade idea. Wait for bullish confirmation (e.g. higher low or volume reaction) in the entry zone before committing.
This is a clean, structured opportunity aligned with the prevailing trend. Patience and confirmation are key.
demand spotted hunted and caughtits just becomes easier once you understand comprehensively how the forex market moves. its structures and its dynamics

$BTC Weekend Update - A New Hope - 6/29Hello fellow degenerates,
Price held beautifully above 106.6k key level and is now attempting a test of 110.4k level. We are in a high risk zone as we do have a lot of levels that could initiate a reversal down, so ultimate caution is needed.
- Price hit the target where a Wave 1 could be so I am looking for a possible retracement that would take us towards 103k.
- In the most bullish scenario, both Wave 1 and 2 have been completed and price could just break above ATH and continue higher, but this is just wishful thinking.
- Currently watching for a break above the Parallel channel resistance
- Levels to Watch: 110.4k, 106.6k, 103.4k, 101k

CHECK BTCUSD SIGNAL READ CAPTAINsell Setup)
Entry Zone: Around 106850.00\106650.00
Stop Loss: 107400.00
Take Profits:
TP1: ~106000.00
TP2: ~105300.00
Final Target: 104550.00

Trading balanceTrading balance The price of the asset has rebounded from the balance zone. With the prospect of growth into the resistance zone.
BTC is sliding to around 73k as a minimum target to 43kIt's just starting a downtrend inside a big Correction
Major Res. @ 114,000
Major Support @ 43,000
My decision is to go short @ spot price / Take profits @ 73,000 - 43,000 / Stoploss @ 114,000 - 116,000
This recommendation is to 3 - 6 months investors.
BTCUSD Massive Long! BUY!
My dear subscribers,
BTCUSD looks like it will make a good move, and here are the details:
The market is trading on 99659 pivot level.
Bias - Bullish
My Stop Loss - 97824
Technical Indicators: Both Super Trend & Pivot HL indicate a highly probable Bullish continuation.
Target - 10315
About Used Indicators:
The average true range (ATR) plays an important role in 'Supertrend' as the indicator uses ATR to calculate its value. The ATR indicator signals the degree of price volatility.
Disclosure: I am part of Trade Nation's Influencer program and receive a monthly fee for using their TradingView charts in my analysis.
———————————
WISH YOU ALL LUCK

BULISH ON BTChi .
this in my humble forcast for the BTC ATM
juste wait for confirmation in the zones i put and you can long

bitcoin target 500,00099% still don’t get it.
Bitcoin is just 10–12 years old.
It hit $100k without global adoption.
Now imagine the next 10 years…
As the world wakes up.
Buy @ $109,445 | Target $500,000
#Bitcoin #BTC #Crypto #BullRun

Bitcoin Awaits Breakout Above $114K🪙 Current Price: ~$109,500
📈 Trend: Bullish but facing strong resistance at $114,000
📉 Support: $106,000–$107,000
📌 Outlook: Breakout above $114K could lead to $130K+. Otherwise, possible pullback to $106K.
📊 Key Drivers: ETF inflows, Fed rate cut expectations, weak USD.
💡 Strategy:
🔺 Buy: $107,000 – $107,500 → TP $114,000 | SL $106,000
🔻 Sell (take profit): $114,000 – $115,000 → SL if closes below $112,000

BitcoinBitcoin has fallen below the support area, resulting in the expected quick decline. The price is currently testing the resistance area and must reclaim this level; otherwise, we may see downward movement again. The key level to reclaim is between $106,800 and $107,000.

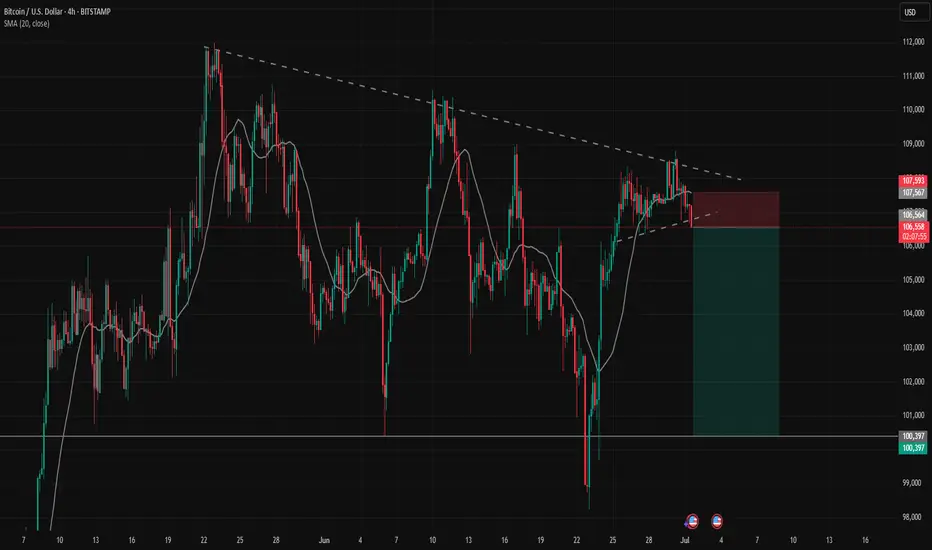
Bitcoin Daily – Multi-Line Magnet in Play📊 Bitcoin Daily – Multi-Line Magnet in Play
Price, Time, and Structure Align
I’ve added a new trendline connecting the last two deep hits.
Technically, the second hit broke the old flag structure – but honestly, that’s not a real problem.
👉 The overall swing structure remains intact.
The new line now perfectly fits the current market rhythm.
What’s really interesting:
This new trendline converges exactly at the same magnetic zone I’ve been tracking – around 96,944 USD.
It aligns with the previous horizontal key level, the EMA projection, and the crosspoint I marked earlier.
This kind of multi-line confluence often acts like a price magnet.
👉 What I love about this setup:
If price really pushes into this zone, it would cleanly stab through the old flag structure – a typical panic trigger that shakes out many traders.
📌 Also worth noting: Another day has passed since my initial idea, and the current price action has technically proven that it’s possible to push lower.
The path to the target remains open.
👉 Stop-Loss Logic:
For this setup, the cold stop-loss sits just below the midline of the weekly Bollinger Band.
If this level gets broken, the overall structure is technically invalid.
But I wouldn’t place the stop directly on the midline – it’s smarter to give it a small buffer to survive potential liquidity sweeps.
Typically, this level doesn’t break cleanly on the first touch.
Let’s see how this plays out.
BTC Pullback or Breakout? Key Levels to Watch Around 110KBitcoin is showing repeated rejections from the $110K and $108K zones. Currently, it's moving upward from the $98K area toward resistance, but price action remains compressed between the major trendline support and resistance.
This range-bound structure suggests that a pullback may be imminent, especially as RSI is forming consistent bearish divergence and the MACD is signaling weakness. A liquidity sweep to the downside could occur before a decisive move.
However, if BTC manages to break above the converging trendlines with strong volume, we may see a move toward $110K again for a retest. Watch $106K as an intermediate support. If that fails, further downside may follow.
📌 Trading Insight: Wait for confirmation before entering — don’t jump in without a clear signal.

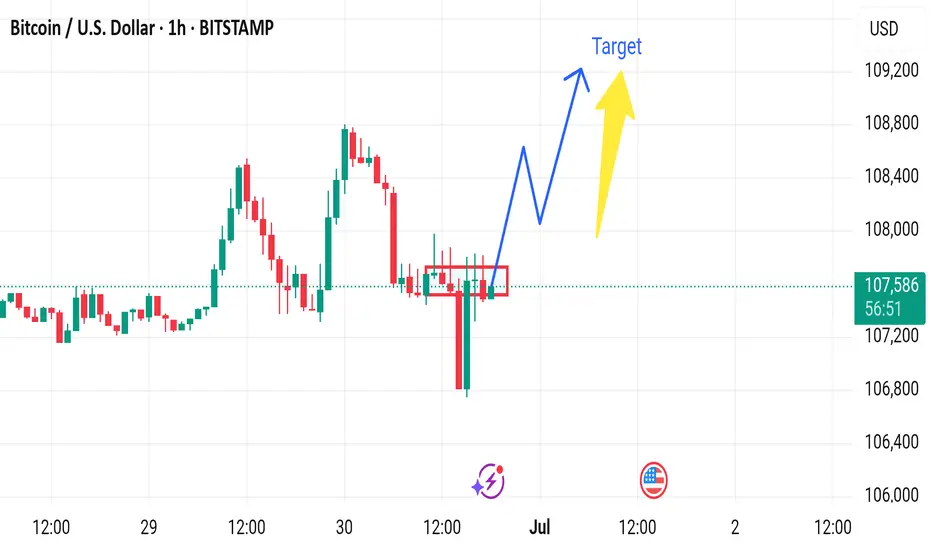
Market next target 🔀 Disruption Analysis – Bearish Alternative Scenario
The current chart suggests a bullish continuation from the consolidation zone around $107,300–$107,500, with a projected move toward $108,500+. However, the following bearish disruption could invalidate that path:
---
🔻 Bearish Disruption Possibility:
1. False Breakout Trap:
If price briefly spikes above the consolidation zone and quickly reverses, it could trap breakout buyers.
A failed bullish move around $107,800–$108,000 would be the first bearish signal.
2. Weak Volume Confirmation:
Lack of volume during the breakout would signal lack of institutional interest, increasing downside risk.
3. Break Below Support Zone:
If BTC breaks below $107,000, it would signal a loss of momentum and invalidate the bullish scenario.
This breakdown may lead to a quick move toward $106,000 or even $105,800, the recent swing low.
4. Macro Influence:
Any negative U.S. economic data or regulatory news could spark bearish sentiment and accelerate the drop.
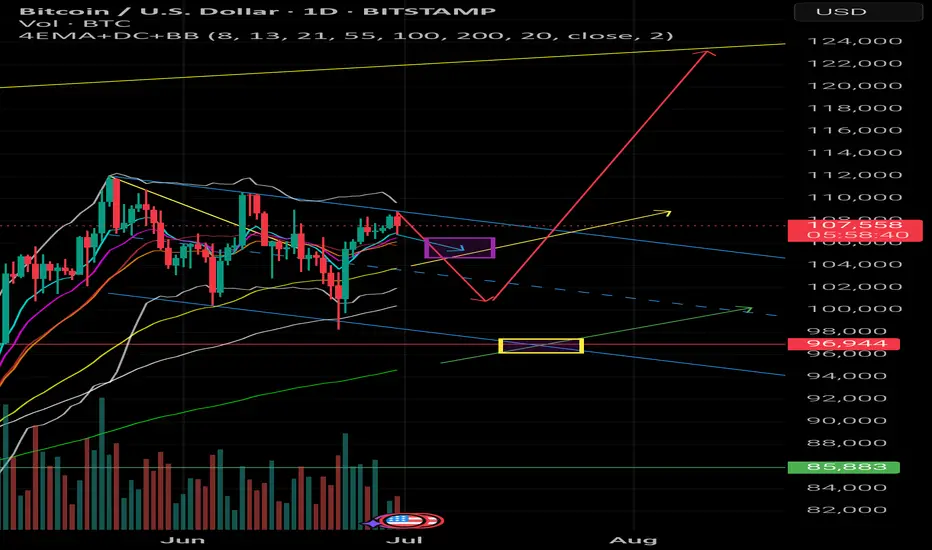
Bitcoin’s Breathing Zone – Watching for a Natural Snap Setup📊 Bitcoin Daily – Probabilistic Swing in Play
Tracking the Snap Zone & Energy Reset
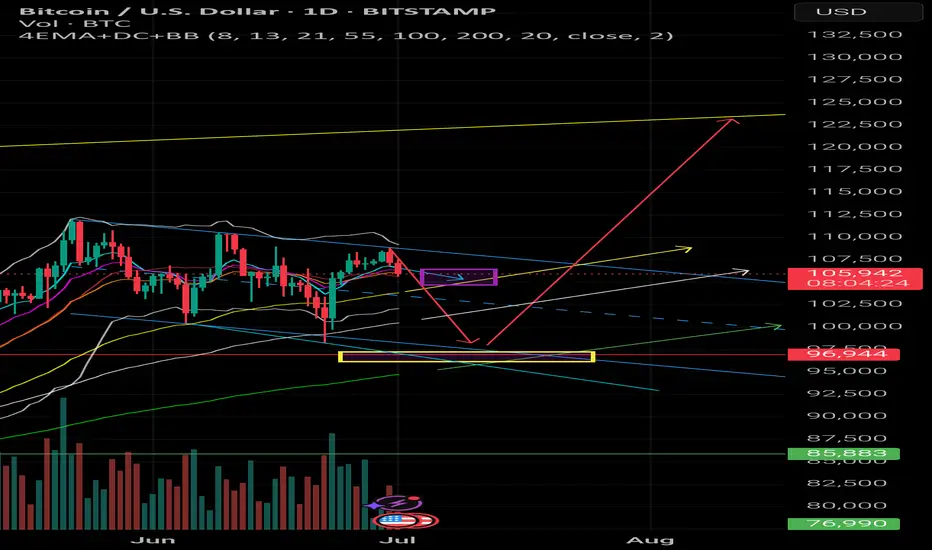
I’m watching a probabilistic swing scenario on Bitcoin where the price might need to dive into the 100k - 101k zone to build enough energy for the next major move.
The key area I’m tracking is the EMA 200 on the daily chart (~95k - 97k).
This would be the natural deep target if the price sweeps lower. The EMA 200 often acts as a long-term support where markets "reset" and gather strength.
👉 It’s also worth noting: Institutional traders traditionally view the daily EMA 200 as a key buy zone in an overall bullish market structure.
That’s where many large players reload positions, aiming to ride the next expansion wave.
What I’m expecting:
A retracement into 100k - 101k to snap the short EMAs together.
A potential liquidity sweep below the EMA 100, possibly down to the EMA 200 zone.
Key bullish signals: wick rejections, strong bounce candles, and engulfing patterns on the 4h or daily.
This would set up the energy for a clean bounce and a probable move towards the upper yellow trendline around 124k.
Without this deeper retracement, the move would likely run out of steam earlier, probably capping out around 112k.
I trade probabilistic scenarios based on natural price swings, EMA wave dynamics, and energy compression zones.
📌 Chart and path idea attached.
What’s your view? Are you watching this zone?