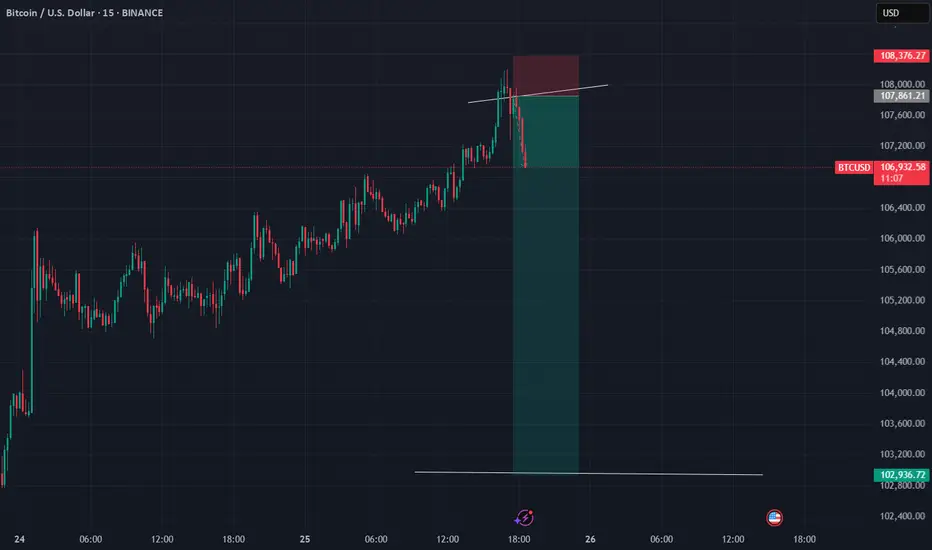
Bitcoin may rebound from support line of wedge and start to growHello traders, I want share with you my opinion about Bitcoin. Initially, the price was trading inside a well-defined range, moving sideways with repeated rejections from both support and resistance. After several attempts to stay above the support zone, BTC finally broke down and sharply declined below the 104000 level, entering the buyer zone. However, the decline was short-lived. Price quickly rebounded from the lower boundary and formed a strong bullish candle, suggesting that buyers were still active. After this recovery, BTC began forming a wedge pattern, with a gradually narrowing structure between the resistance line and the ascending support line. This kind of price action typically signals a buildup of pressure and potential breakout. Currently, BTC is once again testing the support line of the wedge and hovering near the buyer zone, where it previously reversed. This level has proven significant and is now being retested. Given the current structure, the wedge formation, and price behavior near the support, I expect BTC to rebound from this zone and start climbing back toward the upper resistance area. My current TP 1 is set at 106800 points, which aligns with the mid-level of the previous impulse zone and the inner resistance of the wedge. Please share this idea with your friends and click Boost 🚀
Disclaimer: As part of ThinkMarkets’ Influencer Program, I am sponsored to share and publish their charts in my analysis.
BITCOIN trade ideas

BTC/USD - The Bitcoin Cycle TopBTC has recently broken below a key uptrend line that had been guiding price for some time. I’m watching for a potential backtest of that broken trendline, a rather classic move that could set the stage for a final upwards squeeze, possibly printing a quick higher high to trap late longs.
I’m watching the circled area closely as a potential exhaustion zone. Key levels and price action around the trendline will be critical, breaking of upwards trendlines after backtesting may mark the beginning of the larger unwind.
We could see multiple backtests of the broken trendline over time, with the trendline now likely acting as resistance.
Note: I’m publishing this idea simply to have a timestamped record. This post is my way of putting a clear marker in the sand. I’m not looking to debate or go deeper into the reasoning, and I generally won’t be responding to comments.

BTCUS pullback before bullish continuation.Here we can see the trend is still bullish, however a potential pullback back to around 105000 is expected. Lets gooo!!!
BTC/USD BUY 22/06/2025🇺🇸 This trade setup offers a strong buying opportunity, supported by several technical confluences. We observe a retest of the lower boundary of a descending range within a broader bullish trend, reinforced by a bullish RSI divergence and the presence of a key support zone. The strategy is to wait for a potential retest of the range low before entering a long position around the \$100,000 to \$101,000 area, with a stop loss set at \$98,000 to manage risk. The target (TP) is set at \$110,000, aiming for a risk-to-reward ratio (RR) greater than 3, which makes this setup highly attractive in terms of risk management.
From a fundamental perspective, this bullish bias is further supported by growing institutional interest and an uncertain macroeconomic environment, marked by inflation and geopolitical tensions. These factors continue to drive demand for alternative assets like Bitcoin as a store of value.

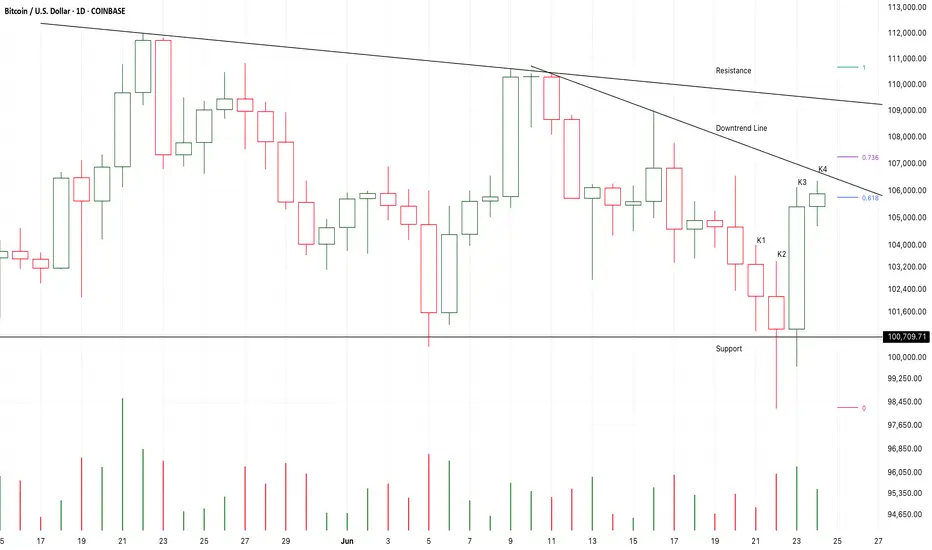
Chart Pattern Analysis of Bitcoin.
K4 close at high price area, but still failed to close upon the downtrend line,
If K5 close upon the line,
The strong bullish momentum will be verified here,
And the market will accelerate to test or break up 112K area.
It is also possible that the market consolidate around the downtrend line,
And days later, it chose to break up or fall down.
If I didn’t bought it earlier,
I will not buy it here.
It is still possible that the following candles fall to test 101K or 103K area.
I will try to buy it there.
#Bitcoin - Pivot is $102915 | Target $125385 or $80445 ?Date: 24-06-2025
#Bitcoin
Current Price: 105375
Pivot Point: 102915.00 Support: 99206.48 Resistance: 106655.63
#Bitcoin Upside Targets:
Target 1: 111205.31
Target 2: 115755.00
Target 3: 120570.00
Target 4: 125385.00
#Bitcoin Downside Targets:
Target 1: 94640.74
Target 2: 90075
Target 3: 85260
Target 4: 80445.00
Cup and Handle Hello Traders 👋 — Hope you're having a strong start to the week!
Let's dive into the BTCUSD Daily Chart 📈 — we’re looking at a Cup and Handle setup that's matured beautifully.
🔵 Price carved out a clean rounded base (cup), followed by a consolidation handle right below resistance.
🟠 The 200 SMA is holding as dynamic support.
⚡️ A confirmed break above 109K could launch price toward 130K+, with clear Fibonacci extension targets in sight.
Key Zones:
Handle Support: 100,472
Breakout Line: 109,360
Main Target: 130,867
Extended: 136K–144K
Structure ✅ | Momentum Building ⚡ | Risk Managed 🎯
Stay sharp, stay patient. Structure first — breakout next.

BTCUSD HTFBitcoin is a decentralized digital currency that you can buy, sell and exchange directly, without an intermediary like a bank. Bitcoin’s creator, Satoshi Nakamoto, originally described the need for “an electronic payment system based on cryptographic proof instead of trust.”
Every Bitcoin transaction that’s ever been made exists on a public ledger accessible to everyone, making transactions hard to reverse and difficult to fake. That’s by design: Core to their decentralized nature, Bitcoins aren’t backed by the government or any issuing institution, and there’s nothing to guarantee their value besides the proof baked in the heart of the system.

Bitcoin are heading to 114k or 92k A quick little analysis on BTC, we can either push up higher to 114k levels breaking new highs is a must for price action to validate bill swing. However if we break a couple lows be prepared for 92k run down
Kris/ Mindbloome Exchange
Trade Smarter Live Better

BTCBTC will be moving sideways and a drop for the next few days.
Disclosure: We are part of Trade Nation's Influencer program and receive a monthly fee for using their TradingView charts in our analysis.

Bitcoin Price Chart Analysis (30-Min, BITSTAMP🔍 Key Observations:
1. Resistance Zone (106,500–107,000):
Price is testing a strong horizontal resistance area, marked by the green rectangle.
This zone has acted as resistance multiple times (highlighted with orange circles), suggesting supply pressure.
2. Triple Top Formation:
The three orange circles mark failed breakout attempts at the resistance level, forming a triple top pattern, a bearish reversal signal.
Each top is followed by a price drop, showing seller dominance near this zone.
3. Current Price Action:
Price is currently at 106,777, near the resistance peak again.
A downward arrow points to a projected target of 104,399, implying a potential short-term bearish move if rejection happens again.
4. Support Zones:
104,399 is marked as a short-term target and potential support level.
A major support zone also exists around the 100,000 level, indicated by the green horizontal box and upcoming economic events (red/blue news icons).
5. Trendlines & Patterns:
Earlier trendline breakouts (rising wedge and falling wedge) led to short rallies and corrections.
The most recent bullish move seems to be losing momentum at this resistance.
---
📉 Conclusion:
The chart suggests a bearish bias in the short term unless Bitcoin breaks and holds above the 107,000 resistance level.
If rejected again, the price may fall toward the 104,399 target, and possibly lower if bearish momentum strengthens.
Traders may look for confirmation (e.g., bearish candlestick patterns, volume drop) before entering short positions.

BUY BTCUSDBitcoin (BTC/USD) is showing signs of a strong bullish reversal off a major demand zone at $98,000.**
If price holds above this level and confirms with continued bullish candles, the likely trajectory is toward the resistance zone around $110,000–$111,200.
The forecast structure suggests a clean trend recovery pattern. However, manage risk tightly — as a breakdown below the demand zone could flip the narrative to bearish.

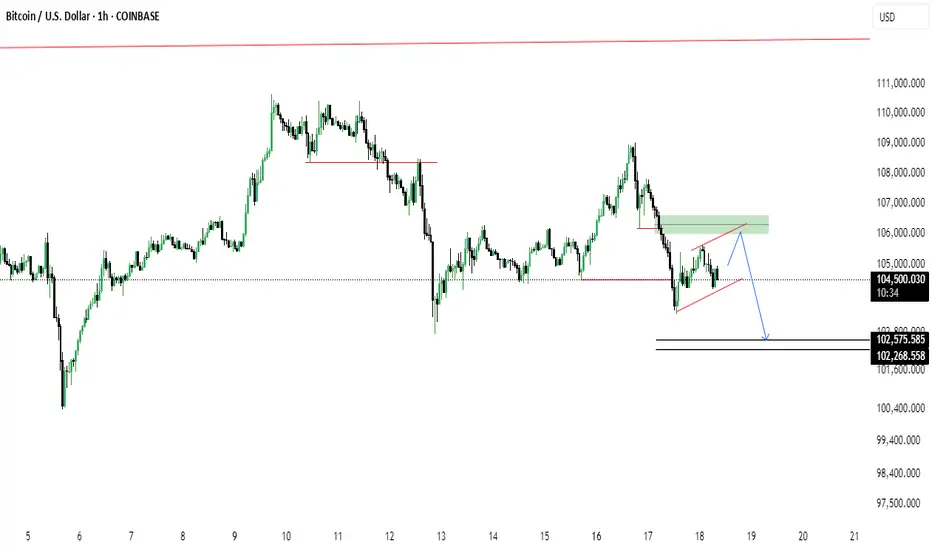
BTCUSD 4-Hour Analysis – Sell Setup IdeaCurrently, the trend on BTCUSD is bearish. On the 4-hour chart, I’m watching for a reaction at the Balanced Price Range (BPR) zone. This area aligns with a daily Rebalanced Breaker (-RB), adding higher time frame confluence.
In addition to the BPR, there’s an Order Block (OB) within the same region, and a nearby swing high, which strengthens the case for a bearish reaction. If price respects this zone, I expect continuation to the downside targeting the 98,000 and the 96,000 price level.

Thief Trader Setup: Robbing the BTC/USD Market Reversal🏴☠️💰 Bitcoin Heist Blueprint: BTC/USD Robbery Plan by the Thief Trader Crew 💰🏴☠️
(Swing & Day Trade Outlook – Clean Entry, Clean Exit, No Fingerprints Left Behind)
🌟 Hi! Hola! Ola! Bonjour! Hallo! Marhaba! 🌟
To All Market Raiders & Silent Money Makers 🤑💸💰✈️
This isn't your average BTC/USD analysis — this is a strategic market heist, crafted from the Thief Trading Playbook.
We're planning a clean operation based on both technical setups and fundamental awareness.
Let’s enter smart, exit faster, and leave no trace — just profit. 🏆
🎯 THE GAME PLAN: Unlocking the BTC/USD Vault
📈 Entry – “The Vault’s Cracked Open!”
The plan kicks off with retest entries on the 15 or 30-minute chart.
Sell limits should be placed around recent highs or lows where market momentum pulls back.
Precision and patience are your tools.
🛑 Stop Loss – Backup Escape Route
Use the 1D swing high/low (e.g., 104.500) as your SL zone.
Position size smartly, factoring in risk %, lot size, and number of active orders.
🏁 Target – 94.000 (Or Bail Out Before It Gets Hot)
Don’t stick around too long — cash out near the zone or before if price slows or traps emerge.
Secure the bag, vanish before resistance bites back.
🧲 Scalpers – Quick In, Quick Out!
Stick to the short side only — short the bounces, trail your SL, and move with stealth.
Big players can strike straight; others can shadow the swing crew and trail behind with protection.
🧠 Why This Works – Market Pulse
BTC/USD is facing overbought pressure, consolidation traps, and is nearing a critical MA Zone where reversals tend to form.
Momentum shows signs of weakening, and the bears are regrouping — that’s where we slip in and out.
Supporting Factors Include:
Macro trends
Fundamental sentiment
COT positioning
On-Chain signals
Intermarket flow
Key psychological levels
🔍 All these build the narrative behind this bearish setup. This is more than just price action — it's a calculated move.
⚠️ Trading Risk Alert: Stay Off the Radar During News Drops 📰🚨
Avoid new entries during major news events — increased volatility = increased risk.
Use trailing stop-losses to lock in profits while staying protected during spikes.
❤️ Like the Plan? Power the Crew!
If this setup helped you see the market differently, hit the 💥Boost Button💥.
Every like supports the effort and helps sharpen our future plans.
Trade with style, move with purpose — Thief Trader Style.
🚀 Stay tuned for the next setup from the shadows. Until then — stay sharp, stay strategic, and always protect your profits. 🐱👤💰📉📈

BTCUSD Descending channel breakout bullish possible from SupportBTCUSD Breakout Alert!
1H Timeframe Analysis
Bitcoin has broken out of the descending channel with a strong bullish candle — signaling a potential reversal from the key demand zone around 103,600.
📈 Technical Targets:
🔹 First Target: 108,000
🔹 Second Target: 110,000
This breakout could offer a solid long opportunity, but as always — manage risk wisely! ✅
💬 What’s your bias?
❤️ Like | 🔁 Share | 💭 Comment
📲 Join us for more real-time updates and insights!
#BTC #Bitcoin #CryptoTrading #TechnicalAnalysis #Breakout #BullishMomentum

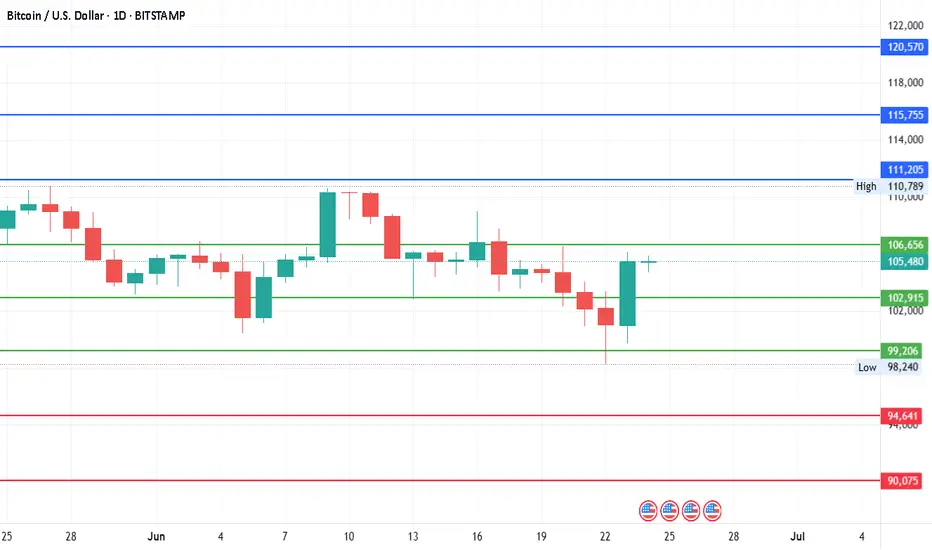
BTC/USD Rising Wedge Breakdown Ahead?Bitcoin shows signs of a potential bearish reversal as price forms a rising wedge beneath a key supply zone. After a recent drop, price is retesting the 106k area (green zone), possibly setting up for continuation to the downside.
🔹 Rising wedge pattern near resistance
🔹 Bearish retest at previous support turned resistance
🔹 Potential drop targets: 102,575 and 102,268
🔹 Break below wedge support could accelerate the fall
BITCOIN Is this just a giant Bull Flag??Bitcoin (BTCUSD) saw a strong sell-off yesterday in the aftermath of the U.S. strike in Iran and fears of retaliation, but in later hours recovered some of the lost ground. The recovery is being extended into the Asian and early E.U. hours today and the emerging Channel Down pattern already draws strong similarities with the one in December 17 2024 - January 13 2025.
Both broke below their respective 1D MA50 (blue trend-lines) to form a Lower Low, which in the case of Jan 2025, it initiated a rebound that tested the All Time High (ATH) Resistance. See also how similar their 1D RSI patterns are, testing the same Support level too (41.20).
Given that this time the uptrend has been much shorter since the April 07 2025 Low, this Channel Down may be nothing but a giant Bull Flag in the middle of a standard Bull Cycle Leg. Until confirmed with a 1W candle closing above the ATH Resistance though, the medium-term Target is $111900.
Notice also the formation today of a 1D MA100/200 Bullish Cross, the first since November 13 2024.
So what do you think? Is $111900 your short-term Target? Feel free to let us know in the comments section below!
-------------------------------------------------------------------------------
** Please LIKE 👍, FOLLOW ✅, SHARE 🙌 and COMMENT ✍ if you enjoy this idea! Also share your ideas and charts in the comments section below! This is best way to keep it relevant, support us, keep the content here free and allow the idea to reach as many people as possible. **
-------------------------------------------------------------------------------
💸💸💸💸💸💸
👇 👇 👇 👇 👇 👇

BTCUSD – Price Approaching The Edge of the Channel📍 BTCUSD – Price Approaching The Edge of the Channel
Bitcoin has surged sharply from the lower boundary of its descending channel and is now reaching another “Edge” — the upper resistance line.
🎯 Two Key Scenarios:
🟩 Bullish Breakout: A clear breakout above ~$108,000 with strong volume could initiate a new leg toward $111K and beyond
🟨 Bearish Rejection: Failure to break the channel may lead to a corrective wave back toward $103K or lower
This is a classic "decision point" — where market structure and momentum meet supply and resistance.
—
#BTCUSD #Bitcoin #CryptoTrading #TechnicalAnalysis #PriceAction #TheEdge #ChannelTrading #EMA #BitcoinResistance #MJTrading #CryptoSetup #SwingTrade #MarketStructure #BreakoutOrRejection #KeyLevel #TrendWatch

103 to 101K trade and reverse H&S patternMorning folks,
So, our Thu setup is done perfect, both targets are met and even more. Now we consider two different fast trades on BTC.
Now context remains bearish and 103K is rather strong 4H resistance area. So, first trade is scalp "Sell" from ~ 103K with "at least" target of 101K. In fact, choosing of 101K as a minimal target is based on the 2nd trade.
2nd trade is potential reverse H&S is sentiment on the market will start changing. But this is not the fact yet. That's why I place downside arrow here as well, if H&S will not be formed or start failing, BTC could drop lower so, downside trade might be even better.

BTC: neutral case analysisBITFINEX:BTCUSD
Hello
Based on last 3 bull cycles and bear cycles, I did some calculations and this pattern is the result of it.
Take it with a pinch of salt, this might not even be close, but just past data gives me this fractal.
Here are the peak Bitcoin (BTC) prices for the years you mentioned:
2013: $1,156
2017: $19,497
2021: $67,566
We can now treat these as the values of the quadratic function:
a=1156 (for year 2013)
b=19497 (for year 2017)
c=67566 (for year 2021)
However, to apply the formula:
Price(x) = a⋅x2 + b⋅x + c
Using a quadratic fit to the BTC peak prices in 2013, 2017, and 2021, we get the following estimated prices:
2017: $19,497 (matches actual)
2021: $67,566 (matches actual)
2025: $145,363
Above is the AI calculation, I think it is about right.
Happy trading
Cheers

Bitcoin - We have to see new highs now!Bitcoin - CRYPTO:BTCUSD - is now at the previous highs:
(click chart above to see the in depth analysis👆🏻)
It could really not be more exciting on Bitcoin at the moment. With the current "all or nothing" potential breakout or double top creation, we will either see a bullrun or a bear market. So far, bulls are still strong, so the chances of a breakout luckily remain higher.
Levels to watch: $100.000
Keep your long term vision!
Philip (BasicTrading)

BTC Weekly Outlook - paving the wayBTC Weekly Outlook
In this week's forecast, we're observing a structured plan grounded in historical monthly Bitcoin data and liquidity dynamics. With MH (Monthly High) and ML (Monthly Low) clearly marked, this scenario outlines a potential roadmap for price action through short-term liquidity movements and higher timeframe rebalancing.
Phase 1: Retrace to 4H BPR and Weekend Liquidity (Green Path)
The first part of the projection anticipates a minor upward move early in the week, ideally on Monday or Tuesday. This rally would target the 4H Bearish Price Range (BPR) and weekend liquidity, which are areas where price often moves to fill orders left unfilled during lower volume periods.
The blue box around the BPR highlights a key short-term zone of interest. Inside it lies the OTE level and the midpoint of the prior range, both typically offering reactions as market participants attempt to position themselves at favorable prices before larger moves unfold. A move into this area would likely be followed by a rejection, setting up for a deeper move lower.
Phase 2: Distribution and Breakdown Toward Monthly Statistical Targets (Orange to Green)
After reacting to the 4H BPR area, the expectation is for a broader move down through the rest of the week. This would take price below ML (Monthly Low) and into deeper liquidity zones where historical data suggests higher probabilities of price interaction.
Two key levels are marked based on monthly performance statistics:
TP1 at the first 90 percent confidence level, where price could pause or consolidate.
FULL TP deeper down, near a liquidity-rich area that aligns with a Weekly Imbalance (W IMB). This would be a logical place for larger participants to begin building longer-term positions.
Phase 3: High Timeframe Discount and Reversal
Once price reaches the imbalance, the projection expects a shift in momentum. This region represents a higher timeframe discount, where order books are more likely to begin filling for longer-term positions.
From here, the green path resumes, suggesting a reversal and a sustained move upward. If this plays out, BTC would:
-Complete a full liquidity sweep below ML
-Accumulate at lower prices where there is room to fill larger buy orders
-Begin a strong push upward, potentially leading toward new all-time highs
This sequence is not only logical from a liquidity perspective but is also statistically supported by how BTC typically behaves around monthly lows and key imbalances. The forecast reflects a market that needs time and space to build positions before initiating the next major leg up.

BTC Short Re-entry with beautifull RR/Stop loss.Who follow our community know this trade story already- We got BE stoppage and now is most beautifull opportunity to make SHORT trade with very good RR / Stop loss.
If we will not see fast De-escalation with Middle East conflict we are going to 93k easy!
#BTCUSDT
We are reentering.
ENTRY: 105586
SL: 107262
TP: 96166.8
Follow me and you will see more and more good trade ideas
Please don't use big leverages and be carefull!
