Bitcoin - Expecting Liquidity Grab at 102.8k Before Relief MoveMarket Context
After a strong rejection from resistance, price has shown clear signs of internal weakness. We recently got an internal liquidity sweep followed by a sharp move down, confirming a shift in momentum. The market is currently compressing just below a key fair value gap, hinting at further downside before any real bullish structure can form
Internal Sweep and Bearish Pressure
The internal sweep acted as a final inducement before the market sold off. The reaction afterward was clean and aggressive, suggesting that smart money is offloading positions into trapped longs. Price has now stalled in a tight range, and the lack of bullish follow-through adds weight to the idea that lower prices are still on the table.
Fair Value Gap Below as Draw
The unfilled imbalance below, lining up near 102.8k, is acting as a magnet. This level has not been tapped and lines up cleanly with the idea of a final liquidity sweep before any retracement. It would make sense to target this zone to clear out remaining liquidity and rebalance price before reassessing.
Retracement Scenarios After the Sweep
Once that low is swept and the gap is filled, we could see a retracement back into the previous fair value gap around 106k. This could either form a lower high, continuing the broader downtrend, or potentially run the high if there's enough momentum. Either way, the reaction from that level will offer the next major clue on direction.
Key Expectation
Until the low around 102.8k is swept, the bearish narrative remains intact. The cleanest setup would be a liquidity run into that level followed by a reaction that leads us higher, ideally back toward the 106k zone. From there, we’ll watch how price behaves to decide whether a deeper correction or a trend continuation is in play.
Conclusion
Still leaning bearish short-term as long as that gap and low remain unfilled. Once we tap into the 102.8k area, I’ll be watching for a shift that could give us a play back into the 106k gap. It’s all about liquidity, structure, and the cleanest path for smart money to move.
Disclosure: I am part of Trade Nation's Influencer program and receive a monthly fee for using their TradingView charts in my analysis.
Thanks for your support!
If you found this idea helpful or learned something new, drop a like 👍 and leave a comment, I’d love to hear your thoughts! 🚀
BITCOIN trade ideas

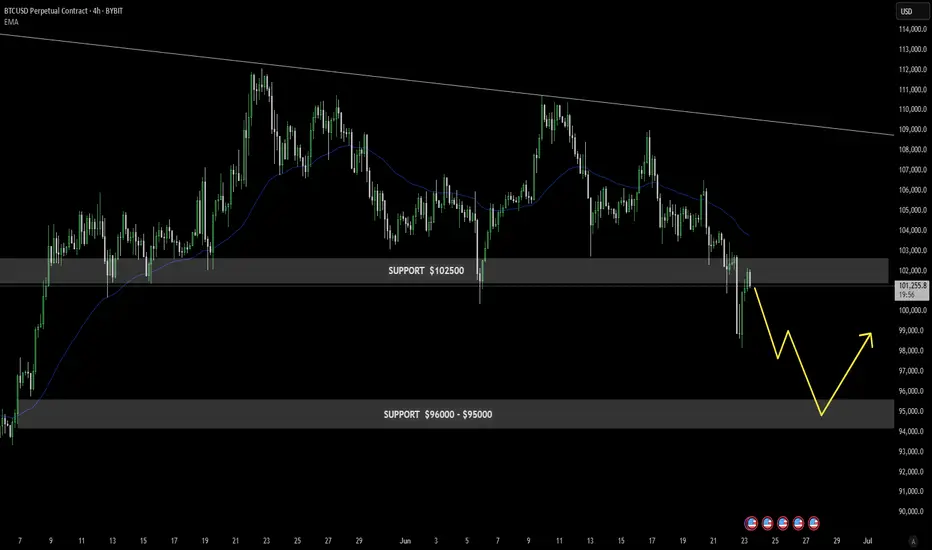
Bitcoin at the Edge: Breakdown or Bounce?Bitcoin is currently trading around $101,210, having failed to reclaim the $102,500 support zone, which has now flipped into resistance.
This rejection confirms continued bearish momentum, as reflected in the downward-trending EMA.
The next major area of interest lies between $96,000 and $95,000, where buyers previously stepped in. The chart suggests a probable move lower into this zone, followed by a potential bounce.
Unless BTC reclaims $102,500 with strong conviction, the short-term bias remains bearish, with traders eyeing the lower support for possible reversal or accumulation.
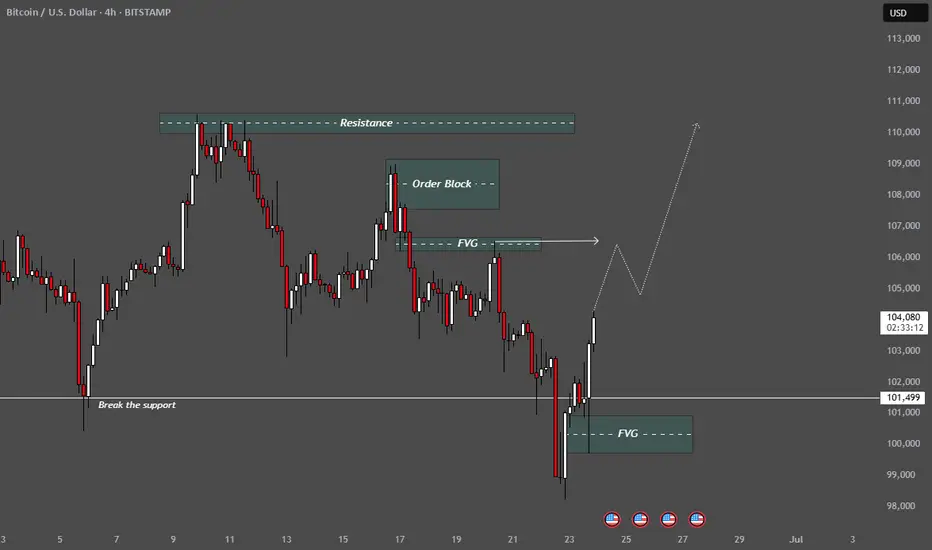
Liquidity grab below support, FVG and OB structures,1. Support & Resistance Levels
Resistance Zone (highlighted at the top):
Around the 110,000–112,000 range.
Previous Support (horizontal line at 101,499):
Labelled as “Break the support” — price had broken below it but is now pushing back above.
📦
Smart Money Concepts (SMC):
2. Order Block (OB)
Marked near 105,000: A key supply area where institutional activity likely occurred. Price may react here (retest or rejection).
3. FVG (Fair Value Gaps)
Two zones marked as FVG:
Lower FVG around 100,000–101,000: recently filled and acted as support.
Upper FVG just above 105,000: potential target zone before price pushes higher.
📈
Projected Price Path:
The dotted white line shows a bullish forecast:
Price breaks back above the previous support.
Pulls back into the FVG or OB.
Then rallies toward 110,000+ resistance zone.
🧠
Interpretation:
This analysis suggests a bullish reversal scenario based on:
Liquidity grab below support,
FVG and OB structures,
Expectation of institutional buying and upward continuation.
Bitcoin / U.S. Dollar 4-Hour Chart (BTCUSD)4-hour candlestick chart displays the price movement of Bitcoin (BTC) against the U.S. Dollar (USD) as of June 23, 2025, 03:45 PM CEST. The chart shows a recent sharp decline from a peak of approximately 104,443.81 USD to around 100,479.47 USD, with a current price of 102,035.20 USD, reflecting a 1.037.09% increase. Key levels include resistance around 104,000 USD and support near 100,000 USD, with notable volatility indicated by the candlestick patterns and a marked low point adorned with U.S. flags and a lightning bolt symbol.

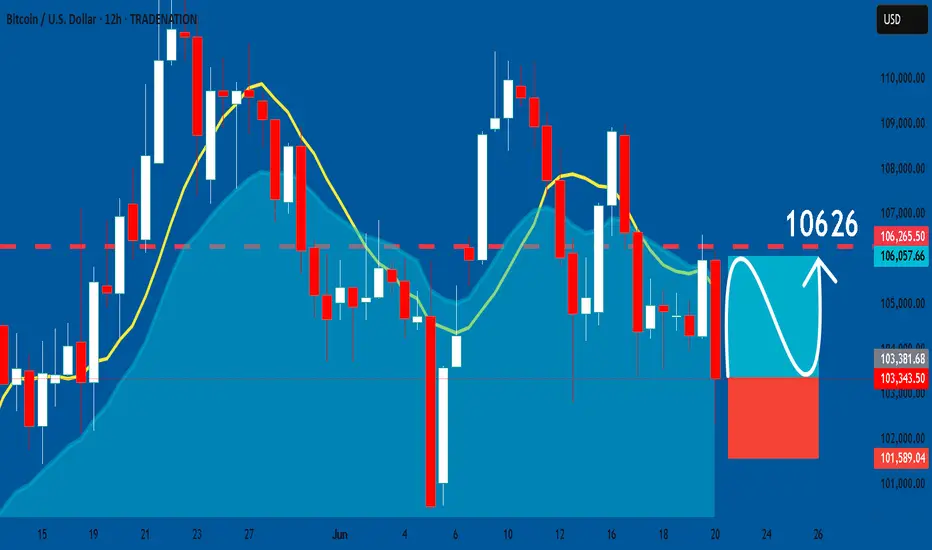
BTCUSD: Trading Signal From Our Team
BTCUSD
- Classic bullish formation
- Our team expects pullback
SUGGESTED TRADE:
Swing Trade
Long BTCUSD
Entry - 10334
Sl - 10158
Tp - 10626
Our Risk - 1%
Start protection of your profits from lower levels
Disclosure: I am part of Trade Nation's Influencer program and receive a monthly fee for using their TradingView charts in my analysis.
❤️ Please, support our work with like & comment! ❤️
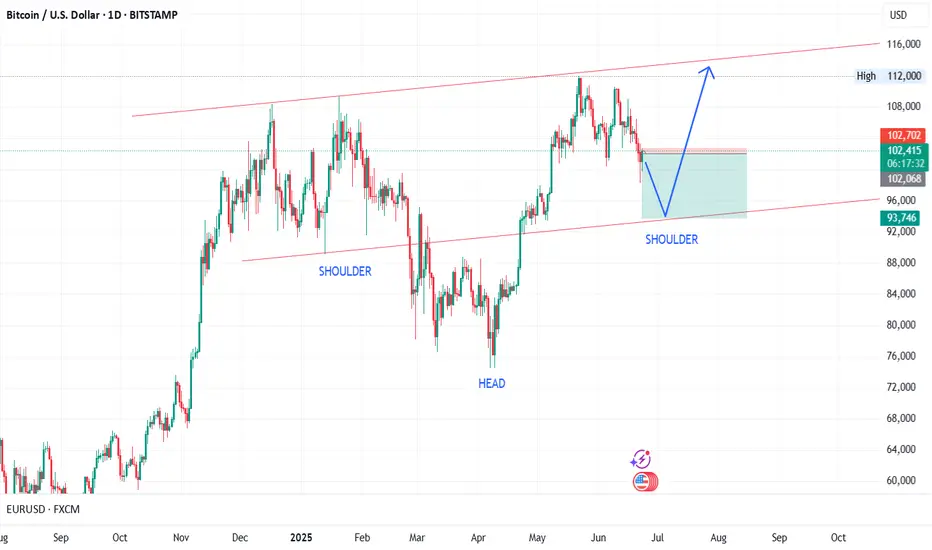
BTC short because head and shoulders pattern.It shows a baseline with three peaks with the middle peak being the highest. The head and shoulders chart pattern depicts a bullish-to-bearish trend reversal and it signals that an upward trend is nearing its end.
BTCUSD SELLSMajor H4 zone has been broken and retest is being made. Possible for price to continue further down to next support zone around 96,000

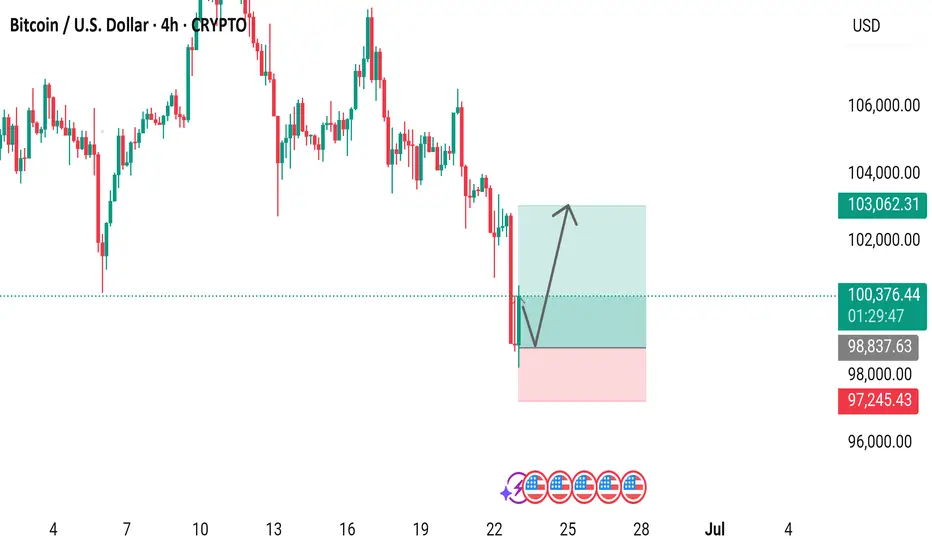
Bitcoin Price Analysis: Potential Rebound Ahead?4-hour Bitcoin price chart reveals a potential rebound opportunity. After a sharp decline, the price has stabilized around $97,245.43, forming a support level. The green and red box annotations suggest a possible price range breakout, with an upward arrow indicating a potential price increase. The current price stands at $100,461.58, down 1.63% from its recent peak. Will Bitcoin bounce back or continue its downward trend?
BITCOIN SENDS CLEAR BULLISH SIGNALS|LONG
BITCOIN SIGNAL
Trade Direction: long
Entry Level: 104,672.03
Target Level: 107,484.65
Stop Loss: 102,785.72
RISK PROFILE
Risk level: medium
Suggested risk: 1%
Timeframe: 3h
Disclosure: I am part of Trade Nation's Influencer program and receive a monthly fee for using their TradingView charts in my analysis.
✅LIKE AND COMMENT MY IDEAS✅

Bitcoin (BTC): Buyers Took Back Control Over $100KBitcoin has bounced and showed some buyside volume near major support area near $100K. After the re-test of 100EMA where price dipped lower than $100K we have had a decent recovery every since.
Monday is starting strong with price jumping back above $100K and most probably we will see some fruther buyside dominance from here.
Swallow Academy

BTC/USD:Intraday Trading Analysis and StrategyI. Daily Chart Trend Analysis
On the daily timeframe, BTC/USD closed with a small bearish candle yesterday, forming a consecutive series of bearish candles that clearly indicate a downtrend. The price continues to trade below the moving average system, and the technical indicators have formed a death cross, further confirming the bear-dominated market structure. However, in this clear downtrend, two key risks require attention:
1.Oversold rebound risk: After sustained declines, the market may experience a significant corrective rally.
2.Priority of risk control: Regardless of market movements, strict stop-loss management and position sizing remain core trading principles.
II. Hourly Chart Technical Analysis
The hourly chart shows that the price fell sharply under selling pressure during U.S. trading hours yesterday, breaking below the key $100,000 level. This morning, the price rebounded strongly after hitting a low, with the breakdown level near $102,700. Currently, the K-line forms a large bullish candle, and the technical indicators have formed a golden cross, suggesting that a corrective rally is likely to continue today. Note that if the price breaks above the breakdown level of $102,700, the short-term downtrend may be disrupted, and the market could shift to a range-bound pattern.
BTCUSD
sell@102000-102500
tp:101000-100500
I am committed to sharing trading signals every day. Among them, real-time signals will be flexibly pushed according to market dynamics. All the signals sent out last week accurately matched the market trends, helping numerous traders achieve substantial profits. Regardless of your previous investment performance, I believe that with the support of my professional strategies and timely signals, I will surely be able to assist you in breaking through investment bottlenecks and achieving new breakthroughs in the trading field.

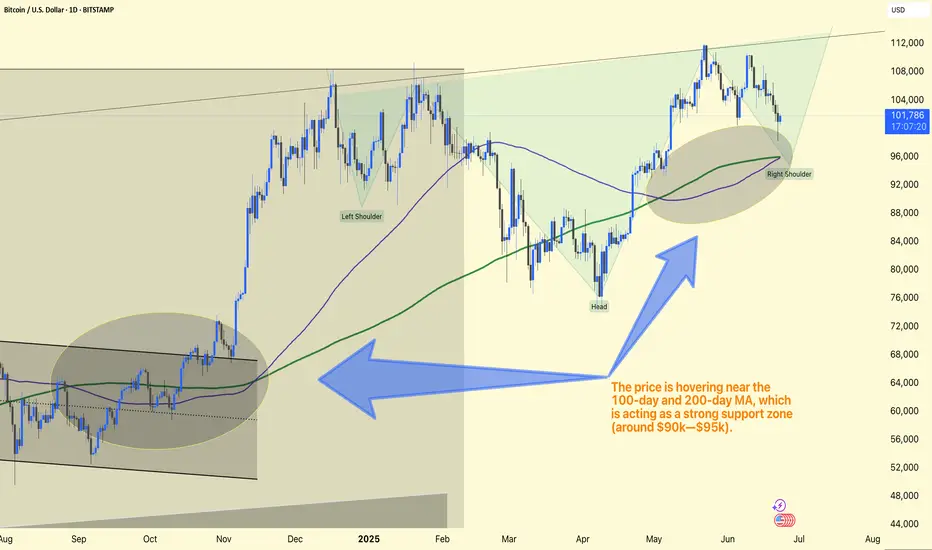
BTC/USD Analysis Update. Chart Pattern:
The chart clearly shows an Inverse Head & Shoulders structure:
Left Shoulder
Head
Right Shoulder
This is a strong bullish reversal pattern.
Moving Averages:
Price hovers near the 100-day and 200-day MA, acting as a strong support zone (around $90k–$95k).
This area is critical for sustaining long positions.
Expected Move:
Strong bullish potential towards the $113k–$115k zone, aligned with the upper trendline target.
RSI also suggests room for a bullish recovery from this zone.
Trade Plan:
Ideal Entry: Near $90k–$95k (Right Shoulder area)
Stop Loss: Just below $88k
Target: $113k–$115k
This structure is very favorable for long positions if the price confirms strength within the right shoulder zone.
BTC GLOBAL M2 LAG - NEXT TARGET 140K +The chart shows Global M2 on a 12-week lag. Notice how closely BTC price aligns. If current trend continues, we should see 140k or so by September.

Bitcoin Holds $100k as Risk Assets Shrug Off Mideast TensionsWeakness in risk assets has been relatively contained so far on Monday in Asia, despite the escalation in geopolitical tensions in the Middle East over the weekend—including in bitcoin.
Yes, it’s down, but not by any margin that sets this open apart from the usual. And having bounced after a brief dip below the psychologically important $100,000 level—which also doubles as wedge support—it’s generated a potential long setup if risk appetite improves.
Longs could be considered above $100k with a stop beneath today’s low to protect against a reversal. Targets include $102,500, $106,500 or even $109,000, depending on your preferred risk-reward.
While momentum signals are neutral to mildly bearish, the price action so far has been constructive for the setup.
Good luck!
DS

Altseason AnalysisTo determine whether we're approaching a true Altseason, we're analyzing the macro relationship between Bitcoin Dominance (BTC.D) and Total 2 (the total crypto market cap excluding Bitcoin). This comparison has consistently revealed where capital is flowing and helps signal shifts in market cycles.
Current Market Structure
BTC Dominance: Currently at 64% and testing resistance zone.
A breakdown below 57% could trigger fresh capital rotation into alts.
Total 2: Hovering near 1.2T ; watching for breakout confirmation.
What Triggers an Altseason?
BTC stability or slow upward grind: Altcoins thrive when Bitcoin is stable not crashing, not parabolic.
BTC.D Breakdown: Often the first real signal. Look for confluence with Total 2 breakout.
Capital Rotation: Watch Ethereum and majors big cap — they usually lead before microcaps follow.
BTC.D Breakdown: Often the first real signal. Look for confluence with Total 2 breakout.
$5 Trillion??
Breakout above $1.7T ATH in Total 2 opens the door for exponential price discovery.
Key resistance zones: $2T → $3.5T → $5T
Watch for volume surge + BTC.D breakdown for strong confirmation.
Caution:
Not every BTC.D dip leads to an Altseason fakeouts happen. Confirm with Total 2 strength and sector rotation.

Bitcoins next stop, $93-96k?I think we will go lower to test the area below on the daily chart where the quarterly anchored vwap and 200ma are both hanging out together. I will be watching for direction at this level based on price action when we get there. Not financial advice.

$BTC Heading to the Long-Awaited 200DMA Retest ~$96kFULFILL THY PROPHECY 📖
CRYPTOCAP:BTC making its way down to the long-awaited 200DMA retest, which just so happens to show confluence with the .618 Fib level at $96k.
RSI shows a bit more room to the downside as well.
Make sure to get those bids in!

BITCOIN is under 100kWeekly double top in June(correction month) with a bearish divergence. BTC is now under 100k using the scare of WW3 as the catalyst…this is a major psych level!

BTC weekly sellon large timeframe BTC going to area between 70k and 6ok because we are now in correction period.

BTC / USDT - Short Set-UpEvening friends,
Looks like a probable idea, since we're just printing a lower low.
I shorted it already, lets see it play out.
Trade thirsty, my friends!

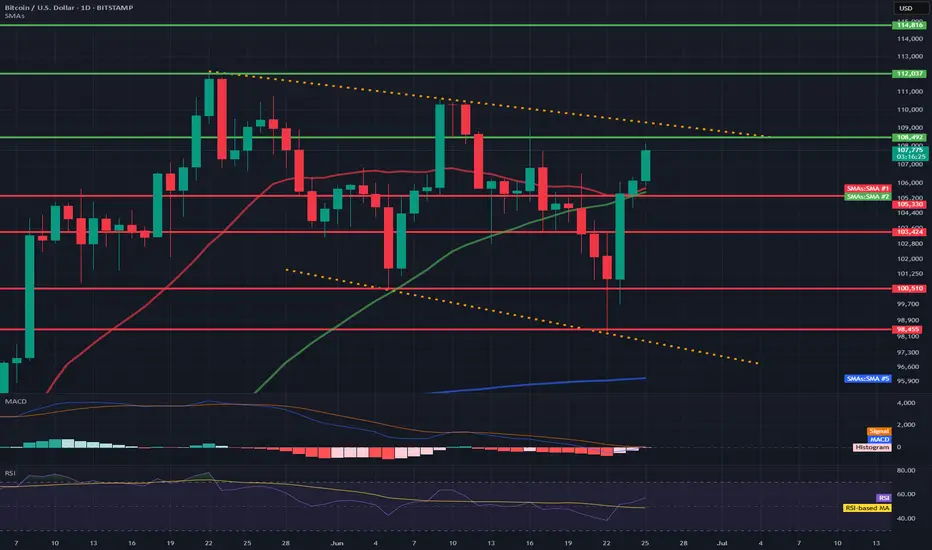
BTC/USD 1D Chart📊 1. Technical formation: Downtrend channel marked with orange lines
Upper trend line (resistance): ~108,200 – 110,000 USD
Lower trend line (support): ~98,455 – 97,000 USD
➡️ Such a formation usually ends with a breakout. The direction of the breakout will be key – currently, the price is testing the upper resistance line.
💵 2. Support and resistance levels
📈 Resistance:
108.202 – currently tested
112.037 – psychological level
114.816 – local top
📉 Support:
105.300 – SMA 50 + local support
103.424 – local lows
100.510 – key psychological support
98.455 – lower edge of the triangle
📉 3. Moving averages (SMA)
SMA 50 (green): currently as dynamic support (~105.300)
SMA 200 (blue): far below the price (~96.000), inactive in the short term
SMA 20 (red): price broke through it upwards – a signal of bullish strength
➡️ A bullish crossover took place between SMA 20 and SMA 50 → bullish signal.
📉 4. MACD (Momentum)
MACD line is approaching the intersection with the signal line from below.
The histogram is becoming less and less red → a potential intersection and a bullish crossover signal may occur any day now.
📉 5. RSI (Relative Strength Index)
Currently: 57.19
RSI is rising and approaching the overbought zone (70), but it is not overheated yet.
Exceeding 60 would be a signal of further bullish strength.
🔍 6. Volume and context
There is no volume marking on the candles, but:
The current bullish candle is strong and breaks through the key averages (SMA 20, 50).
This indicates buyer activity with technical support.
🟢 Bullish scenario (if a breakout occurs up)
A breakout above 108.200 with a close of the daily candle could open the way to:
112.037 (next resistance)
then even 114.816
🔴 Bearish scenario (false breakout)
A rejection from 108.200 and a drop below 105.300 → a possible return to:
103.424 or even 98.455 (lower triangle line)
Wyckoff Structure Targets 92K–94K Retest Before Continuation!A rare and highly instructive market structure is currently unfolding, presenting a textbook case of Wyckoff pattern integration across multiple timeframes.
Over the past weeks, I’ve been tracking a series of smaller Wyckoff accumulation and distribution patterns nested within a larger overarching Wyckoff structure. Each of these smaller formations has now successfully completed its expected move — validating the precision of supply/demand mechanics and the theory’s predictive strength.
With these mini-cycles resolved, the spotlight now shifts to the final, dominant Wyckoff structure — a larger accumulation phase that encompasses the full breadth of recent market activity. According to the logic of Phase C transitioning into Phase D, price appears poised to revisit the key retest zone between 92,000 and 94,000, a critical area of prior resistance turned demand.
📉 Current Market Behavior:
📐 Multiple minor Wyckoff patterns (accumulations/distributions) have played out as expected, both upward and downward — lending high credibility to the current macro setup.
🧩 All formations are nested within a major accumulation structure, now in the final phase of testing support.
🔁 The expected move is a pullback toward the 92K–94K zone, before the markup phase resumes with higher conviction.
📊 Wyckoff Confidence Factors:
✅ All Phase C spring and upthrust actions respected
✅ Volume behavior aligns with Wyckoff principles (climactic action → absorption → trend continuation)
✅ Clean reaccumulation signs within current structure
✅ Institutional footprint visible through shakeouts and well-defined support/resistance rotations
💬 Observation / Call to Action:
This setup is a rare opportunity to witness multi-layered Wyckoff theory in motion, offering not only a high-probability trading setup but also an educational blueprint. I invite fellow traders and Wyckoff analysts to share their interpretations or challenge the current thesis.
➡️ Do you see the same structural roadmap?
Let’s discuss in the comments.

btc still on trackwe are close to my wave 3 target what i posted a year ago. we need 1 push higher for te minimum target wave 3. ofcourse we can extend higher butt than we need to see a good 1.2 forms on the chart.
