BITCOIN Will Move Higher! Long!
Take a look at our analysis for BITCOIN.
Time Frame: 2h
Current Trend: Bullish
Sentiment: Oversold (based on 7-period RSI)
Forecast: Bullish
The price is testing a key support 118,043.14.
Current market trend & oversold RSI makes me think that buyers will push the price. I will anticipate a bullish movement at least to 119,900.74 level.
P.S
The term oversold refers to a condition where an asset has traded lower in price and has the potential for a price bounce.
Overbought refers to market scenarios where the instrument is traded considerably higher than its fair value. Overvaluation is caused by market sentiments when there is positive news.
Disclosure: I am part of Trade Nation's Influencer program and receive a monthly fee for using their TradingView charts in my analysis.
Like and subscribe and comment my ideas if you enjoy them!
BITCOIN trade ideas

Are you ready for the BUY BTCUSD signal?✏️ The pennant pattern is forming. After BTCUSD reached a new peak, the past 1 week, BTC price has been accumulating to form a bullish pennant pattern. This is a bullish continuation pattern that signals when breaking the upper boundary of the flag pattern.
📉 Key Levels
BUY Trigger: Break and trade above 199000
Target 128000
Leave your comments on the idea. I am happy to read your views.

BITCOIN BULLYING Bitcoin hit take profit previously and now I will be looking at another buy within this trend and price action combined with patterns

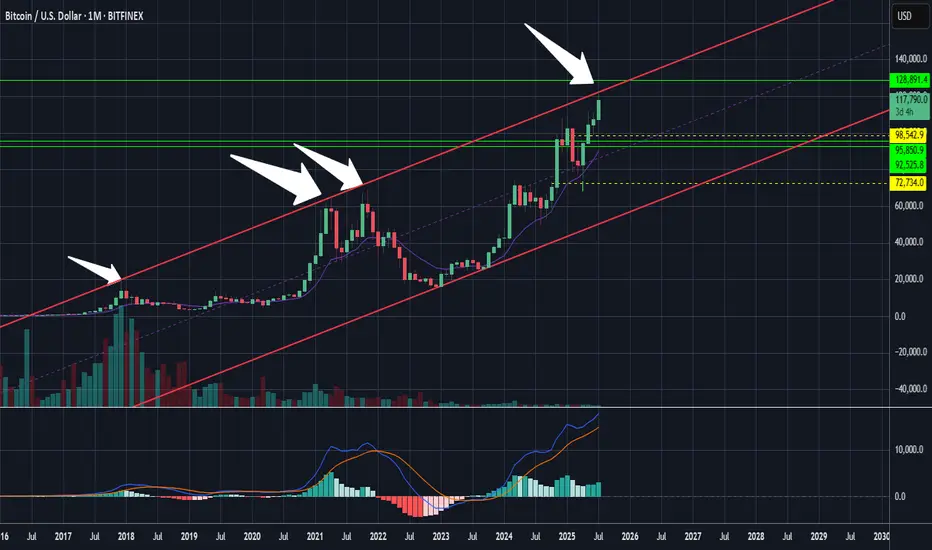
$BTC 2013\2017 vs. 2021\2025bitcoin is exactly repeating the reflection of the 2013-2017 period
zoom out!

BTCUSDT BUYING SETUPBTCUSDT is showing a strong bullish setup as price holds above key support. A bounce from this zone could trigger the next upward move.
Traders should wait for confirmation signals such as bullish candlestick patterns or a break above short-term resistance before entering.
Stay patient, follow the trend, and manage risk properly! 📈🔥

Btc long term targetsOnce Btc & alt coins bottom, the Btc pump to $130K- $140+ is possible.
I would expect a retrace at that point, which would conveniently
bring Btc down to fill a CME gap at $92K (right within the Fib retracement
ratios I would expect). This is just an idea, but wouldn't it be interesting.
Note: This pattern is a fractal

A Legends Continuation. BTCHello I am the Cafe Trader.
Today we are going to look at a trade inspired by the Legendary Trader and Scalper Al Brooks.
If you are not familiar with him I recommend having a strong foundation with price action before giving him a look.
It's no secret that BTC is at levels many thought it would never reach, and yet many others are convinced of 5 - 10x more from this run alone. It can be crushing to feel like you missed out on the move, so instead of getting FOMO, I've detailed a guide to help you in the short or the long term.
Long Term
As of right now you are looking at 4 different levels of demand. It is up to you to measure your conviction, understanding why you want to invest, and how much you are willing to risk. Recognize that Many Big hedge funds have been hesitant with accumulating hoards of Crypto do to its volatile nature, considering it too risky.
So with this in mind, I have given you 4 levels to add BTC to your long term depending on your personal conviction.
Hyper Aggressive = Top of Demand $115,500 (willing to risk 50%)
Aggressive = Demand $99,500-101,250 (willing to risk 40%)
Fair Price = Strong Demand $74,000 - 78,000 (willing to risk 25%)
Steal = Extreme Demand $42,000 - 50,800 (willing to risk 10%)
Thinking about how much you are willing to risk will help you level out your Fear of missing this move, and get pricing that meets your personal demand.
Short Term
My fellow traders, this is a nugget (inspired) from Al Brooks. The "Two Bar Trend Break" .
In a strong trend (not in a range), When you get a trend break (I like to go top of wick to top of wick for this trade), if the second bar doesn't have a huge topping tail, but closes near the top, you can enter this trade.
Here is a trade that happened this month That hasn't filled yet (it got close).
Entry At the close of the second green candle $116,000.
Measure the bottom of the First candle that broke (called the Signal candle) to the top of the second bar that broke (called the Entery Candle). If you take that measurement, and add it to your take profit, you will have a 1R Scalp (1 measure of risk to 1 measure of reward).
This isn't a true scalp, typically they should be in the same bar or next bar, but this follows similar principles.
That's all for BTC, stay tuned for more analysis as we go over Ethereum, XRP, and one more of your choosing.
Happy Trading!
@thecafetrader

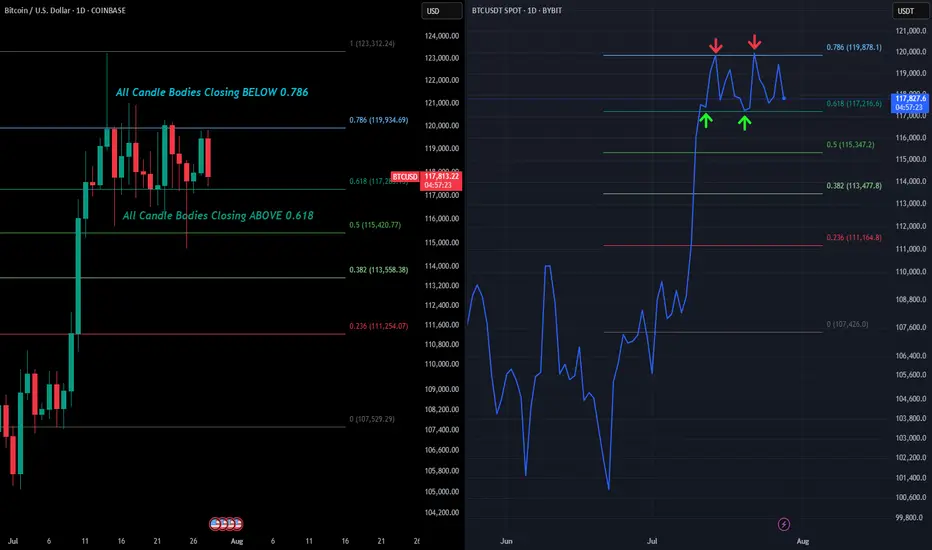
BTC - 1D RangeboundIf you saw our recent post on the warning signs of BTC's weekly chart, we are now going to zoom into the daily and examine how that structure will be decided.
For the last 2 weeks BTC's daily price action has been rangebound between 2 very important levels. The 0.786 (as we have been outline for the past couple weeks) and the 0.618.
So far every rejection (wick high) has happened around the $120.4k level. This is the 1.618 extension target we have had outlined for a while.
And if you look at the actual candle bodies, each has closed below that 0.786 confirming the rejections. The only way to negate this would be to close a daily candle ABOVE the 0.786 which would be over $120k on the Binance chart.
What we have also seen is bulls holding strong support at the 0.618. Everytime we wick below bulls quickly buy it up thus creating our range.
This can clearly be seen by the line chart we have added on the right. The line chart only takes into account candle body closes which shows the perfect bounces between support and resistance.
However if we close a daily candle below the 0.618 $117.2k then that would signal lower price action tests are likely to ensue. Will update this post once we get the confirmation breakout or breakdown from this micro range.
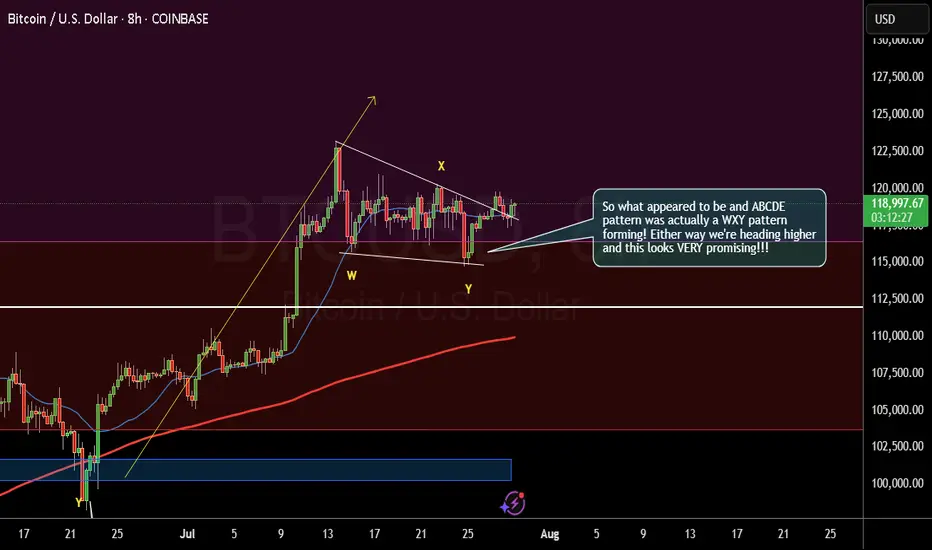
Different Pattern, Same result - Exploding higher!So what appeared to be and ABCDE
pattern a few days ago was actually a WXY pattern
forming! Either way we're heading higher
and this looks VERY promising!!!
Trading balanceTrading balance The price of the asset has rebounded from the balance zone. With the prospect of growth into the resistance zone.

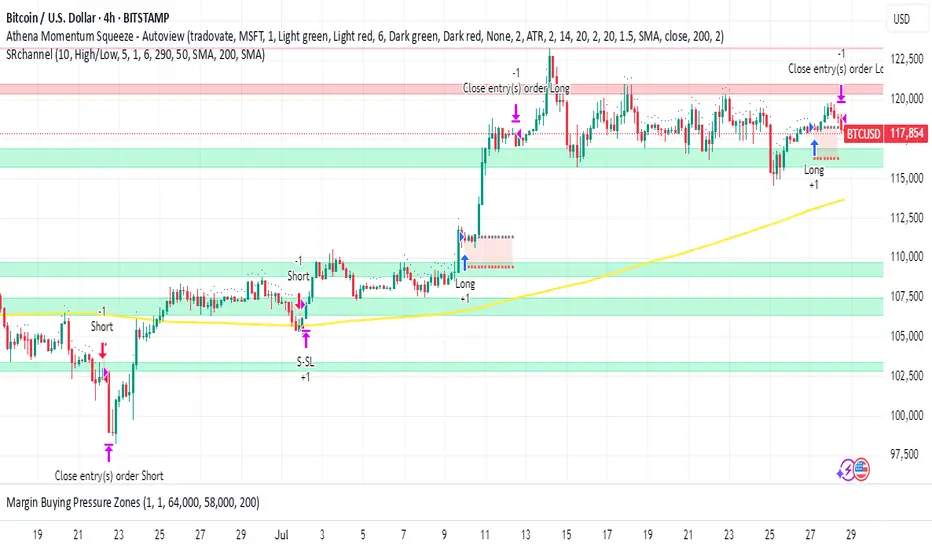
BTCUSD 4HOUR TIME FRAME ANALYSISOverall Structure & Trend
Over the past several 4-hour candles, BTCUSD has carved out a series of higher lows around 116,500–117,000 and higher highs around 120,000–120,500, defining a gentle up-sloping channel.
The current price (118,758) sits just above the middle of that channel, suggesting there’s still room toward the upper trendline before meeting heavy supply.
Key Support & Entry Zone
Primary support lies at 117,200–117,500 (the former swing high from three bars ago), which also aligns with the 50% retracement of the move up from 114,500 to 120,500. That zone offers confluence for the 118,758 entry.
A secondary buffer sits at 116,849 (your stop-loss), just below the channel’s lower boundary—if price breaches here, the bullish structure would be invalidated.

BTC SELLGoing for 4h reversal, dayle timeframe has a low that should be broken and potental liquidity taken to move higher, currently its shrinking price twords a middle price.
Red trend lines are potental buy direction, if brakes below, we go lower, if does not, it can be a pivot for buys.
Yellow squears are 5min gaps
Puruple are higher timeframe gaps
Ultimetly looking at 4h to either open below lows(117k) or wick to dayle low(red straight lines)

BTC Short Term - BULL FLAG - Aug 1st $121,300 Regarding the daily price forecast from July 28, 2025 (Monday), through August 1, 2025 (Friday), the projections are derived from the bull flag continuation pattern, cross-referenced with aggregated analyses from recent market data, technical indicators (such as RSI and MACD showing neutral-to-bullish momentum), on-chain metrics (indicating accumulation at $115,000–$117,000), and a distribution of expert predictions. These include short-term consolidation with a potential dip for liquidity clearance, followed by a breakout, aligning with historical post-halving cycles and institutional inflows. Note that cryptocurrency prices are inherently volatile and influenced by factors such as Federal Open Market Committee outcomes, ETF flows, and macroeconomic events; these forecasts are speculative and not financial advice.
• July 28, 2025 (Monday): Anticipated consolidation within the flag channel amid low weekend volume. Expected range: $116,800–$118,500. Key targets: Support at $116,700 (lower flag boundary, potential entry for accumulation); resistance at $118,500 (upper flag line, breakout watch level). Average closing prediction: $117,800, reflecting neutral sentiment with minor downside risk if global markets weaken.   
• July 29, 2025 (Tuesday): Possible test of lower support amid early-week volatility, potentially sweeping liquidity before rebounding. Expected range: $116,000–$119,000. Key targets: Downside at $116,000 (critical on-chain accumulation zone); upside at $119,000 (initial breakout threshold). Average closing prediction: $117,500, with a 40% probability of a brief dip followed by stabilization.   
• July 30, 2025 (Wednesday): Breakout attempt likely if support holds, driven by mid-week momentum and potential dovish policy signals. Expected range: $117,500–$120,500. Key targets: Support at $117,000 (mid-channel level); resistance at $120,000 (psychological barrier and prior high). Average closing prediction: $118,900, assuming bullish confirmation above $118,500.   
• July 31, 2025 (Thursday): Extension of upward movement post-breakout, with volume potentially increasing. Expected range: $118,500–$122,000. Key targets: Support at $118,000 (retest of breakout level); resistance at $121,000 (flagpole projection start). Average closing prediction: $120,200, supported by technical alignment and ETF inflow trends.   
• August 1, 2025 (Friday): Momentum continuation toward weekly close, with risk of profit-taking. Expected range: $119,500–$123,500. Key targets: Support at $119,000 (new floor post-breakout); resistance at $123,000 (extended target based on pattern measurement). Average closing prediction: $121,800, aligning with broader bullish forecasts for early August.   

btc parabolic curvebitcoin parabolic curve pattern exits the base3 accumulation area and continues to rise sharply, with more to come

Navigating BTC Tremors on the Path to a Million Dollar New Bitcoin Paradigm: Navigating Short-Term Tremors on the Deliberate Path to a Million-Dollar Valuation
The Bitcoin market is currently a paradox, a theater of conflicting signals where short-term jitters coexist with audacious, long-term prophecies. On one hand, the price experiences sharp, gut-wrenching drops, with a recent dip to $118,000 attributed to institutional selling, sending waves of anxiety through the retail sector. On the other, the world’s most formidable financial institutions are issuing forecasts that seem to border on the fantastical, with one Wall Street banking giant boldly predicting a $200,000 Bitcoin by the end of December. This schizophrenic market sentiment is the new normal for an asset in the midst of a profound transformation. Bitcoin is no longer the fringe digital curiosity of a decade ago; it is a maturing global asset class being integrated into the very heart of the traditional financial system. This integration brings with it immense capital, but also new complexities and a different rhythm of growth. The story of Bitcoin today is one of navigating immediate volatility, fueled by market maker games and institutional repositioning, while keeping an eye on a future where corporate adoption, macroeconomic shifts, and a new, more deliberate growth pattern could methodically pave the way to a once-unthinkable $1,000,000 valuation.
The current landscape is a confluence of powerful, often opposing, forces. While institutional capital is the primary engine of this bull cycle, it is also a source of calculated selling pressure. At the same time, a steady drumbeat of corporate adoption continues, with companies like the UK-based The Smarter Web Company quietly adding hundreds of Bitcoin to their balance sheets. This is happening against a backdrop of favorable macroeconomic tailwinds, including what some are calling the "biggest trade deal ever" sealed by the United States, an event that subtly reinforces Bitcoin's role as a neutral, global store of value. And just when the narrative seems set, a new player like the mysterious "WeWake" enters the stage with a "big launch" that stuns investors, hinting at a new frontier of consumer-level adoption that could dwarf previous catalysts. This intricate dance between short-term technicals and long-term fundamentals defines Bitcoin's current journey—a journey that is less about the parabolic explosions of the past and more about a calculated, powerful ascent.
The Immediate Battleground: Volatility, Support, and the $123,000 Squeeze
To understand Bitcoin's path to six figures and beyond, one must first dissect the trench warfare happening at current price levels. The recent plunge to $118,000 served as a stark reminder that the road up is paved with volatility. While alarming, this dip was not seen as a catastrophic failure by seasoned analysts, but rather as a textbook example of institutional mechanics at play. Unlike retail investors who may hold with unwavering conviction, institutional desks are constantly managing risk, rebalancing portfolios, and taking profits to meet quarterly targets. The selling that triggered the drop was likely not a sign of lost faith, but a strategic repositioning, shaking out over-leveraged positions and creating liquidity for larger players to re-enter at more favorable prices.
This is precisely where the concept of the "ideal long zone" comes into play. For bullish traders and institutions, these orchestrated dips are not a crisis but an opportunity. An "ideal long zone" is a price range where multiple technical support indicators converge, creating a high-probability area for a price reversal. This zone might be defined by a combination of a key moving average (like the 50-day or 200-day), a significant Fibonacci retracement level drawn from a previous major low to a high, and a historical price range where the asset has previously found strong buying support. The fact that bulls were able to gain traction in this zone following the $118,000 dip indicates that this calculated selling was met with equally calculated buying. The market is currently engaged in a reversal campaign with an initial, modest target of reclaiming the $121,000 level, a crucial psychological pivot point.
However, a far more explosive scenario is brewing just beneath the surface: the potential for a massive short squeeze. Market makers, the large entities that provide liquidity to exchanges, are reportedly setting a "trap" for traders betting against Bitcoin. A short squeeze is a powerful market phenomenon that occurs when a heavily shorted asset begins to rise in price. The initial price increase forces short sellers to buy back the asset to close their positions and cut their losses. This wave of forced buying creates a feedback loop, driving the price even higher and forcing more short sellers to capitulate. It's a cascade of liquidations that can lead to rapid, vertical price movements.
Analysts believe that market makers are intentionally allowing short positions to build up around the current range, creating a pool of rocket fuel. The target for igniting this fuel appears to be a decisive break above $123,000. If Bitcoin can push past this level, it could trigger a chain reaction of short liquidations, propelling the price upwards with violent speed. This is not organic buying pressure but a technical event driven by market structure.
Looking at the week ahead, two primary scenarios emerge from this tense setup. The bullish scenario involves Bitcoin successfully bouncing from the current support zone, holding its ground, and making a concerted push towards $123,000. A break of this level would likely trigger the short squeeze, leading to a rapid retest of recent highs and potentially pushing into the $125,000-$130,000 range. The bearish scenario, conversely, would see Bitcoin fail to hold this "ideal long zone." A break below the recent lows around $118,000 would invalidate the immediate bullish thesis, suggesting that the institutional selling pressure is more significant than anticipated. This could lead to a deeper correction, potentially testing support levels closer to $100,000-$110,000. The outcome of this short-term battle is critical, as it sets the stage for the remainder of the year and will determine whether the more ambitious price targets remain in play. Adding to the tension, the market is heading into August, a month that analysts have flagged as being filled with potential volatility catalysts, from central bank policy announcements to major options expiry dates, ensuring that the current state of high alert will persist.
The Wall Street Endorsement: The Race to Six Figures by Year-End
While traders battle over short-term levels, Wall Street has its eyes fixed on a much grander prize. The narrative of this bull run has been fundamentally defined by the legitimization of Bitcoin as an institutional asset, and the price targets now emanating from the heart of traditional finance reflect this new reality. In a stunning vote of confidence, a major, unnamed banking giant has put forth a research note predicting that Bitcoin could reach an astonishing $200,000 by December of this year.
This is not a casual prediction from a rogue analyst; it represents a calculated forecast from an institution with immense resources and influence. Such a bold call from a pillar of Wall Street signifies a deep conviction in the asset's trajectory, likely based on proprietary models of capital inflows from ETFs, corporate treasuries, and high-net-worth individuals. It serves as a powerful signal to the rest of the financial world, effectively giving institutional clients the green light to allocate significant capital to Bitcoin. This prediction, along with a growing consensus that Bitcoin is expected to exceed $150,000 by the end of the year, creates a powerful psychological anchor. When institutions of this caliber set such high targets, they can become self-fulfilling, as asset managers and funds feel compelled to gain exposure, lest they miss out on the anticipated rally.
These bullish forecasts are not based on sentiment alone; they are supported by increasingly sophisticated on-chain analysis. One of the most-watched metrics in this cycle is the MVRV (Market Value to Realized Value) ratio. In simple terms, the MVRV ratio compares Bitcoin's current market price to the average price at which all coins in circulation were last moved. When the ratio is high, it suggests the market is overheated and holders are in significant profit, increasing the likelihood of selling. When it's low, it suggests the asset is undervalued.
Analysts have taken this a step further by creating MVRV Pricing Bands. These bands represent standard deviation levels above and below the "realized price," creating a data-driven framework for identifying potential market tops and bottoms. Currently, these pricing bands are hinting at a cycle peak valuation of around $130,000. This provides a more conservative, data-grounded target that aligns with the lower end of the Wall Street predictions. However, this on-chain model comes with a critical caveat: it is only valid if Bitcoin's price holds its current macro support level. This elegantly connects the long-term on-chain outlook with the immediate price battle discussed earlier. A failure to hold the line in the short term could invalidate the assumptions underpinning these models, forcing a recalibration of year-end targets. The path to $130,000, $150,000, or even $200,000 is contingent on winning the present fight.
The New Adoption Paradigm: Corporate Strategy, Macro Shifts, and the "WeWake" Wildcard
The fuel for Wall Street's bullish fire is coming from tangible, real-world adoption. The trend of corporations adding Bitcoin to their balance sheets, pioneered by MicroStrategy, is quietly but powerfully continuing. A recent example is The Smarter Web Company, a UK-based firm that recently announced the addition of 225 BTC to its holdings. While not on the scale of a multi-billion dollar purchase, this move is incredibly significant. It demonstrates that the corporate treasury thesis is expanding beyond a few high-profile early adopters and is becoming a global phenomenon, embraced by small and medium-sized enterprises who view Bitcoin as a superior long-term store of value and a hedge against currency debasement. Each of these purchases, while small individually, collectively contributes to a persistent supply shock, as more coins are moved from the open market into corporate treasuries for long-term holding.
This steady corporate accumulation is occurring against a highly favorable macroeconomic backdrop. News that the United States has successfully sealed what some insiders are calling the "biggest trade deal ever" is being interpreted as a significant long-term tailwind for Bitcoin. Large-scale international trade agreements often involve complex currency fluctuations and settlements. In a world of increasing geopolitical friction and competitive currency devaluations, Bitcoin's properties as a neutral, apolitical, and globally accessible settlement asset become increasingly attractive. Such trade deals can increase global liquidity and put pressure on national currencies, subtly reinforcing the value proposition of a decentralized, non-sovereign store of value.
Just as the market was beginning to digest this new landscape of institutional flows and macro support, a wildcard has entered the fray. A company named "WeWake" has reportedly stunned investors with a "big launch," creating a new, unexpected catalyst. While details remain scarce, the market chatter suggests WeWake is not another financial firm or institutional player, but a major consumer-facing technology company. The speculation centers on a groundbreaking integration of Bitcoin's Lightning Network for micropayments within a massively popular application or service.
If true, this would represent a paradigm shift in adoption. To date, the primary use case driving this cycle has been Bitcoin as "digital gold"—a store of value for institutions and corporations. The WeWake launch hints at the reawakening of Bitcoin's other primary narrative: a peer-to-peer electronic cash system. A successful, large-scale consumer integration would prove that Bitcoin can function not only as a reserve asset but also as a transactional currency for everyday use, opening up an entirely new dimension of demand. The shock and excitement from this launch stem from its potential to onboard millions of new users to the network, not as investors, but as active participants in a new digital economy. This move from passive investment to active utility could be the key to unlocking the next major phase of exponential growth.
The Long Road to a Million: A Mature Asset's "Pump and Consolidate" Journey
With year-end targets of $200,000 now part of the mainstream conversation, the once-fringe prediction of a $1,000,000 Bitcoin is being re-evaluated with newfound seriousness. However, a key analyst has offered a crucial insight that reframes this journey: "The days of parabolic Bitcoin bull runs are over." This statement may sound bearish, but it is, in fact, a sign of Bitcoin's profound maturation as an asset class. The wild, untamed, 100x rallies of the early cycles, driven by retail mania and a lack of liquidity, are being replaced by a more structured and powerful, albeit less explosive, pattern of growth.
The new path to $1,000,000, according to this expert view, will be a "slow and steady" process defined by a "pump and consolidate" pattern. This model envisions a market that behaves less like a volatile penny stock and more like a blue-chip technology giant. The "pumps" will be powerful, rapid upward movements, but they will be driven by specific, fundamental catalysts—the approval of a new wave of ETFs, a landmark corporate adoption by a Fortune 100 company, a major nation-state adding Bitcoin to its reserves, or a successful consumer integration like the one hinted at by WeWake.
Following each of these catalyst-driven pumps, the market will enter a prolonged "consolidate" phase. Instead of a dramatic crash, Bitcoin will establish a new, higher plateau of price discovery. During these consolidation periods, which could last for months, the market will build liquidity, institutional players will accumulate and distribute positions, and the new price level will be normalized and accepted as a baseline. This creates a far more stable foundation for the next leg up. This methodical, stair-step ascent is the hallmark of a mature market with deep, two-sided liquidity provided by institutional players who both buy and sell, preventing the extreme parabolic blow-off tops and subsequent 80-90% crashes of the past.
This "pump and consolidate" model makes the journey to $1,000,000 seem not only more plausible but almost inevitable, assuming the underlying drivers of adoption continue. It is a path built on structural strength rather than pure speculation. Each consolidation phase absorbs selling pressure and builds a stronger floor, making the entire structure more resilient to shocks.
In conclusion, Bitcoin stands at a fascinating and pivotal juncture. It is weathering the short-term storms of institutional profit-taking and the intricate games of market makers, fighting to establish a firm footing above the critical $120,000 level. At the same time, its long-term trajectory is being underwritten by the full faith and credit of Wall Street, with audacious year-end targets of $150,000 to $200,000 now serving as the institutional base case. This optimism is fueled by a relentless wave of corporate adoption and favorable macroeconomic winds, and has been supercharged by surprising new catalysts that hint at a future of mass consumer utility.
The ultimate destination may be the long-fabled million-dollar mark, but the journey will look different this time. The wild, parabolic arcs of youth are giving way to the measured, powerful, and deliberate steps of a mature global asset. The "pump and consolidate" rhythm is the new heartbeat of a market driven by institutional capital and fundamental adoption. While the path will undoubtedly be fraught with volatility, corrections, and periods of agonizing consolidation, the underlying narrative has never been stronger. Bitcoin is navigating the tremors of the present as it builds the foundations for a truly monumental future.
Strong Bearish move possible from these levels.Adjusted Trendlines
We have slightly adjusted the trendlines, as Bitcoin appears to hesitate in choosing its next move. We still estimate a 70–80% probability of a significant decline from current levels.
There is a small chance that liquidity above the all-time high (around $124K) may still be required, but I remain skeptical of that scenario.
The XRP 1.5-1.6usd target remains valid. However, it remains challenging to pinpoint the exact moment when altcoins will begin to outperform Bitcoin, and thats just what happened recently, If we break below 2.75usd with strength then a move towards 1.6usd is almost certain.
BTCUSD lower toward <113,000-ishI think we are in an Elliotwave A-B-C-D-E pattern, whereas E is delevoping. Price target toward $112,319 - $113,925
From a daily perspective, we can go as lower towards the $95k's...but let see where the next few days takes us.
I'm wrong is we break/close $119,826

BTC - Weekly Warning SignsAfter seeing a 5% correction from our recent BTC ATH of $123k we are starting to see a few warning signs as momentum starts to decline.
Looking only at our RSI and price I have outline the last 3 time we have seen something similar since 2021. Without going into too much detail normally what we see is an RSI TOP followed by a retest + rejection right at the 70 level (overbought conditions).
We saw it at our market cycle high in 2021 that started the bear market (75% correction).
We saw it at our March 2024 high that started a mid cycle correction (33% correction).
And we are seeing it now after our recent 2025 ATH that has started a very mild correction so far (5%).
This does not mean it is the end of the world but absolutely something market participants need to be paying attention to as this is a make or break signal;.
If we see momentum continue to decline it could lead to our bull market structure being broken and lead us into a bear market that we have historically seen going into the new year.
However this correction can easily be negated to produce a strong bull market continuation move. All we need to see is bulls start to push our strength back above the 70 level (overbought conditions) and we can see the next leg of the bull market really kick off (WITH A CLOSE ABOVE).
For now pay attention to the weekly RSI as of the time of this post our strength has been declining from where we have seen previous tops align with.

BTC/USD: Bullish Pennant Holds Above Breakout ZoneBitcoin is consolidating within a bullish pennant pattern just below the 120,000 level, following a sharp rally from the June lows. Price action has compressed between converging trendlines, forming higher lows and lower highs — a classic continuation formation in an uptrend.
Importantly, BTC remains well above prior resistance (now support) at 112,000, with both the 50-day SMA (109,837) and 200-day SMA (95,838) trending upward. This suggests strong medium- to long-term bullish structure.
Momentum indicators support the case for continuation:
MACD remains in positive territory, albeit with a slight bearish crossover, hinting at near-term indecision.
RSI is holding around 59.6, just below overbought, reflecting consolidation rather than distribution.
A breakout above the pennant resistance and psychological 120,000 barrier would likely trigger renewed bullish momentum, targeting fresh highs. Conversely, a breakdown below 116,000 could expose 112,000 as a key retest zone.
Bias: Bullish continuation favored while above 112,000. Watch for breakout confirmation from the pennant.
-MW

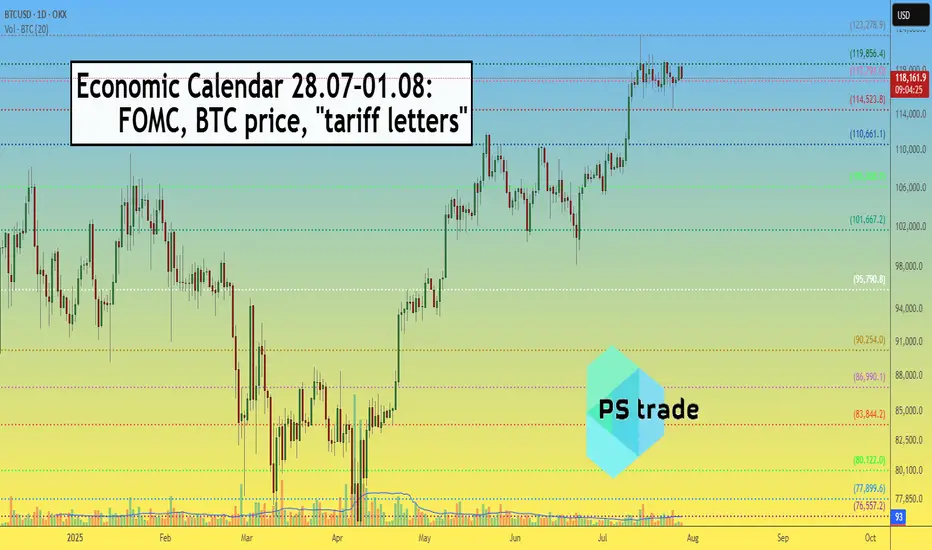
Very important Economic Calendar 28.07–01.08: FOMC, BTC, tariffsThis Week (July 28 – August 1) — the final week of the month is packed with key events.
Save this post and forward it to 3 friends 😉
📋 High volatility ahead — as the Fed’s key "threelemma" (inflation, labor market, tariffs) comes into focus.
Several important macro releases are scheduled — each one matters on its own, but combined, they can move markets sharply.
🗓 Monday (July 28)
▪️ 12:30 UTC – QRA (Part 1): upcoming US Treasury borrowing needs
▪️ 16:00 UTC – 2Y & 5Y bond auctions – key indicator of market expectations ahead of FOMC
🔗 Strong demand = stronger rate cut expectations
🗓 Tuesday (July 29)
▪️ 12:30 UTC – US GDP (Q2 estimate)
▪️ 16:00 UTC – 7Y bond auction
🗓 Wednesday (July 30)
▪️ 12:15 UTC – ADP employment report – early signal ahead of NFP
▪️ 12:30 UTC – QRA (Part 2): breakdown of Treasury borrowing
▪️ 18:00 UTC – FOMC rate decision (no change expected – 4.5%) + Powell’s press conference
🗓 Thursday (July 31)
▪️ 12:30 UTC – PCE inflation (June) – Fed’s favorite inflation gauge
🗓 Friday (August 1)
▪️ 12:30 UTC – Nonfarm Payrolls (employment)
▪️ 13:00 UTC – ISM Manufacturing Index (July)
▪️ 13:00 UTC – Univ. of Michigan Consumer Sentiment Index
▪️ All day – July auto sales data
🚨 LIBERATION DAY 2.0
Potentially the most impactful event of the week: the Trump administration will begin sending “tariff letters” to ~200 countries.
This marks the end of the temporary tariff relief (April 8 – August 1).
Markets expect a new wave of global trade tension — timing is still uncertain.
💡 Summary:
Every day brings a new potential driver.
Markets are nervous and highly reactive — sharp moves are likely...
CRYPTOCAP:BTC is currently being held above $117K, but Wednesday and Friday bring high risk of "news bombs".
BTCUSD +$500 in the next few candles/sessionsBitcoin (BTCUSD) is showing strong bullish momentum, and current price action indicates a potential move upward by the next $500 in the short term.

BTCUSD TO THE LAST PUSHWe are looking to finish the last push to the upside for the completed circle.

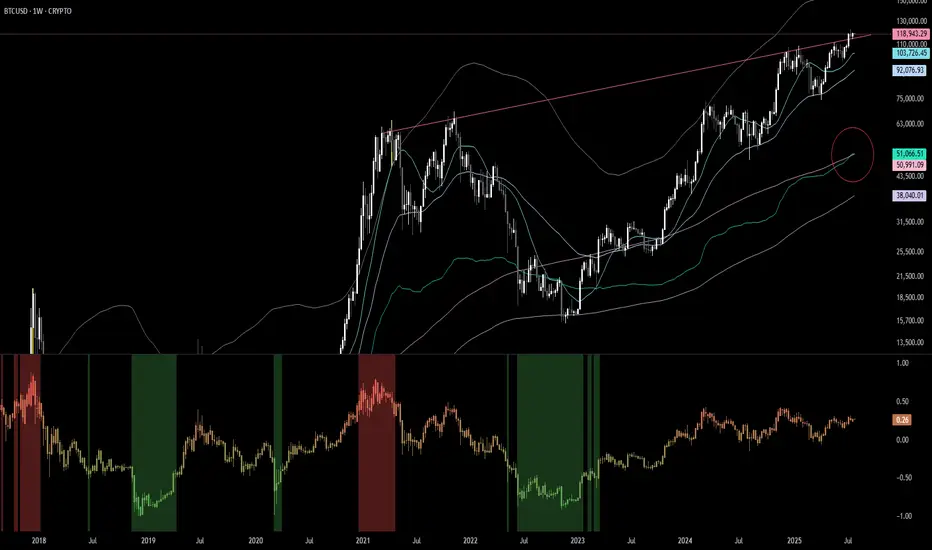
Realized Price / 200 SMAThe realized price has crossed above the 200 SMA. The last time that this happened was November 2020. BTC then went on a tear in the following 90 days gaining 212%. Even if BTC gains only 50% of that 212% this time we will see the BTC price hit 250k.
We aren't bullish enough.