BITCOIN (BTCUSD): Strong Bullish Confirmation?!
Bitcoin has a high chance to rise more, following
a strong bullish reaction to a rising trend line on a 4H.
Goal - 108000
❤️Please, support my work with like, thank you!❤️
BITCOIN trade ideas

Bitcoin – Ritual Latency & Tactical Tension.⊢
⟁ BTC/USD – Binance – (CHART: 1H) – (June 21, 2025).
⟐ Analysis Price: $103,909.52.
⊢
⨀ I. Temporal Axis – Strategic Interval – (H1):
▦ EMA9 – ($103,783.82):
∴ The price oscillates around EMA9 with marginal bullish slope;
∴ Two candle rejections confirmed the EMA9 as a reactive short-term axis;
∴ Current close is above, but lacking directional follow-through.
✴️ Conclusion: Momentum attempt, yet unsupported – fragility persists.
⊢
▦ EMA21 – ($103,869.74):
∴ Flattened trajectory overlapping EMA9;
∴ Indicates tactical compression – a latency band rather than trendline;
∴ No breakout confirmation.
✴️ Conclusion: Equilibrium zone – direction undecided.
⊢
▦ EMA50 – ($104,212.18):
∴ Serves as immediate dynamic resistance;
∴ Price has not closed above since June 20, 13:00 UTC;
∴ Requires sustained move to invalidate micro-downtrend.
✴️ Conclusion: Key reversal barrier – price remains below structural trigger.
⊢
▦ SMA100 – ($104,552.65):
∴ Downsloping, acting as mid-term ceiling;
∴ No candle engagement in recent sessions;
∴ Confluence zone with EMA50 adds density.
✴️ Conclusion: Inertial resistance zone – trend continuity until breach.
⊢
▦ SMA200 – ($105,197.18):
∴ Highest structural ceiling on H1;
∴ Remains untouched, reinforcing broader tactical bearish bias.
✴️ Conclusion: SMA200 maintains bearish structure – trend remains capped.
⊢
▦ Bollinger Bands - (20,2):
∴ Bands tightened – low volatility configuration;
∴ Upper band slightly expands – minor opening signal;
∴ Price contacts upper range without strength.
✴️ Conclusion: Potential breakout pattern – requires volume ignition.
⊢
▦ RSI (14, smoothed by EMA9) – (11.00 | Avg: 13.85):
∴ RSI at historical low – indicative of exhaustion rather than momentum;
∴ EMA of RSI confirms suppressed structure;
∴ Hidden divergence plausible but not confirmed.
✴️ Conclusion: Latent reversal conditions – needs confirmation from RSI reclaim.
⊢
▦ MACD (12,26,9) – (MACD: 88.35 | Signal: -159.25 | Histogram: -247.60):
∴ Histogram remains negative but is narrowing;
∴ MACD line curling upward, approaching signal;
∴ No crossover yet – early recovery signal under surveillance.
✴️ Conclusion: Bullish divergence forming – reversal not validated.
⊢
▦ ATR (14, RMA) – (372.44):
∴ Volatility decreasing after a local spike;
∴ Range-bound structure indicates compression, not impulse.
✴️ Conclusion: Tactical latency – volatility may reawaken post-volume.
⊢
▦ Volume (21):
∴ Faint increase in last bullish candle – still below strategic threshold;
∴ Lacks institutional confirmation.
✴️ Conclusion: Spot activity insufficient – neutral, vulnerable structure.
⊢
🜎 Strategic Insight – Technical Oracle:
∴ H1 presents structural compression between EMA9/21/50, confirming tactical latency;
∴ RSI at deep oversold – signal of exhaustion, not yet momentum;
∴ Bollinger and MACD show early signs of kinetic preparation;
∴ The market is postured, not reactive – awaiting a directional event.
✴️ Tactical View: Structurally Neutral – Momentum Suspended, entry only upon RSI/Volume confirmation and MACD validation.
⊢
∫ II. On-Chain Intelligence – (Source: CryptoQuant):
∴ Update as of June 21, 2025 – Synchronized to H1 Structural Reading.
▦ Exchange Netflow Total – (All Exchanges) – (+692 BTC):
∴ Positive net inflow detected over 24h;
∴ Suggests moderate sell-side liquidity entering exchanges;
∴ Reflects defensive posturing, not panic-driven behavior.
✴️ Conclusion: Mild bearish pressure – not sufficient to invalidate structural base.
⊢
▦ Spot Taker CVD - (Cumulative Volume Delta, 90-day):
∴ Dominance of Taker Sell Volume confirmed – aggressive sellers remain in control;
∴ Pattern consistent over the last 6 sessions;
∴ No divergence between volume behavior and price structure.
✴️ Conclusion: Market remains tactically sell-biased – momentum driven by taker aggression.
⊢
▦ Spent Output Profit Ratio (SOPR) – (1.009):
∴ Marginally above 1.00 – coins being spent in mild profit;
∴ Absence of capitulation, but also no sign of deep conviction among holders;
∴ Stable rotation, not breakout-driven.
✴️ Conclusion: Structural neutrality – market is churning without direction.
⊢
▦ Adjusted SOPR (aSOPR) – (≈1.00):
∴ Flat – confirms lack of distribution or panic;
∴ Historically aligns with consolidation regimes.
✴️ Conclusion: Supply behavior is balanced – trend-neutral reading.
⊢
▦ Open Interest – All Exchanges – ($34.01B):
∴ Remains elevated – indicative of speculative leverage;
∴ Elevated risk of liquidation cascade on directional volatility;
∴ OI rising faster than spot volume = synthetic exposure dominating.
✴️ Conclusion: Market structurally exposed – fragile to external triggers.
⊢
▦ Funding Rate – All Exchanges – (-0.003):
∴ Slightly negative – shorts funding longs;
∴ Suggests bearish bias among leveraged participants;
∴ Conditions ripe for short squeeze if spot demand increases.
✴️ Conclusion: Contrarian setup building – tactical upside risk exists.
⊢
🜎 Strategic Insight – On-Chain Oracle:
∴ Metrics reflect a market under cautious speculative tension;
∴ No broad liquidation, no long-term holder exit – base intact;
∴ Taker dominance and leverage build-up suggest reactive positioning;
∴ System is neutral-leaning fragile – vulnerable to both triggers and traps.
✴️ Tactical Note: "Structurally Stable – Tactically Unsettled"
⊢
⧉ III. Contextvs Macro–Geopoliticvs – Interflux Economicus:
∴ Macro Landscape Reference – June 21, 2025.
▦ United States – Federal Policy & Risk Layer:
∴ Treasury Yield Curve remains slightly positive (+0.44%), removing short-term recession signal;
∴ 10Y yield elevated at 4.42% – reflects sustained inflation resistance and risk demand;
∴ Fed maintains QT stance – no rate cuts expected before September;
∴ Tension with Iran intensifying – military rhetoric entering fiscal discourse.
✴️ Conclusion: U.S. macro acts as compression catalyst – neutral on surface, volatile underneath.
⊢
▦ Strategic Bitcoin Reserve – (Executive Order – Trump):
∴ Recent Executive Order establishes BTC as sovereign asset class;
∴ Adds policy-level legitimacy to institutional accumulation;
∴ Reflects shift from “hedge” to “strategic reserve logic”.
✴️ Conclusion: Structural bull signal – narrative transition confirmed.
⊢
▦ China – Internal Stimulus & Soft Deflation:
∴ PPI negative at -3.3%, Retail Sales up 6.4% – stimulus-driven divergence;
∴ Fiscal revenue declining YTD – systemic drag despite easing;
∴ Not a current volatility driver.
✴️ Conclusion: China is neutral to crypto – reactive, not directive.
⊢
▦ European Union – Disinflation & Monetary Drift:
∴ HICP falls to 1.9%, ECB cuts deposit rate to 2.00%;
∴ PMI Composite < 50 – economic contraction quietly progressing;
∴ Forward guidance hesitant.
✴️ Conclusion: EU remains marginal – supportive for risk, but not catalytic.
⊢
▦ Global Fragmentation & SWIFT Erosion:
∴ Geopolitical blocs continue diverging – dollar-reliant systems weakening;
∴ Bitcoin seen increasingly as transactional hedge in sanctioned environments;
∴ De-dollarization dynamic accelerating.
✴️ Conclusion: Bitcoin positioned as neutral monetary rail – volatility shield and escape valve.
⊢
🜎 Strategic Insight – Interflux Macro Oracle:
∴ U.S. remains the dominant macro variable – its monetary and geopolitical stance defines volatility posture;
∴ Bitcoin structurally benefits from institutional legitimacy, but tactically suspended by risk-off layers;
∴ The system is internally calm, externally tense – volatility is downstream of Powell and geopolitical shock.
⊢
⌘ Codicillus Silentii – Strategic Note:
∴ Temporal structure remains compressed, yet technically reactive;
∴ On-chain behavior supports latent structural integrity, but reveals synthetic tension;
∴ Macro axis introduces dual asymmetry – stability in policy, instability in conflict;
∴ The system is in latency – not due to certainty, but due to mutual hesitation.
⊢
𓂀 Stoic-Structural Interpretation:
▦ Structurally Bullish.
∴ The underlying structure - long-term moving averages, exchange reserves, macro narrative, and holder behavior - remains intact and upward-biased;
∴ There is no technical breakdown or structural disassembly;
∴ It is the silent foundation - the “floor” of the chart remains elevated.
⊢
▦ Tactically Suspended.
∴ Although the structure points to strength, the present moment neither demands nor validates action;
∴ There is no volume, no ignition signal, no confirmation flow;
∴ Thus, the tactic is suspended - the trader (or observer) is in a disciplined state of observation, not execution.
⊢
⧉
⚜️ Magister Arcanvm (𝟙⟠) – Vox Primordialis!
𓂀 Wisdom begins in silence. Precision unfolds in strategy.
⧉
⊢

Bitcoin (BTC/USD) 2-Hour Candlestick Chart2-hour candlestick chart displays the recent price movement of Bitcoin (BTC) against the U.S. Dollar (USD), showing a current price of $103,904.89 with a gain of $595.12 (+0.58%) as of 01:22:41. The chart highlights a volatile period with significant price fluctuations, including a sharp drop followed by a recovery, and includes key price levels such as $106,099.25 and $102,803.95. The chart also features a highlighted support zone in pink and a resistance zone in light blue


Bais A.M.D : Accumulation Manipulation and Distribution.
H & S : Head and Shoulder
Accumulation.
BTC Accumulated Range 104139 - 106206
Manipulation
Manipulated Range 106247 - 109105
Forming a Head and Shoulder pattern.
Distribution
Currently in a Distribution phase.
After breaking below 106247 support to a low 102287. Heading to a Minor resistance range 105233 - 105731 for a more downside continuation below 102275.
IMO. DYOR

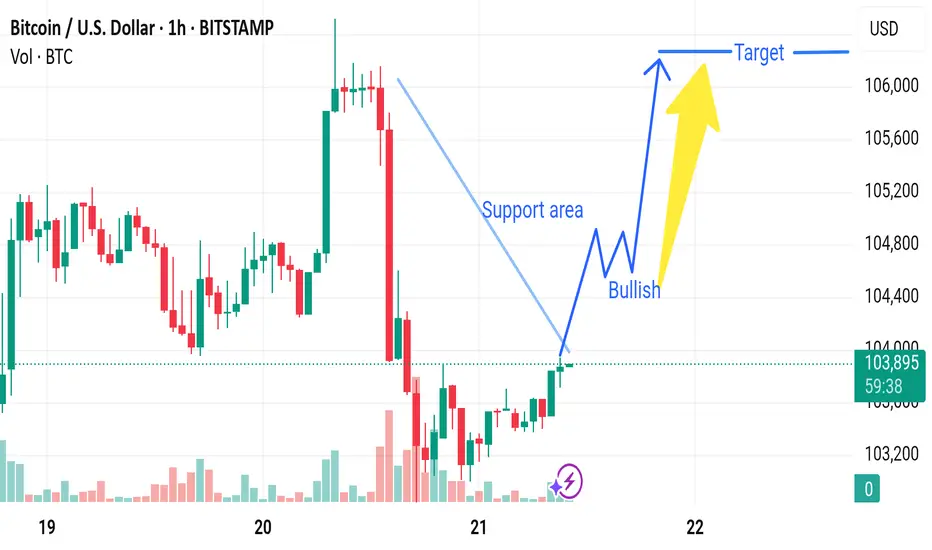
Market next target 🔄 Disruption Analysis:
1. Weak Support Confirmation
The chart marks a "Support area," but there is no strong confirmation (e.g., a hammer or engulfing bullish candle with high volume).
Support zones are more reliable with multiple prior bounces; here, it seems newly identified and not yet validated.
2. Bearish Volume Signature
During the recent decline (before the support), the red volume bars are significantly larger, indicating strong selling pressure.
The recovery candles near support have low volume, which may signal lack of conviction from bulls.
3. Lower Highs Formation
Prior to the drop, we see a series of lower highs, hinting at weakening bullish momentum.
This could suggest a potential bearish continuation, especially if price fails to break above the last local high (~106,000).
4. Possible Bearish Retest
Instead of a bullish breakout, the current price might just be retesting the broken support-turned-resistance.
This is a common bull trap scenario where prices bounce slightly before resuming downward.
BITCOIN, trend outlook for this summerWhile the fundamentals are still very complicated on the stock market at present, with the FED intransigent, trade war/diplomacy (deadline set for July 9 to reach trade agreements) and extreme geopolitical tensions, can the bitcoin price withstand all these challenges and continue its annual bull run over the summer? Let's take a look at a number of elements, including a major technical risk and two factors that are, on the contrary, favorable to a new record this summer.
1) Bitcoin's bullish cycle linked to the spring 2024 halving is still long
Let's start with the cyclical aspect of bitcoin, the famous 4-year cycle built around the quadrennial halving. The last halving took place in April 2024, and if the cycle repetition works again, then the current cycle is due to end at the end of 2025. So there's still time for bitcoin to set a new record, even if it comes under short-term pressure - it still has 5 months to go.
The first chart below summarizes the 4-year cycle by averaging the time and price of all previous cycles since 2009. Our current cycle is represented by the red curve, and in terms of probability, the end of the cycle is expected between October and December 2025.
There's still time, and this is the first major piece of information in our article.
2) A bearish technical divergence in weekly data calls for great caution
On the other hand, technical analysis of the bitcoin price in weekly data gives a warning signal with the presence of a bearish price/momentum divergence, market momentum being represented here by the RSI technical indicator.
This bearish divergence resembles that at the end of the previous cycle in November 2021, but the comparison stops here. At that time, all end-of-cycle models were on alert, but this is not the case today. Nevertheless, we must be aware that this bearish divergence could be a pressure factor this summer.
3) Global liquidity as represented by the M2 monetary aggregate gives grounds for optimism about bitcoin's summer trend
Global M2 deploys a strong positive correlation with the bitcoin price, and it takes an average of 12 weeks for this liquidity to act on BTC. This monetary aggregate measures the sum of the money supply (M2) of the major economies - USA, China, Eurozone - converted into US dollars. It includes sight deposits, savings accounts and certain short-term instruments, representing the gross liquidity immediately available in the global economy.
This level of liquidity is directly influenced by monetary (key rates, QE/QT), fiscal and wage policies. The evolution of the US dollar plays a crucial role: a strong dollar mechanically reduces global M2 in USD, while a weak dollar increases it. In this respect, Chinese and US dynamics are often divergent, as they are driven by different credit logics (centralized planning on the Chinese side, rate-based adjustment on the US side).
Since the beginning of April, Bitcoin has been on a marked uptrend. This progression, which we have followed step by step, raises an essential question: can this momentum be maintained this summer, despite the fundamental challenges of the moment?
Such a hypothesis is plausible, provided that a key - and often underestimated - driver continues to act: the unprecedented increase in global liquidity, as measured by the M2 monetary aggregate. According to the latest available data, global M2 has set a new all-time record, and this is a factor supporting the BTC trend for the first part of the summer.
DISCLAIMER:
This content is intended for individuals who are familiar with financial markets and instruments and is for information purposes only. The presented idea (including market commentary, market data and observations) is not a work product of any research department of Swissquote or its affiliates. This material is intended to highlight market action and does not constitute investment, legal or tax advice. If you are a retail investor or lack experience in trading complex financial products, it is advisable to seek professional advice from licensed advisor before making any financial decisions.
This content is not intended to manipulate the market or encourage any specific financial behavior.
Swissquote makes no representation or warranty as to the quality, completeness, accuracy, comprehensiveness or non-infringement of such content. The views expressed are those of the consultant and are provided for educational purposes only. Any information provided relating to a product or market should not be construed as recommending an investment strategy or transaction. Past performance is not a guarantee of future results.
Swissquote and its employees and representatives shall in no event be held liable for any damages or losses arising directly or indirectly from decisions made on the basis of this content.
The use of any third-party brands or trademarks is for information only and does not imply endorsement by Swissquote, or that the trademark owner has authorised Swissquote to promote its products or services.
Swissquote is the marketing brand for the activities of Swissquote Bank Ltd (Switzerland) regulated by FINMA, Swissquote Capital Markets Limited regulated by CySEC (Cyprus), Swissquote Bank Europe SA (Luxembourg) regulated by the CSSF, Swissquote Ltd (UK) regulated by the FCA, Swissquote Financial Services (Malta) Ltd regulated by the Malta Financial Services Authority, Swissquote MEA Ltd. (UAE) regulated by the Dubai Financial Services Authority, Swissquote Pte Ltd (Singapore) regulated by the Monetary Authority of Singapore, Swissquote Asia Limited (Hong Kong) licensed by the Hong Kong Securities and Futures Commission (SFC) and Swissquote South Africa (Pty) Ltd supervised by the FSCA.
Products and services of Swissquote are only intended for those permitted to receive them under local law.
All investments carry a degree of risk. The risk of loss in trading or holding financial instruments can be substantial. The value of financial instruments, including but not limited to stocks, bonds, cryptocurrencies, and other assets, can fluctuate both upwards and downwards. There is a significant risk of financial loss when buying, selling, holding, staking, or investing in these instruments. SQBE makes no recommendations regarding any specific investment, transaction, or the use of any particular investment strategy.
CFDs are complex instruments and come with a high risk of losing money rapidly due to leverage. The vast majority of retail client accounts suffer capital losses when trading in CFDs. You should consider whether you understand how CFDs work and whether you can afford to take the high risk of losing your money.
Digital Assets are unregulated in most countries and consumer protection rules may not apply. As highly volatile speculative investments, Digital Assets are not suitable for investors without a high-risk tolerance. Make sure you understand each Digital Asset before you trade.
Cryptocurrencies are not considered legal tender in some jurisdictions and are subject to regulatory uncertainties.
The use of Internet-based systems can involve high risks, including, but not limited to, fraud, cyber-attacks, network and communication failures, as well as identity theft and phishing attacks related to crypto-assets.

BTC: A shakeout for more liquidityBTC: A shakeout for more liquidity
.
Wait for a drop and catch the dip, and continuously go up!
US STOCKS- WALL STREET DREAM- LET'S THE MARKET SPEAK!

My btcusd analysis based on demand & supply , and central areaFirst of all btcusd in down trend , then i follow demand supply rule, from my observation.
Second point look the pressure in the hammers , it tells where the price heading, and for more confirmation wait for hammer failure and retest in the price, then you see the momentum in the price.

BTC ROAD TO ALL TIME HIGHHere is my prediction on weekend is BTC is a great time to pump.
So taking long now, SL near current support around 100-120 pips is good enough

Bitcoin (EoY '28) - Potentials <3I just wanted to publish this because I feel there is some deep involvement on the drawings based off the all-time historic trendline.
I would like to see how this unfolds. Usually, I am too grandiose about my predictions, or too short-time-minded/%gains. Today we can see a few things that are appreciative and indicative of continuation on a higher timeframe. We can crawl and crawl forever. You musn't be afraid. Continue to trudge forward. There are no bears here, they are only phantoms in the dark.

BTCUSD – At a Make-or-Break LevelBTCUSD – At a Make-or-Break Level: Will Bitcoin Rebound or Slide Further?
Bitcoin continues to hover near a critical support level after last week's sharp drop. With rising macro uncertainty, shifting institutional flows, and growing interest in crypto regulation, BTCUSD is showing signs of a potential reversal — but traders should proceed with caution.
🌐 Macro Outlook – Debt Pressure, ETFs & Election Talk Fuel Uncertainty
US fiscal stress is building: Analysts warn that the United States could see interest payments exceed $1 trillion in 2025 — more than its defense or healthcare budget. This puts pressure on the Federal Reserve to consider fiscal tightening instead of rate cuts.
Spot Bitcoin ETF inflows are slowing: After a strong start in early 2024, institutional flows into spot BTC ETFs have cooled down recently. Hedge funds and asset managers are waiting for more clarity on economic policy.
Pro-crypto narratives gaining traction in US politics: With elections approaching, political figures are floating proposals to use Bitcoin as a strategic reserve asset and encourage crypto-based financial infrastructure.
Meanwhile, the US Dollar Index (DXY) remains volatile. A weaker dollar could support crypto, but stronger-than-expected inflation data may fuel further caution.
📉 Technical Analysis (BTCUSD – H1 to H4)
BTC is currently trading within a medium-term descending channel, and has recently tested the key support zone near 103,108.
A potential V-recovery pattern is forming. If buyers can hold this zone and break above 104,184, the price may target 106,047 and eventually 107,586.
However, EMA clusters (50–100–200) on the H1 chart are still pressing downward. A confirmed bullish reversal would require a breakout above 105,200 with strong volume.
✅ Suggested Trade Plan
🟢 BUY ZONE: 103,100 – 103,300
Entry: On price reaction with confirmation candlestick
SL: 102,600
TP: 104,184 → 106,047 → 107,586
🔴 SELL ZONE: 107,500 – 107,800
Entry: Only if price rejects resistance at upper channel
SL: 108,200
TP: 106,000 → 104,500
⚠️ Avoid aggressive shorting in the current range to reduce false breakout risk.
💬 Final Thoughts for Indian Traders
The current market is caught between macroeconomic caution and long-term crypto optimism. Bitcoin is holding near its lower range — a zone that historically triggers upward momentum.
For Indian traders, the key is to wait for clear structural confirmation and respect technical levels. Let price and macro alignment guide your decisions, not emotion or hype.
Plan the trade. Trade the plan. Protect your capital.

BTCUSD 15M CHART PATTERN This chart is a 15-minute candlestick chart of Bitcoin (BTC/USD) from TradingView, showing recent price movement and a potential bullish prediction.
Key Observations:
1. Downtrend & Reversal Point:
A significant downward move is marked with a red arrow, signaling a potential short-selling opportunity or a bearish trend that recently ended.
The price then forms a rising trendline (in red), suggesting an ascending triangle pattern — a bullish continuation signal.
2. Current Price:
As of the time on the chart (June 21, 2025, 04:56 UTC), the BTC price is approximately $103,441.
3. Breakout Projection:
A green arrow indicates a breakout point above the resistance level, supported by the red trendline.
The chart suggests a projected bullish move with a target near $108,090, illustrated with an upward zigzag path in a shaded box — representing the possible path price might follow post-breakout.
4. Chart Analysis Implication:
If the price holds above the red trendline and breaks above the consolidation range, the projection implies an upward target of around $108,000–$110,000.
Conclusion:
The chart author anticipates a bullish breakout from a consolidation pattern, aiming for higher levels in the short term. However, a failure to hold above the rising trendline might invalidate the bullish scenario.
Would you like a technical analysis summary, a trading strategy based on this chart, or help interpreting more details?

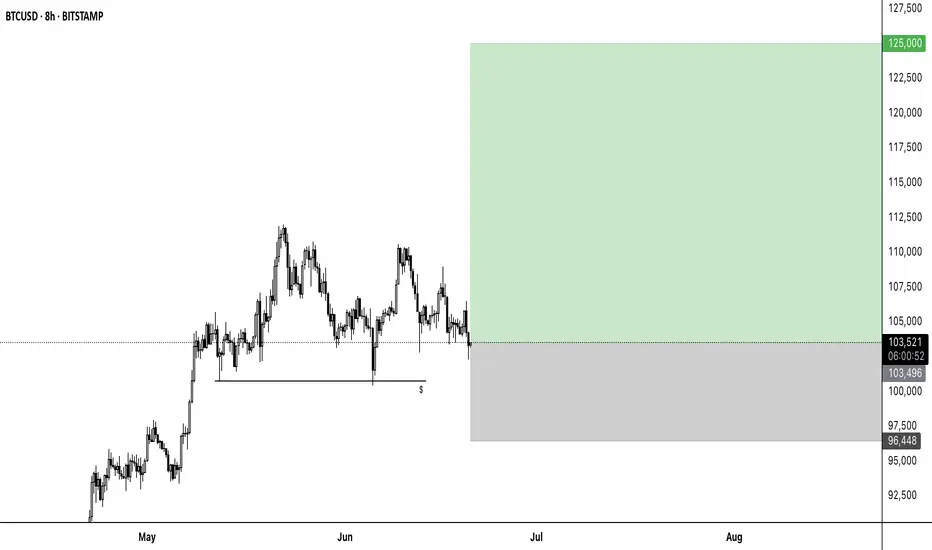
BTC to 125000📈 BTCUSD Long Setup – Maximum Fear Often Marks the Bottom
Timeframe: 8H
Entry: ~103,500
SL: 96,448
TP: 125,000
RR: ~3:1
🧠 Market Sentiment:
The current environment is dominated by extreme fear – sentiment is heavily bearish, and interest from retail investors is strikingly low. Most market participants appear to be short or sitting in hedged positions, which ironically sets the stage for a potential short squeeze if price breaks to the upside.
🔍 Technical Context:
BTC has been ranging for weeks – support has held repeatedly.
Liquidity has been swept below previous lows – possible spring formation.
A reclaim of the 104k–105k zone could act as a launchpad.
Setup anticipates a contrarian move against the prevailing bearish bias
BTC retracement divergence between ETH and BTC suggesting shorts to discount 89k being a good price to buy if you are bullish

BTCUSD: Israel-Iran conflict like October 2024.Despite the Middle East tension, Bitcoin remains long term bullish on its 1W technical outlook (RSI = 63.167, MACD = 6883.200, ADX = 33.150). It remains supported on its 1D MA50, in fact in the same manner it was during the previous Israel-Iran conflict. I was on October 26th 2024, when Israel launched three waves of strikes against 20 locations in Iran and other locations in Iraq, and Syria. Simila to the June 13th 2025 attacks. It is more than striking how similar the two price patterns are. Assisted by the U.S. elections on November 5th 2024, a massive rally followed the Middle East conflict. A repeat of that may very well send Bitcoin to $150,000 and above.
## If you like our free content follow our profile to get more daily ideas. ##
## Comments and likes are greatly appreciated. ##

BTC, will hibernate for a few weeks from here to sub 100k.BTC rise has been impressive the last few weeks with market triggering excitement after hitting a series of ATH and finally punching the elusive100k levels, and pushing it further to 110k as a bonus.
But like with any overheated parabolic move, a cool down will need to transpire eventually. And that season is ripe now for the king of coins.
From the diagram we are seeing some curve fitting price action, with horizontal ranging at the upper channel -- indicating a bull saturation scenario.
A corrective phase to 0.5 fib levels maybe expected in the next few weeks. It did the same behavior last time. This hibernation would be healthy in the long run - and it needed to happen.
Spotted at 104k.
Target sub 100k levels / or 0.5 fib at 94k.
TAYOR.
Trade safely.

Bitcoin Could Hit as High as $400KWhen comparing our macro cycle to the 2017 cycle, we see the potential for a very parabolic run on Bitcoin. I believe Bitcoin could hit as high as $400K by 2029. This is because Bitcoin tends to follow the stock market, and I anticipate a major blow-off top coming for the stock market. I expect one more big parabolic run on the Dow Jones leading up to 2029, which would fuel Bitcoin’s rise to $400K.
The lowest I see Bitcoin going during this parabolic run is $250K. On the higher end, I could see it hitting $400K or even more. Big things are coming.
As always, stay profitable.
— Dalin Anderson

BTC Trade IdeaBTC community, this is something you guys need to see.
I tried not to pay attention to News, I look at the chart and get all my information.
Beginning of a bear market?

BITCOIN SUPPORT AHEAD|LONG|
✅BITCOIN is set to retest a
Strong support level below at 101,000$
After trading in a local downtrend for some time
Which makes a bullish rebound a likely scenario
With the target being a local resistance above at 105,000$
LONG🚀
✅Like and subscribe to never miss a new idea!✅
Disclosure: I am part of Trade Nation's Influencer program and receive a monthly fee for using their TradingView charts in my analysis.

Become Rich Trading Bitcoin Strategy Simplified Correction NullIs this a shakeout or a rejection?
A rejection implies no bullish action short-term thus lower prices. It is still early on the current move.
A shakeout implies a bear-trap and bullish action soon to follow, as soon as the shakeout is complete.
Daily and weekly close
Let's be fair and honest, it is too early to say. To determine if the current move is either a rejection or a shakeout we have to wait for the close today.
Price action
Why are these two in question? Because the daily session moved higher today reaching $106,500 followed by lower prices. The low hit $102,309, lower than 13-June but higher than 5-June, a higher low. More information can be acquired once the trading session closes but, we can move ahead and see what the chart has to say based on other signals.
The volume is low on the bearish side, on all sides. The higher low so far is strong. As long as $102,000 holds Bitcoin is ultra-hyper bullish, very strong. Even if we are considering the short-term it doesn't matter, if the action is happening above this level the bulls are wining and that's what we have.
If the action is happening above $100,000 we already know what this means and this level is not in question right now. Being price oriented that is why I say is still early, do you agree?
So, more shakeouts, more sideways, more retrace—a non-event; short-term noise.
We are looking for the next major move, not the next $1,000 drop.
Market conditions do not change
Rest easy, Bitcoin will continue bullish even if it wicks below 100K. As long as it trades above this level, or the $100,000 to $102,000 price range, the action is safe (coming from the bulls).
If the week closes above this range but starts red next week and goes below, no need to panic because the week can start red just to recover and this would only be a continuation of the shakeout; we take information from the weekly close and not the intra-week action makes sense?
Questions —Leave a comment
So, what is your take?
Just let me know truly, what is your belief?
Do you think Bitcoin is bearish or bullish?
It can be looked at in many different ways.
The bull market
The trend is bullish, mid- to long-term. The action is happening above 100K.
The altcoins market is weak but we all know from the bottom we grow, we are entering the summer now... Ahhh, the beautiful summer, bring the heat. With the summer prices tend to grow.
You can call it a relief rally but that will be only the start. The relief will turn into a major bullish wave and this wave will transform into a major bull run.
Motivation
I love you again wishing you the best forever more.
You deserve the best now and always.
Keep at it and keep trying, persistence is the key. As long as we continue to trade, in the end we are sure to win.
Invest in Crypto, it is very easy.
Think of all the people that joined us (the market) 10 years ago. What are their holdings worth now? Millions upon millions... Now, think of yourself 10 years into the future. Put whatever money in you can afford and watch it grow.
The way to riches is not through frugality or savings, the way to riches is through buying and investing. This is the right market for us. It is fast, it is volatile, it is young; just like most of us. If not young of age, we are young at heart.
Namaste.

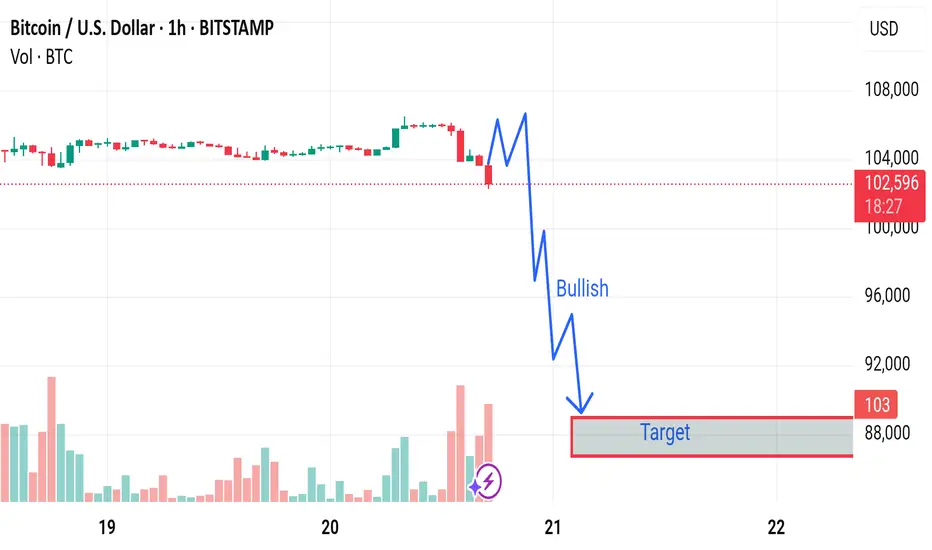
Market next forecast 🔄 Disrupted Analysis: Bullish Counter-Scenario
🧠 Original Bias:
The chart predicts a strong bearish move, with a target around 88,000 USD.
The label "Bullish" seems misleading as it’s placed in a steep downward move.
---
📉 Issues With the Original Analysis:
1. Volume Misinterpretation:
Increasing red volume could indicate capitulation or a temporary panic sell-off, not necessarily the start of a new trend.
A bounce could follow if buyers step in.
2. Support Zone Ignored:
The analysis overlooks any previous support levels in the 100k–98k range, where buyers may be waiting.
3. No Confirmation for Breakdown:
The chart does not show a completed breakdown of a key structure or trendline.
The blue squiggle assumes a breakdown will happen, but no technical confirmation is visible.
---
📈 Disruption Scenario: Bullish Reversal Possible
Rejection from 102k zone could be a liquidity grab, not the start of a downtrend.
Middle East Tension: Read This Before You Trade today⚔️🕊️💣 Middle East Tension: Read This Before Markets close for the Weekend 🌍🔥✌️
Video:
Hey traders,
Today’s landscape is delicate and raw: we stand between a possible US strike on Iran and a chance for leaders to step back from the edge. Many are asking: Should I bet on gold? Should I short the indices? Should I buy oil?
Here’s my honest read, straight from today’s video (which I highly recommend you watch for full context 📺):
👉 Bitcoin (BTC)
Still ranging sideways. The last move hit my resistance zone perfectly. For now, BTC keeps its cool — but watch out: global fear can spark sudden moves, or the opposite, a liquidity crunch.
👉 Gold & Silver
Yes, they’re classic safe havens — but don’t fall for the textbook trap. When true chaos strikes, big players often sell profitable gold positions to cover losses elsewhere. So an initial spike is possible, but deep pockets can reverse it fast. This is why I’m cautious: I do not expect a guaranteed pump on gold or silver.
👉 Crude Oil (WTI)
The chart says it all: any strike in the Middle East fuels oil prices fast. But as I’ve always said — I do not long oil during human tragedy. Ethics over easy pips.
👉 Indices & USDJPY
Gaps are likely. Risk assets may get hammered if bombs fall. If leaders choose dialogue instead, expect a risk-on rebound. The USD stays a wildcard: trust in the US remains, but shocks test that trust.
👉 Airlines Pausing Flights?
Yes — major airlines are avoiding the Gulf. That alone signals how real this risk is.
✅ My plan is clear:
I never short disasters. I never profit from pain. I am LONG on humanity and peace. I’d rather lose a trade than wish for blood in the streets.
I do have some carefully calculated positions open tonight — fully risk-managed and small-sized. If Monday gaps bless me, fine. If peace wins and my trades lose? Even better.
👉 Watch the full video for my live charts, context, and unfiltered thoughts.
This text is just a recap — the full idea is already posted as a video.
Stay sharp. Stay ethical. Protect your capital and your soul — one good trade is never worth your humanity.
One Love,
The FXPROFESSOR 💙
Disclosure: I am happy to be part of the Trade Nation's Influencer program and receive a monthly fee for using their TradingView charts in my analysis. Awesome broker, where the trader really comes first! 🌟🤝📈
