Expect BTC/USD to drop to 102000 post-Fed rate decisionBTC/USD Update 📈
BTC rebounded from 103500 support, now at ~105500. Short-term correction may test 100000 psychological support ⚠️
I think the Fed's interest rate decision this time may cause BTCUSD to drop directly to 102000 .
⚡️⚡️⚡️ BTCUSD ⚡️⚡️⚡️
🚀 Sell@ 105000 - 104500
🚀 TP 102500 - 101500
Accurate signals are updated every day 📈 If you encounter any problems during trading, these signals can serve as your reliable guide 🧭 Feel free to refer to them! I sincerely hope they'll be of great help to you 🌟 👇
BITCOIN trade ideas

Ascending Inverse H&S on the BTC weekly chartThe longer it takes to break above this neckline the higher the breakout target will be. I have arbitrarily placed the measured move line at July 18th 2025. If the breakout were to happen on that day the measured move target is around 208k, which could take quite awhile to reach or if we entered a truly hyperparabolic blow off top we could reach such a target way quicker than when the dotted measured move line reaches it. *not financial advice*


₿itcoin: Holding steadySince our last update, Bitcoin has traded in a relatively stable range. As expected, there's still a strong case for the crypto leader to climb into the upper blue Target Zone between $117,553 and $130,891. However, a deeper pullback below the $100,000 mark remains a real possibility before that move unfolds. Regardless of the path it takes, we continue to expect Bitcoin to reach this upper zone, completing green wave B. From there, a corrective wave C—also in green—is likely to follow, driving the price down toward the lower blue Target Zone between $62,395 and $51,323. This move would mark the end of the broader orange wave a. For now, we’re watching for a potential b-wave recovery before the final leg lower toward the bottom of blue wave (ii) takes shape. That said, there's still a 30% chance that blue wave (i) isn’t done yet and could extend significantly above $130,891 before any meaningful correction begins.
📈 Over 190 precise analyses, clear entry points, and defined Target Zones - that's what we do.

BTCUSD BTCUSD – Bearish Setup in Bullish Trend (Scalp Trade Idea)
Position: Short
Entry: $105,360
Take Profits: $104,500 / $104,000
Stop Loss: $106,000
Trend Context: Uptrend – shorting overextended price move

Iran-Israel Affected Btc MarketThe conflict between Israel and Iran has escalated since the initial strike on Friday. After sustaining a wide-scale strike on nuclear facilities, ballistic missile factories and military commanders, Iran retaliated by launching drones and missile attacks on Israel.
Reuters reports that Iran has rejected calls for a ceasefire, while Israel has vowed to make Tehran pay for Monday's dawn attacks on Tel Aviv and Haifa. The world remains on edge amid looming escalation.

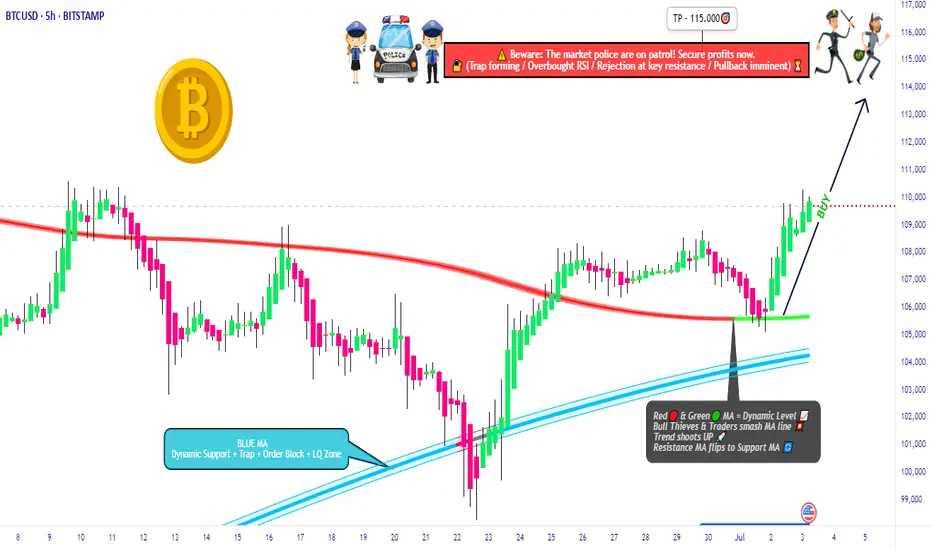
BTC/USD Heist Mode: Buy Low, Escape Rich🔓 BTC/USD Crypto Vault Breach: Thief Strategy for Long Entry Robbery (Swing/Day Setup) 🔓
🌟Hi! Hola! Ola! Bonjour! Hallo! Marhaba!🌟
Dear Money Makers & Robbers, 🤑💰💸✈️
🚨 Welcome to our next Thief Trading-style breakout mission — this time targeting the mighty BTC/USD vault. Using a fusion of technical precision and macro-level insight, we're charting a long entry blueprint for a profitable heist.
🔑 Entry Plan
"The vault is open!" 💥
Buy at current price or set Buy Limit near swing lows (15–30min timeframe pullback entries). We're timing the entry with stealth—precision over panic.
🛑 Stop Loss Setup
SL set near recent swing low (4H TF reference: ~104.000).
Adjust based on position sizing, risk appetite & multi-order tactics.
🎯 Take Profit Target
Targeting 115.000—or exit earlier if price action stalls. Get in, get out. Efficiency is the code.
👀 Scalpers' Notice
Only work the Long side. If your bag’s heavy, strike instantly. If light, ride with swing robbers. Use trailing SLs to protect your bag.
📈 Why We’re Bullish
Market momentum favors the bulls:
Overbought zones acting as lures
Bearish traps ready to flip
Key confluences from sentiment, COT, on-chain & macro analysis
➡️ Full supporting breakdown available 👉👉🔗🔗.
📢 Risk Note – Stay Sharp
Major news events = increased volatility ⚠️
Avoid entries during news. Trail stops to protect running profit. Rob smart.
💖 Boost the Crew
If this blueprint aligns with your mission, hit that Boost button. It fuels the team, and together, we profit like pros. One heist at a time. 💪🎉
🧠 Stay ready—next plan drops soon. Until then, rob safe, rob smart. 🐱👤
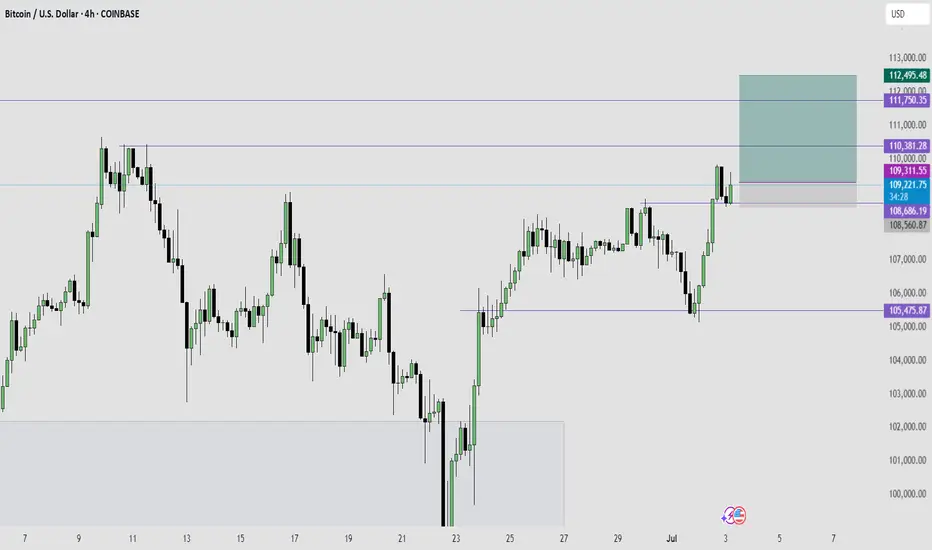
BTCUSD – Rejection or Reload?BTC surged from $105K to above $110K in one of the strongest single-day impulses lately. Price is pausing at resistance near $110,300 with a minor pullback in play. The structure remains intact unless it drops below $108,600. Above $110,300 would unlock next leg higher.

Btcudt techinical analysis.Btcusdt techinical analysis next move posibale at h1 time frame.not finchinal advice.

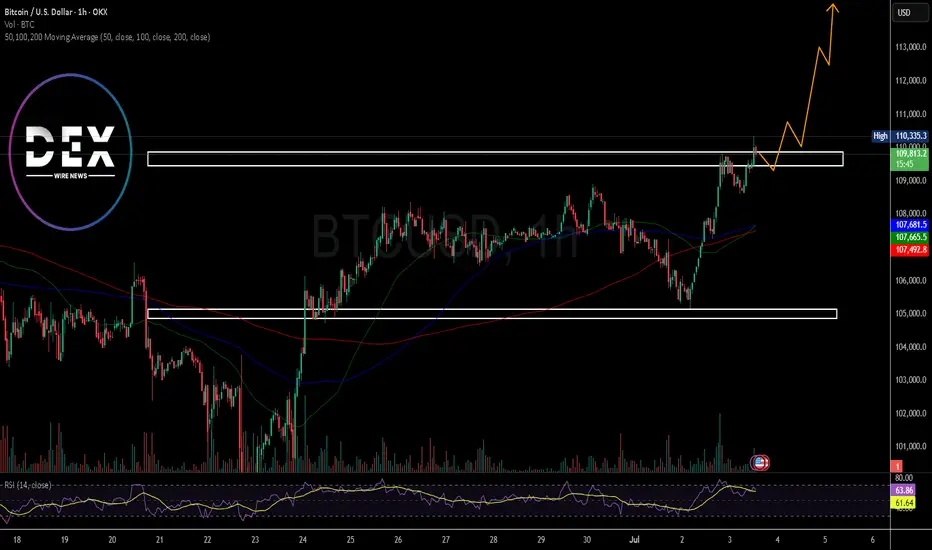
Breaking: Bitcoin Just Broke the $110k Resistant Next Top $115kThe price of the first crypto currency ever created saw a noteworthy uptick to reclaim the $110k price point however, the move was short-lived as the asset retraced to $109k mark but present price chart depicts a move to the $115k resistant point in the short term.
With the Relative strength index (RSI) at 63, Bitcoin might be inches away from claiming the $115k pivot amidst build up momentum and institutional adoption. further bullish metrics include the asset trading above the 50, 100 and 200-day Moving Averages (MA) respectfully.
Btcusdt techinical analysis.Btcusdt techinical analysis target successfully achived at h1 time frame.
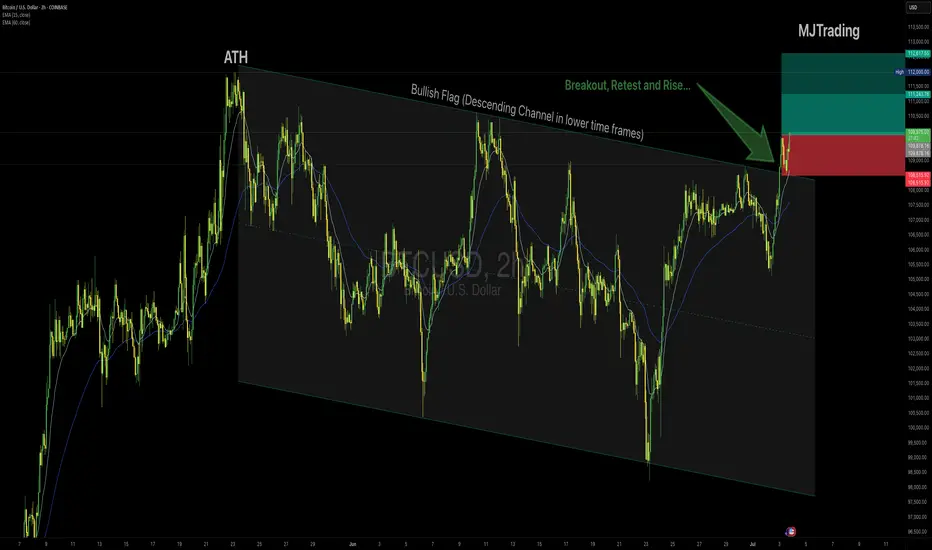
BTC Setup: 2.7 R:R"Bitcoin Poised for New Uptrend After Bull Flag Breakout Retest"
Bitcoin appears ready to begin a new uptrend after successfully retesting the breakout from a bull flag pattern and completing consolidation above key support.
This setup offers a 2.7:1 risk-to-reward ratio, with the following trade parameters:
Entry: $109,965.79
Stop Loss: $106,300
Target: $120,000
July 3 Bitcoin Bybit chart analysis
Hello
This is Bitcoin Guide.
If you "follow"
You can receive real-time movement paths and comment notifications on major sections.
If my analysis was helpful,
Please click the booster button at the bottom.
Here is the Bitcoin 30-minute chart.
There will be a Nasdaq index announcement at 9:30 and 11:00 in a little while.
I created today's strategy based on the Nasdaq pattern and Tether dominance vertical decline conditions.
*One-way long position strategy when the red finger moves
1. $109,838 long position entry point / stop loss price when the purple support line is broken
2. $111,549.7 long position 1st target -> Great 2nd target
The 1st section at the top and the 2nd section at the bottom are sideways sections.
Even if the strategy fails, if the green support line is not broken,
it is good for a long position.
Below that
Bottom -> Please note that it is open up to 107,841.4 dollars
Up to this point, I ask that you simply use my analysis for reference and use only
I hope that you operate safely with principle trading and stop loss prices.
Thank you.

BTCUSD – Long Setup (2H Chart)👆👆🚀🚀Boost it if you like it (Thanks)🚀🚀👆👆
Idea:
Bitcoin is breaking out above the descending Flag after testing the upper boundary multiple times, showing bullish momentum confirmed by price holding above the 15 EMA and 50 EMA. The breakout aligns with strong impulse candles and sustained buying pressure.
Entry:
✅ Buy near $110,000
Stop Loss:
🔴 Below $108,500, under the breakout structure to protect against a false breakout.
Take Profit:
🟢 Tp1 $111,245
🟢 Tp2 $112,600
Rationale:
Clear breakout of the channel top resistance.
Bullish EMAs crossover with sustained slope.
Strong impulse move suggesting continuation.
Risk Management:
Position size accordingly, max risk 1–2% capital per trade.
#Bitcoin #BTCUSD #CryptoTrading #Breakout #LongSignal #TradingView #TechnicalAnalysis
$BTC Weekly Continues to follow the script!BTC appears to have completed a shallow wave 2 retracement showing investor excitement and demand - They just can't wait to buy some!
New all time highs are expected this week (perhaps today) once the High Volume Node resistance we are currently at is overcome (obviously).
Wave 3 has an expected target of the R3 pivot $190k but i am expecting price to overextend this cycle to at least the R4 pivot at $233k.
Safe trading

Bitcoin Eyes Breakout if Clears $114,000📊 Market Overview:
• Bitcoin trades around $109,350, with an intraday high near $109,610
• Rosenberg Research notes BTC could rally ~6% to clear $114,000, potentially triggering a 25% rise to $143,000 on the back of ETF inflows, a weaker dollar, and Fed rate cut expectations
📉 Technical Analysis:
•Key Resistance: ~$114,000; followed by the psychological $112,000 zone .
•Nearest Support: $107,000 (prior highs/descending channel bottom) and key floor at $100,000
•EMA Levels:
o Price consolidates near 50-day EMA ($105,800), a crucial confluence zone
•Candlestick/Momentum:
o RSI near 50 (neutral),
o Flag pattern breakout suggests continuation potential
📌 Viewpoint:
Bitcoin may extend its rally if it breaks above $114,000, targeting $137,000–$143,000. If rejected, a pullback toward $107,000 is likely before bouncing.
💡 Suggested Trading Strategy
SELL BTC/USD at: $113,500–$114,000
🎯 TP: $110,000–$110,500
❌ SL: $114,500
BUY BTC/USD at: $107,000–$108,000
🎯 TP: $112,000–$113,000
❌ SL: $106,000

BTCUSD Trade Setup Idea on 1D Timeframe - Bullish MomentumBitcoin (BTCUSD) is currently trading at $109,348, showing strong bullish momentum on the 1H chart. The recent breakout from consolidation signals potential continuation, provided key resistance levels are breached and held.
Must Consider Analysis Timeframe : 1Day.
Strictly follow the trading rules for Entry..... only on Retracement.
SL on Previous or Close swing low.
🔍 Key Levels to Watch:
Bullish Continuation Confirmation: If price sustains above 112,150, we expect bullish momentum to accelerate.
Target 1 (TP1): 112,150 – Key breakout level that may act as support once reclaimed.
Target 2 (TP2 - Major): 121,128 – Long-term resistance and major profit-taking zone.
📊 Trade Logic:
A confirmed breakout and hold above 112,150 indicates strong buyer interest and could drive price toward 116,572 and 121,128.
The trend remains bullish as long as price holds above the breakout structure.
REMEMBER:- RESPECT THE LEVELS, LELEVLS RESPECT YOU THEN.
💡 Strategy: Monitor for retests and bullish candle confirmations above 112,150 to add or enter long positions with proper risk management.
! Disclaimer & Important Note:
This analysis is for educational and informational purposes only. It does not constitute financial advice or a recommendation to buy or sell any financial instrument. All trading involves risk. We are not responsible for any kind of loss incurred, whether financial, emotional, or otherwise. Always do your own research and consult with a licensed financial advisor before making any trading decisions.
Trading involves significant risk, and you should never invest more than you can afford to lose. Past performance is not indicative of future results.
The trade idea shared above reflects personal market interpretation and is subject to change based on new market conditions.
Posted by: THEPATELCRYPTO, 45Degree
Stay safe. Trade smart.
Follow for more ideas!
📍Posted by: THEPATELCRYPTO, 45Degree
📈 Stay safe. Trade smart.
🔔 Follow for more ideas!

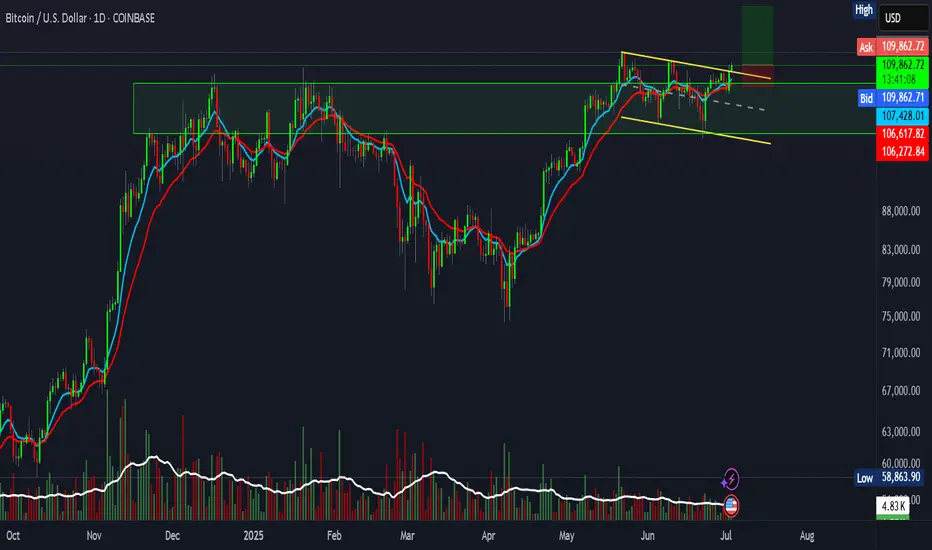
111.65 against 105KMorning folks,
So we've got great entry with our H&S but it is early to relax. To avoid long explanations - BTC has to stay above 105K lows to keep current tendency valid. So, if you still plan to buy BTC here - you do not need to watch for too deep standing Fib levels.
If BTC will still drop below 105K, we could get extended downside action to 100K and maybe even deeper.
Nearest upside target with our current plan is 111.65K.

BTC LONG TRADE IDEAThis is a bullish trend continuation trade idea on BTC.
Trend across all higher time frame is bullish.
Bitcoin – The 270/100 CycleBitcoin isn’t just trading. It’s pulsing — in cycles that reward those who understand timing as much as price.
Over the last two years, BTC has shown a repeating pattern with surgical precision:
Range Phase:
Each macro consolidation lasts ~220 to 270 days, where price builds structure, absorbs supply, and prepares for its next expansion. This is the quiet phase — the zone where conviction is tested, and weak hands exit.
Impulse Phase:
What follows is a ~100-day vertical leg, where BTC surges between +50% to +80%, targeting the next macro resistance. We’ve seen this repeatedly:
Accumulate → Expand → Re-accumulate → Expand.

14//7/2025 bitcoin predictionThis is my prediction of bitcoin it will reach at the price of $116,958 on 14/7/2025 and as you seen ive compiled all the ai prediction of the price at the same date.

$BTC/USDT 6H Update BTC has broken out and is now retesting the breakout zone.
If this level holds, we could see a push toward $111K–$112K.
Key support remains around $108K.
DYRO, NFA

BTC Falling wedgeBtc formed a falling wedge pattern and also tested the Resistance become support, and also in the major trend has broken the trendline.
