BITCOIN trade ideas

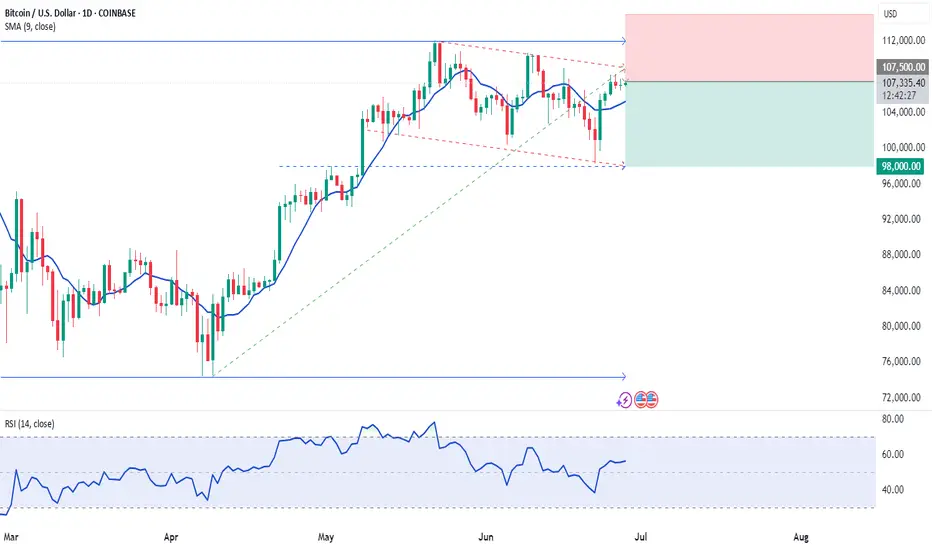
Sideways ChannelLooks like today we have bounced off the midpoint of this channel. Yesterday we dropped, today we rise!
Overall, this looks like a very neutral position. Potential for a short gain here up to previous highs with a bounce back down to lows.
No one can predict how long we will stay in this channel, but the breakout or breakdown will be very bold and very loud in one direction.
As a trend trader, I am looking to a breakup potential right now. If I had to be in a position, it would be long.

BTC?
Hi
I think we are at seed stage for this 2 Quarters.
130? or more?
Everyone.. including well paid analysts are predicting.
So what is the difference between you/I and them?
||| Nothing :: or they might be worst .. (not investing/not taking risk at all from what they write)
I make my publish notes.. I take risk.. I am bolder.. hehe
Although; I am wrong or in profits. I stick to what I believe. So should oneself.
I would spend some % into my idea.
End of day. Do not believe anyone. Do your own research and be bold. Have your Stops ready.. make sure it's wide ( so it won't hurt you after 1 minute ) :)
All the best & Not a guru
NB/ I'm vulllisssssshhhhh of crypto space
Who knows one of you larva turn into beautiful butterfly

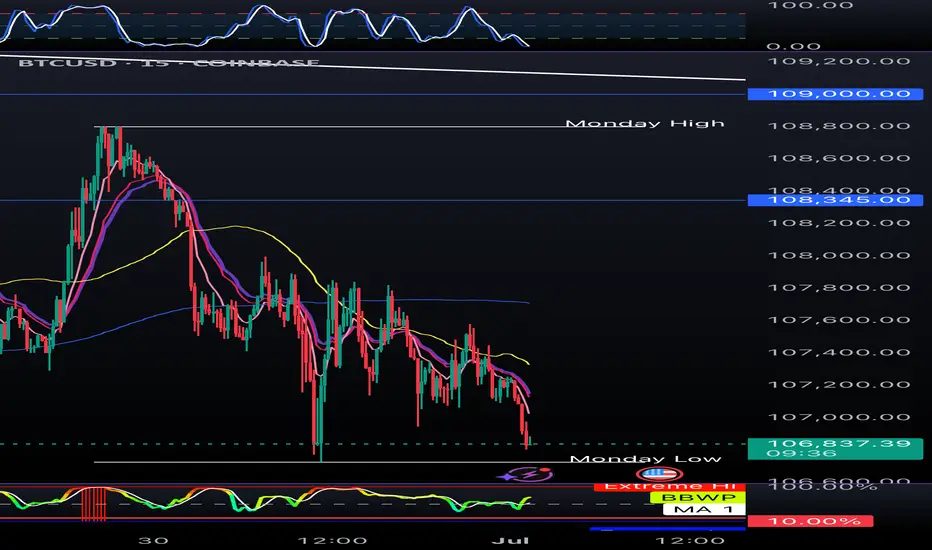
Bitcoin: 1hr Bullish AgainLooks like it will be a boring week for Bitcoin so probably ALTs will have a good run.
New Bitcoin numbers came out very close to each other meaning rest of week will be boring with low volatility.
We can expect Bitcoin entering a range for rest of week if current volatility continues.
Not much to say for now.. Top of range around 108500 to 109500.
Take care everyone.
BTC/USD 15M CHART PATTERNHere's a breakdown of your BTCUSD trade plan:
---
📈 Trade Setup
Position: Buy BTCUSD
Entry Price: 106,800
---
🎯 Take Profit Levels
1. TP1: 107,200 (+400 pips / +0.37%)
2. TP2: 107,700 (+900 pips / +0.84%)
3. TP3: 108,325 (+1,525 pips / +1.43%)
---
🛑 Stop Loss
SL: 106,028
(-772 pips / -0.72% risk)
---
📊 Risk-Reward Ratio
TP1: ~0.52 : 1
TP2: ~1.17 : 1
TP3: ~1.97 : 1
This plan shows a low initial reward, but the later targets improve the R:R considerably. Make sure your position size reflects your total risk tolerance.
Would you like help turning this into a trading journal entry, risk calculator, or script for a trading bot (e.g., in Pine Script or Python)?

Bitcoin May Break Higher if $108K Clears📊 Market:
BTC trades around $106,860, driven by strong ETF inflows and weaker USD ahead of Fed rate decisions.
📉 Technical:
• Resistance: $107,400–108,000 → breakout may target $110,000+
• Support: $106,500–106,800 → next at $105,500
• EMA: Price above EMA9 → short-term uptrend
• Momentum: RSI > 80, Stoch high → upside potential but overbought
📌 Outlook:
BTC could rise if $108K breaks. If not, expect a pullback to $106,800.
💡 Trade Setup:
🔺 BUY BTC/USD: $107,000–107,200
🎯 TP: 1000–2000 pts
❌ SL: $106,500
🔻 SELL BTC/USD: $108,000–108,200
🎯 TP: $106,800–107,000
❌ SL: $108,500

Sooo BULLISH!This structure is probably the most bullish cycle structure that BTC has ever had. So impressive! I don't think we are ready for what is about to happen :)

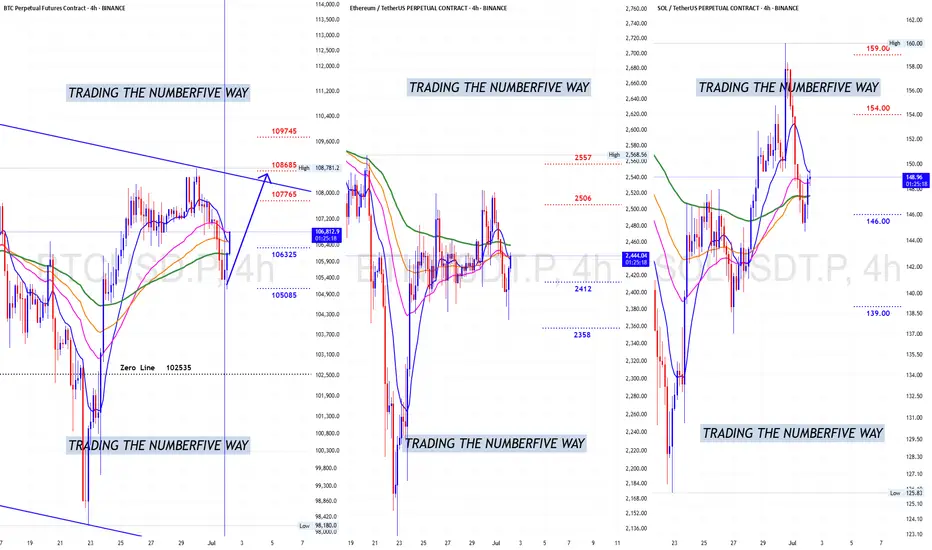
Crypto breakouts: Bitcoin, Ethereum, and Solana lead the surgeJune brought a wave of positive sentiment to digital assets. Despite global uncertainty, major cryptocurrencies continued their upward movement. Investors are once again turning to decentralized assets amid expectations of a Fed rate cut and an increasingly fragile macro backdrop.
Key moves this month :
• Bitcoin (#BTCUSD) +4.6% — Strengthened by a weaker dollar and renewed institutional interest. JPMorgan projects $150,000 by 2025.
• Ethereum (#ETHUSD) +3.8% — Gains on ETF optimism and rising DeFi activity.
• Solana (#SOLUSD) +6.1% — In the spotlight due to network scalability and new Web3 partnerships.
• Ripple (#XRPUSD) +2.4% — Rebounding after positive developments in the SEC case and potential global alliances.
• Dogecoin (#DOGUSD) +5.2% — Community-driven momentum and fresh public support from Elon Musk.
Underperformers:
• Litecoin (#LTCUSD) –1.8%, Cardano (#ADAUSD) –2.2% — Profit-taking and lack of new drivers weighed on prices.
• Polkadot (#DOTUSD) –3.1% — Weak on-chain metrics and fading interest in cross-chain solutions added pressure.
According to FreshForex analysts, the crypto market is entering a recovery phase. Signals from the Fed hint at upcoming rate cuts, while interest in decentralized projects and crypto ETFs is rising. Market leadership by #BTC and #ETH reflects growing confidence, while altcoins continue to follow the broader upward trend.

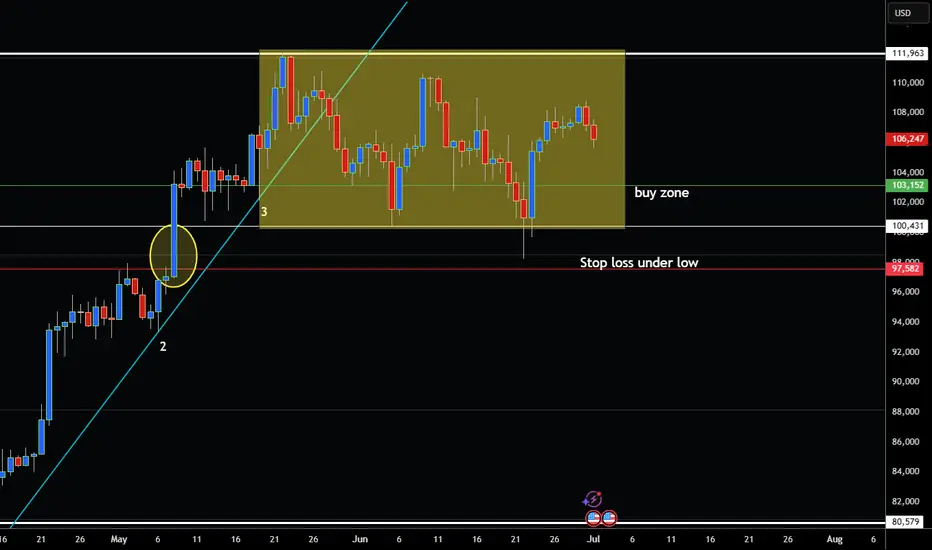
Bitcoin Stuck in Channel but Building up for Breakout?Hey Traders so today we are looking at Bitcoin currently trading in narrow sideways channel. But looking like strong support at 100,431 notice how on June 22 could not close below it.
Also notice on May 8 that was the same area for strong rally. So I think a good place to get back in this market would be half the daily candle on June 23 or a price of 103,150 or even 102,000.
Strong stop below support around 97,582 or lower.
So if bullish buy on pullback to channel support however if bearish wait for break below 96,000 that way you know market has confirmed move lower.
I think right now it's still showing bull market signs but only time will tell.
Good Luck & Always use Risk Management!
(Just in we are wrong in our analysis most experts recommend never to risk more than 2% of your account equity on any given trade.)
Hope This Helps Your Trading 😃
Clifford
Bitcoin Monthly Candle Close colour and patterns since 2011
At the beginning of June , I wrote this
""On only 2 occasions have we had a GREEN JAN, RED FEB, RED MARCH, GREEN APRIL
And Both of them were on the way to ATH. (Boxes )
On both those occasions we also had a GREEN MAY, though the gains were minimal and one was followed by a Green June and the other by a Red June."
We just got the GREEN June and so this draws my eye to the sequence on the left, ( arrow )
If we are to follow this, then July should be a larger Green (Arrow) - BULLISH
In-fact, in both the sequences we have been following ( boxes), July was GREEN- BULLISH
And using just the month candle colours, we have a higher chance of another Green candle, with July having had 9 Green to 4 Red previously. - BULLISH
However
Of the previous 8 Green June Closes , only 3 went to a Green July - BEARISH
And I have to say, on NONE of the previous Green Junes were we so close to the current ATH.
July 2021 being the closest with a price at 41K, around 18K below the current ATH at the time.
We are currently only around 200 usd below Current ATH
This adds enormous resistance to the ability to rise
I wanted a RED June because I felt it was more sustainable and would lead to a cycle ATH at the end of the year. As can be seen in the middle Box
If we look back toward the 2012 Box on the left, we may now get a Hot July / August , September and then a Cool off for October, November & December.
But something tells me this will not happen.
The Candles for our current cycle in April, May and June are diminishing in size, the opposite of 2012
But they are similar to the 2020 box, except for the red June close.
This could lead to the desired "Cooling" in August & September and a new lift off in autumn.
And if you look at the chart Candle Colour Count, , August and September are usually RED by some majority
This also gives us the Bigger Green July candle that the "Odds" point towards.
So, as ever, we have to wait and see how this plays out.
Odds in favour of a Green July using previous cycle Data
PA position just below current ATH could lead to a slightly Bearish out look in the short term.
And if you are hoping to see ALTS Rally, PLEASE keep your eye on the BTC.D chart
This also points to wards BTC ATH in Q4 this year
And then, we have the BIG question.......Will we ever see a Classix Bear again ?
With so many Holding Bitcoin LongTerm.....How would a Bear market arrive ?
BUY BITCOIN
HOLD BITCOIN
But, as ever, we just have to wait and see,

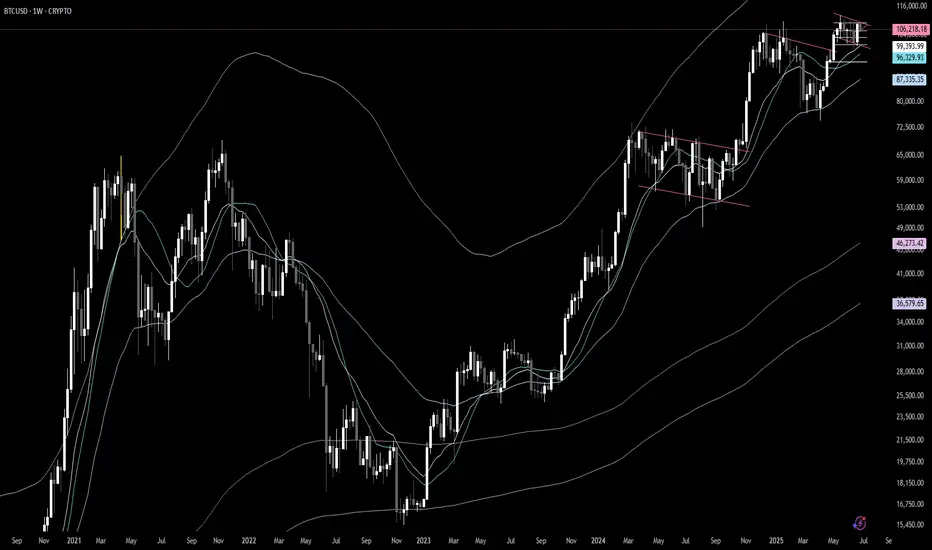
Bitcoin - The Silent Ascent of Under Institutional Custody.⊢
⟁ BTC/USD – BINANCE – (CHART: 1W) – (Date: July 01, 2025).
◇ Analysis Price: $106,464.00.
⊢
⨀ I. Temporal Axis – Strategic Interval – (1W):
▦ EMA21 – ($98,213.17):
∴ The EMA21 has provided dynamic mid-term support since early Q4 2024;
∴ Recent pullbacks respected the line precisely, confirming its role as tactical trend anchor.
✴ Conclusion: Tactical bullish posture maintained. Rejection above EMA21 signals controlled bullish continuation.
⊢
▦ Week Moving Average 200WMA – ($60,425.78):
∴ The 200WMA continues its upward ascent, now surpassing the symbolic $60k level;
∴ Price remains structurally elevated, approximately 76% above the WMA baseline, marking a strong long-term cycle support.
✴ Conclusion: Structurally bullish. The 200WMA acts as a deep support; no signs of cyclical exhaustion.
⊢
▦ Volume + MA21:
∴ Volume remains within normal bounds, with no explosive or capitulative behavior;
∴ The 21-week average volume shows steadiness, confirming institutional absorption rather than speculative frenzy.
✴ Conclusion: Price action is supported by consistent volume. There is conviction, not hype.
⊢
▦ RSI + EMA21 – (RSI: 61.01 | EMA: 60.00):
∴ RSI remains stable above the 60-threshold, traditionally a bull-control zone;
∴ The EMA21 on RSI sits just beneath it, reflecting sustainable momentum without overheating.
✴ Conclusion: Momentum is alive and consistent. Pressure is not euphoric, but persistently positive.
⊢
▦ Mayer Multiple – (1.11):
∴ The current Mayer Multiple (Price ÷ 200WMA) is at 1.11, far below critical cyclical warning zones;
∴ Historical peaks formed above 2.4–3.2×, placing current readings in neutral-to-accumulative territory.
✴ Conclusion: No signs of macro-top formation. Room for expansion remains open within cycle structure.
⊢
🜎 Strategic Insight – Technical Oracle:
∴ Bitcoin maintains an elevated stance above all major structural supports;
∴ No indicators suggest euphoric excess or terminal cycle behavior;
∴ Momentum, structure, and volume all reflect the essence of a mature but breathing bull cycle, silently advancing.
⊢
∫ II. On-Chain Intelligence – (Source: CryptoQuant):
▦ MVRV Ratio – (2.22):
∴ The current MVRV remains below the historical danger zone of >2.5;
∴ Price is elevated, but not euphoric - reflective of controlled structural ascent.
✴ Conclusion: BTC sits in the upper-middle band of valuation. No top formation indicated, but vigilance required.
⊢
▦ Exchange Reserve – (All Exchanges – 2.4M BTC (new low):
∴ Continuous decline in BTC held on exchanges since Q4 2022;
∴ Signals that coins are being withdrawn to self-custody – typical of conviction-based accumulation.
✴ Conclusion: Supply is drying from trading venues. This is fundamentally bullish and reduces short-term dump risk.
⊢
▦ Realized Cap – ($958B):
∴ The realized capitalization is climbing in tandem with price - without flattening or divergence;
∴ Indicates strong inflow of high-conviction capital setting new cost-bases.
✴ Conclusion: Market is absorbing price increases via real buyer interest. Structural support is being rebuilt at higher levels.
⊢
▦ Short-Term Holder Realized Price & Profit/Loss Margin:
∴ Profit margins are rising but remain beneath the historical 70% “euphoria line;”
∴ No extreme deviation between spot price and realized price.
✴ Conclusion: Profit-taking is occurring in equilibrium. No signs of unsustainable speculation.
⊢
▦ Spent Output Profit Ratio – (SOPR - 1.036):
∴ Values above 1 indicate net selling at a profit;
∴ However, the ratio is stable and modest – no spike.
✴ Conclusion: Profitable selling is active, but not excessive. Market is cycling profits without panic or climax.
⊢
▦ Stablecoin Supply Ratio - (SSR – 17.6):
∴ A high SSR means fewer stablecoins relative to BTC -> lower immediate buy-side liquidity;
∴ This aligns with observed euro-stablecoin inflows and USD retreat.
✴ Conclusion: Bitcoin price is rising without massive stablecoin inflow. Potential for future upside if SSR compresses.
⊢
🜎 Strategic Insight – On-Chain Oracle:
∴ All six indicators converge on a structurally bullish;
∴ Tactically stable market;
∴ There is no evidence of blow-off top, exhaustion, or manic distribution;
∴ Supply is retreating, valuation rising moderately, and profit cycles remain rational.
⊢
⧉ III. Contextvs Macro–Geopoliticvs – Interflux Economicvs:
▦ Macro-Structural Narrative:
∴ Bitcoin closed Q2 2025 with a +29.9% quarterly gain - (source: CryptoRank);
∴ The rally is attributed to growing institutional adoption, bolstered by pro-Bitcoin policies of the Trump administration, including treasury-on-chain initiatives;
∴ Macroeconomic tension around trade wars has eased, fueling upward movement in both BTC and the S&P 500, signaling synchronized risk-on appetite - (source: Coindesk).
✴ Conclusion: The quarterly momentum reflects fundamental confidence, not speculative heat, Bitcoin is tracking macro cycles and policy favorability - not detaching from economic logic.
⊢
▦ Liquidity Rotation Signal:
∴ While BTC saw a record monthly close above $106K in June, attention turned to the Euro, which surged ~4%, outperforming Bitcoin ~2.5% monthly gain - (source: Coindesk);
∴ This signals capital movement out of the USD and into alternative monetary zones, including euro-pegged stablecoins, highlighting a shift in liquidity strategy.
✴ Conclusion: Bitcoin performance remains strong, but stablecoin flows suggest hedging against USD, and potential cross-currency dynamics now influence crypto markets more than in past cycles.
⊢
▦ Institutional Absorption:
∴ Q2 2025 marked multiple treasury-scale Bitcoin purchases, the most notable was Strategy Inc.’s addition of $531 million in Bitcoin;
∴ Coindesk reports increasing movement of aged coins, suggesting long-term holders are realizing profit selectively, not exiting fully;
∴ Realized on-chain gains estimated around $2.4 billion, but SOPR and STH-P/L data show no speculative frenzy.
✴ Conclusion: Institutional reaccumulation is active - distribution is rational, not euphoric, the market is cycling profits, not dissolving conviction.
⊢
▦ Sentiment & Policy Alignment:
∴ Trump’s active endorsement of Bitcoin as a "strategic reserve instrument" has galvanized corporate treasuries and conservative capital;
∴ Policy signals from the U.S. now mirror early El Salvador-like rhetoric but on a scaled geopolitical stage;
∴ Meanwhile, legislative friction in the EU is softening, with euro-stablecoin flows confirming multi-jurisdictional bullish alignment.
✴ Conclusion: Bitcoin is evolving from speculative asset into a political-economic monetary instrument. Its adoption curve is now influenced by state-level policy vectors, not just market actors.
⊢
⧈ Synthesis – Silent Codex Verdict:
∴ Bitcoin’s Q2 expansion is rooted in structural convergence: (policy + macro easing + institutional inflows + on-chain discipline);
∴ The asset is not overheated, and continues to mature within a globalized, politically aware framework;
∴ The cycle breathes silently, with strength.
⊢
⌘ Codicillus Silentii – Strategic Note:
∴ Resistance remains near $110K–112K, region of monthly closure highs;
∴ EMA21 at $98K defines tactical floor - breach would signify shift in short-term conviction;
∴ SSR at 17.6 suggests temporary stablecoin dryness, delaying momentum ignition.
✴ Conclusion: Tactical posture is consolidative, awaiting macro or capital inflow catalyst.
Upside remains open, but not yet inevitable.
⊢
𓂀 Stoic-Structural Interpretation:
∴ Structurally Bullish – (Tactically Controlled);
∴ Bitcoin maintains long-term structural dominance, anchored above the 200WMA and supported by rising Realized Cap and exchange outflows;
∴ The RSI + EMA21 structure confirms active but non-euphoric momentum;
∴ MVRV at 2.22 and SOPR at 1.03 reflect profitable cycling, not late-stage irrationality;
∴ No blow-off volume or destabilizing divergence across timeframes.
✴ Conclusion: Bitcoin is in mid-cycle ascension, exhibiting maturity, discipline, and policy-aligned backing. The structural bullish thesis is intact.
⊢
⧉
⚜️ Magister Arcanvm – Vox Primordialis!
𓂀 Wisdom begins in silence. Precision unfolds in strategy.
⧉
⊢

BTCUSD entering 3rd bear market cycle BTCUSD has bounced off of the top of a 4H descending channel and has now began moving in the 3rd bear market cycle
i will be watching for the market to reach the mid line in the channel and possibly to the bottom of the channel for another retest.
Opinion: This analysis is for education purposes only and is just my analysis, this is not a trade idea.
SHORT ON BITCOINBITCOIN has continue to create lower highs at a major resistance zone.
I will be selling bitcoin looking to make over 8000 to 20,000 points.

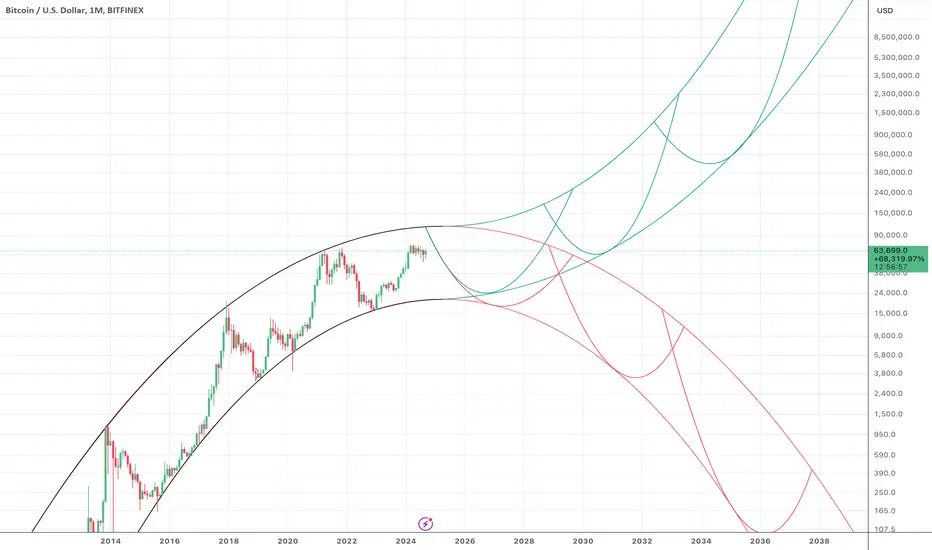
BTCUSD - The Binary Set of Possible Futures for BitcoinBitcoin priced in dollars will eventually go to infinity or to zero.
This chart is a more precise model of an idea I've been toying with for a few months. It fits the past price cycles extremely accurately, if we are willing to disregard the lower end of the Covid crash wick and stick to monthly closes. It also predicts the binary set of possible futures for Bitcoin in an extremely elegant way.
According to this model, regardless of which path Bitcoin price takes after this cycle, we will see a top around $111,800 around spring 2025 - April 2025 if it hits the nadir of the arch exactly.
We will have a strong clue about which of the two futures (infinity or zero) Bitcoin is headed towards when we see whether it bottoms near $16,000 (Bitcoin to Zero) or bottoms near $24,000 (Bitcoin to Infinity) next bear market.
The model predicts hyperinflation of the dollar in 2037 on the "Bitcoin infinity path," or alternatively Bitcoin to digital trash in 2036 on the "Bitcoin zero path."
BITCOIN BEARS ARE GAINING STRENGTH|SHORT
BITCOIN SIGNAL
Trade Direction: short
Entry Level: 106,743.04
Target Level: 99,806.18
Stop Loss: 111,349.12
RISK PROFILE
Risk level: medium
Suggested risk: 1%
Timeframe: 1D
Disclosure: I am part of Trade Nation's Influencer program and receive a monthly fee for using their TradingView charts in my analysis.
✅LIKE AND COMMENT MY IDEAS✅

BTC 93k first or 120-124k end july, both possiblehere is my vieuw of Bitcoin for the next next 2-3 months,
i think btc can hit 93k before going to 120k+ but if market remains bullisch structure we might hit first 120-124k before going lower to 93,
its very possible we test 93k first then 120-124k and test 93k again so we print a double bottom there like i show on the chart, double bottom schould bring us slowley to 140k by begin-mid september,
people think bullrun tops in oktober-dec, all social media is expecting that but in crypto always the opposite happens what the massa think, i think cycle tops 2025 september.
we will go to 160k in q1 2026, but thats another story lets see how this play out first,
have a nice day all its just my vieuw of btc at the end is crypto and nobody knows

False move week beginning False move week beginning. Looking for strong or steady bounce at Mon range bottom
BTC SHORTThe actual strength index can decline even while the price rises. I anticipate BTC will drop by 10-20% in the coming days. Consider shorting.

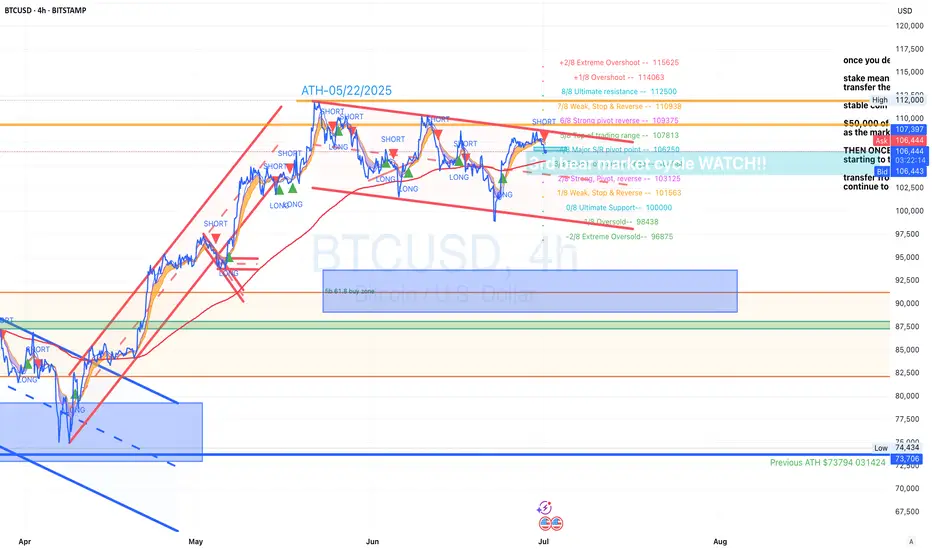
BTCUSD 7/1/2025Come Tap into the mind of SnipeGoat, as he gives you a quick Top-Down Analysis as Price has produced a new Monthly Candle. With a new Monthly Candle print, Price deserves a new Top-Down to keep us in perspective & understanding of what Price is doing.
_SnipeGoat_
_TheeCandleReadingGURU_
#PriceAction #MarketStructure #TechnicalAnalysis #Bearish #Bullish #Bitcoin #Crypto #BTCUSD #Forex #NakedChartReader #ZEROindicators #PreciseLevels #ProperTiming #PerfectDirection #ScalpingTrader #IntradayTrader #DayTrader #SwingTrader #PositionalTrader #HighLevelTrader #MambaMentality #GodMode #UltraInstinct #TheeBibleStrategy

28.06.2025 #BTCUSDSELL 107500 | STOP 115000 | TEKE 98000 | A clear price movement in a medium-term wide sideways channel has been defined. We expect the price to decline to the lower boundary of this channel and consolidation under the level of 102000. Breakout of the maximum of 112000 and further continuation of BTS growth in the short term is not considered.
Bitcoin’s Breathing Zone – Watching for a Natural Snap Setup📊 Bitcoin Daily – Probabilistic Swing in Play
Tracking the Snap Zone & Energy Reset
I’m watching a probabilistic swing scenario on Bitcoin where the price might need to dive into the 100k - 101k zone to build enough energy for the next major move.
The key area I’m tracking is the EMA 200 on the daily chart (~95k - 97k).
This would be the natural deep target if the price sweeps lower. The EMA 200 often acts as a long-term support where markets "reset" and gather strength.
👉 It’s also worth noting: Institutional traders traditionally view the daily EMA 200 as a key buy zone in an overall bullish market structure.
That’s where many large players reload positions, aiming to ride the next expansion wave.
👉 Important: I don’t necessarily expect the EMA 200 to be perfectly reached.
In most cases, price tends to bounce just before touching the EMA 200.
It’s smart to add some buffer space above this level when planning entries – waiting for an exact touch can often leave you behind.
What I’m expecting:
A retracement into 100k - 101k to snap the short EMAs together.
A potential liquidity sweep below the EMA 100, possibly near the EMA 200 zone.
Key bullish signals: wick rejections, strong bounce candles, and engulfing patterns on the 4h or daily.
This would set up the energy for a clean bounce and a probable move towards the upper yellow trendline around 124k.
Without this deeper retracement, the move would likely run out of steam earlier, probably capping out around 112k.
I trade probabilistic scenarios based on natural price swings, EMA wave dynamics, and energy compression zones.
📌 Chart and path idea attached.
What’s your view? Are you watching this zone?

Bitcoin Analysis – June 29, 2025
Previously, we highlighted the challenge for Bitcoin in breaking above the $110,000 level —
and now on-chain data is reinforcing that expectation.
🔍 A significant portion of long-term holders (3+ years) have been taking profits near this zone,
creating a strong resistance between $100K–$110K.
💡 For now, there's room for short-term range trading within this band,
but for the next major bullish leg to begin, we may need to see a deeper pullback —
possibly toward the $93,000 level.
📌 That zone could offer a healthier base for the next upward move.
