Why I think Chainlink is the best bet for the dayLooking to me like link has broken a daily down trend and may be attempting to establish some support. On the hourly levels it has broken a down trend and appears like it may want to begin building stairs. Looking at bitcoin I believe we have potential to also break a down trend and if so, we could have great momentum to attempt breaking into the previous range. I feel today will show us a lot about short term price action to come.
BITCOIN trade ideas

BTC cup and handle: 128k soon?I see a nice cup and handle confirmed and broken up on the daily chart. If this is correct we could see 128k as a nice target. There’s still a resistance at 104k first, we’ll see after that.

BITCOIN BUY SCALPBitcoin will be now head to the up side and correct itself a bit as it’s been selling buy now we can expect a short dip to buy


Bitcoin profit-taking hits sentimentLast week saw the largest realized profit on record for Bitcoin, with over $3.7 billion worth distributed, according to Glassnode (as of July 29). Since then, Bitcoin has struggled to recover, suggesting a shift in sentiment toward short-term profit-taking and distribution. After the big profit-taking action, we see a shift in the fear and greed index from almost extreme greed (74% on 30 July) to neutral levels (54% on 6 August).
On one hand, this shift in sentiment might be only temporary and mostly fueled by profit-taking activity; on the other hand however, this might be just a short correction in the prolonged bullish run of last month, only time will tell.
From the technical analysis perspective, Bitcoin's price has rebounded both ways at the 23.6% and 38.2% daily Fibonacci retracement levels and is currently hovering around the $144,100 level. The moving averages are validating the overall bullish trend in the market despite the recent selloff, while the Bollinger bands have expanded, showing volatility is getting hot mostly because of the profit-taking activity mentioned above.
The Stochastic oscillator is still holding on to neutral levels; however, it's still below the 50 level, hinting at being more prone to selling pressure for the time being.
Disclaimer: The opinions in this article are personal to the writer and do not reflect those of Exness

BTC ROADMAP 2025/2026this is a better chart with altseason in it, the fed meeting can be a huge sell the news event,
altcoins schould bottom 11 aug and schould pump till 11/15 sept.

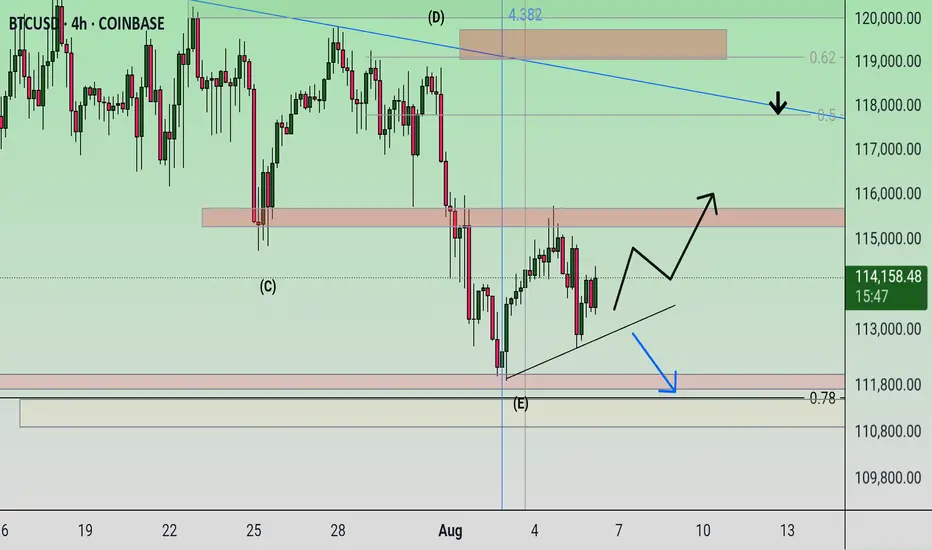
BTCUSD 8/6/2025Price has broken 4hr Bullish Structure & took 12hr Lows @ Daily TF Highs, which can induce the Daily TF Bearish Continuation targeting Lows. Let's see what Price does....
_SnipeGoat_
_TheeCandleReadingGURU_
#PriceAction #MarketStructure #TechnicalAnalysis #Bearish #Bullish #Bitcoin #Crypto #BTCUSD #Forex #NakedChartReader #ZEROindicators #PreciseLevels #ProperTiming #PerfectDirection #ScalpingTrader #IntradayTrader #DayTrader #SwingTrader #PositionalTrader #HighLevelTrader #MambaMentality #GodMode #UltraInstinct #TheeBibleStrategy

Possibility of uptrend A trend change is expected to form within the support trend line and the continuation of the upward trend is expected. A break of the resistance level will be a confirmation of the upward trend. If the support trend line is broken, a continuation of the downward trend is likely.
Bitcoin Long-Term Investment Outlook 1W [Disc On]Bitcoin Long-Term Investment Outlook
Technical Analysis:
A bearish stochastic divergence has formed on the weekly (1W) chart, indicating a potential trend reversal downward toward the Fibonacci cluster support zone.
Conclusion: There is a high probability of seeking BUY positions at the psychological levels of 107,300 – 103,400 and 92,800 – 91,800, with a Take Profit target at 140,600.
(Note: Always confirm with volume and macroeconomic factors before execution.)

135K COMING! Retrograde rallies!Heres a quick update on my take on Bitcoin reacting to Mercury retrograde, the moon cycles and our lunar eclipse in early September.
We are at our last stages in this bull market before BTC starts bleeding into September. It's critical to know how we are sitting technically, so please stay calm and observe the market neutrally.
- 112K Support is holding firm, this level is critical as Mercury retrograde enters Q3, which Quarter 3 has been historically bullish for Bitcoin.
- However, bearish energy could still linger until August 14th, as that date is within a 5 day window of a full moon. From now until the 14th will be a cooling zone and consolidation zone. Our RSI is sitting nice and neutral, not reacting to much to the recent drop, meaning more room for upside.
- From August 14th - 28th, we will start to see euphoria in the market. After we are supported on the 117.5K level a 15% rally could take us to the 1.618 FIB level, i'm taking profits at 135K.
- After that, we face the second lunar eclipse of this cycle on September 7th. Historically every Lunar eclipse has bearish energy, and I'm excepting to re accumulate after a 30 - 35% correcting from the recent top out.
This will be the end of the Bitcoin rally, naturally creating a bleed from BTC into the ALT's, Bitcoin will drop as well as dominance and ALT season will kick in. Bye Bye BTC until march for a little swing...

Bitcoin has become very popularIn one case a person lost a Bitcoin ticket at cost over $300 billion that was thrown away in which they searched for it in a gigantic garbage dump for 8 years and finally found it.
BTC Top NFA, DYOR.
Food for Thought: Rate Cut - Geopolitical Tension - BTC is up how much from the bottom? - Coinbase App Store - Retail hopping on Solana.
Enjoy.

Bull Cycle first half is over - Log off for a while.Idea above - NFA,DYOR.
Do not believe the bulltards.

Daily Analysiswe dont have a clear directional bias both on BTC and GOLD therefore we will be sitting on our hand today to see how price plays out.

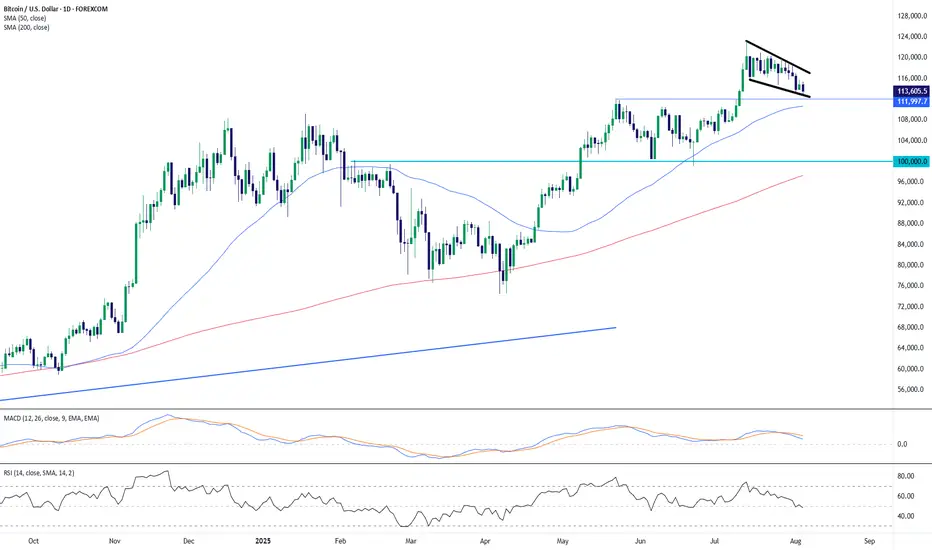
BTC/USD: Testing Key Support in a Bull Flag SetupBitcoin is currently pulling back from its July high near $122,000, but the structure on the daily chart shows a potential bull flag forming. Price action is now hovering around the $113,600–$112,000 support area, which aligns closely with the 50-day SMA ($110,627) and the lower boundary of the flag.
The broader trend remains bullish, as price continues to trade well above the 200-day SMA ($97,279), and the recent consolidation appears orderly rather than impulsive.
Momentum indicators:
MACD is in bearish territory and descending, reflecting short-term weakness.
RSI sits at 48.16, near neutral, offering room for movement in either direction.
A confirmed breakout above the flag’s upper trendline would signal potential continuation of the larger uptrend. However, a breakdown below $112,000 would invalidate the bullish flag scenario and possibly expose BTC to the psychological $100,000 level next.
Key Levels:
Resistance: $118,000–$120,000 (flag top).
Support: $113,600 and $112,000 (flag base and 50 SMA); $100,000 psychological level below.
Structure: Bull flag within a broader uptrend.
This remains a high-stakes zone for Bitcoin bulls. A decisive move out of this consolidation pattern will likely dictate the next major leg.
-MW
BTCUSDT TARGET ACHIEVED CRYPTOTHE RESULT
Follow for more Simple And accurate swing analysis on Indices, Currency, Commodities.

Where could Bitcoin and the rest of the market be headed?Just a brief overview of my thoughts on bitcoin and the rest of the market. We are currently sitting around the area that I had suspected may be our weekly low. Where we go from here is still unclear but I wanted to take time for a good overview and share my plans and how to trade it so that I could still be profitable even if we just chop for a while. Also, the potential for a true alt season may really be right around the corner. This is the type of term that has been thrown around so much lately but it has been years since we have had one. Alts have been lagging so I have some suspicion of what may happen next and share the things to look for to confirm this, and how I plan to trade accordingly.

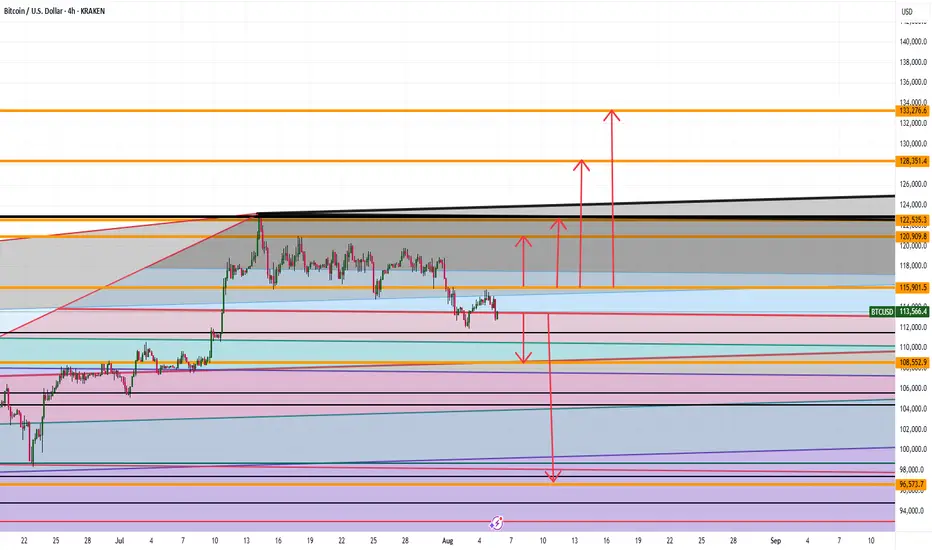
BTC Full Analysis WHERE ARE WE HEADING ???Good afternoon
SO currently with BTC we see the following:
Bullish:
If we can stay and hold above 115,900 then 120K, 122K, 128K and 133K makes sense
BEARISH:
If we close and hold under 113K levels then we can see 108, and 96K levels being hit
What do you think ? Comment Below
Trade Smarter Live Better
Kris
We're so close!!!!....Looks like the institutions are finally finished pushing the price down to buy
cheap so now we can get back to the push higher. Once we cross 116K its hasta la bye-bye, headed for the sky!
Patience padawans...

Starting the next bull run (Grab your bowl - hopium incoming)1. The following is for entertainment purposes only.
2. Do not trade on this information. You will lose your money.
3. Yes I have positions and yes I am basing my decisions off of long term analysis like this
*History doesn't repeat but it often rhymes*
Two thoughts:
1. In February 2019, 5 months after the ichimoku long term and short term trend lines crossed in 2018 on the month scale, we started to see a relief rally in the bitcoin price
It's now 5 months after the trend lines have crossed bearish again. Will we see a repeat? The ichimoku cloud seems to align with this.
2. 45 months after the 2017 peak we got the 2021 peak. If we create a trend line between those points and then project out another 45 months, we would see a peak of ~$123k. Conservative sure, but more realistic imo than all these million dollar projections.

Bitcoin Live Cripto currency target Bitcoin Live and the number 1,080,000 (likely meant to be 1,080,000 — one million eighty thousand).
Let’s break down what this number might represent in the context of Bitcoin:
🚀 Possibilities for “1,080,000” in Relation to Bitcoin:
Price in a Different Currency
If you're talking about Bitcoin's price in a currency other than USD, 1,080,000 could correspond to:
Currency 1 BTC ≈ 1,080,000 USD Equivalent
Argentine Peso (ARS) Possible (devaluation) ~$60–70 USD
Chilean Peso (CLP) Very likely ~$1,200 USD
Vietnamese Dong (VND) Not likely (1 BTC > 1.5B VND) Too low
Iranian Rial (IRR) Definitely too low 1 BTC > 1B IRR
Future Price Prediction
Are you suggesting or referencing a future prediction that Bitcoin could hit 1,080,000 USD? If so:
This is a common ultra-bullish scenario.
It’s often cited by Bitcoin maximalists or hedge funds forecasting hyperinflation or mass adoption.
Clickbait Headline / SEO Phrase
This could also be a content prompt like:
"Bitcoin Live: Could BTC Hit 1,080,000?"
I can help write an article or post using that as a headline.
✅ How I Can Help You Now:
Please let me know your goal so I can tailor the response:
📈 Do you want live BTC price info?
✍️ Do you want a blog post or headline using "Bitcoin Live" and "1,080,000"?
📊 Want me to analyze a prediction or price model that suggests BTC could reach 1,080,000?
Let me know — I can generate news-style content, social media posts, or investor briefs based on this number.

BTC Double BottomDo not be surprised if BTC gives us another double bottom before reversing its direction back into price discovery. Looks like it could achieve the second bottom around 111-112. If anyone has spent any significant amount of time in the charts knows BTC LOVES a double bottom before going higher. Also, this cycle has seen a repeated pattern of accumulation, sweeping low, reclaiming range and then expansion.
