Clear View zooming out This Pattern may be playing out and retesting but its not confirmed until we have an RSI break out -
For clarification, i dont believe we would hit the upside target given the timing but it is very possible this may be a longer term play-
Pull backs are normal but the trend way upwards would be clear.
BITCOIN trade ideas

CHECK BTCUSD SIGNAL READ CAPTAINbtcusd sell now ✅
entry point (106800.00) (106600.00)
TAKE PROFIT 1: (105800.00)
TAKE PROFIT 2: (104800.00)
LAST TARGET(103700.00)
STOP LOSS (107650.00)

BTCUSD looking for previous highAs BTCUSD failed to break significant support.
Plus at the support level price make clear rejection pattern.
So this can confirm that price highly potential to go previous high.
At smaller timeframe we can looking to make buy position

BTCUSD : HUGE FALL AHEAD ? Sell at 106200 or below
Stoplos : 113000
Target : 100000, 90000
BTCUSD struggling hard to make new highs. Retest of 90k level expected.

Bearish Money Flow looking for 101kPer 2hr chart I can see a bearish divergence as smart money is unloading. This is is a liquidity grab by the whales. I eventually see Bitcoin retracing back to 98k. I will layered my charts gradually for you to review... disclosure I do have a short position active.

Another crash?Crypto Market Crash: U.S.-Iran War Triggers Bitcoin Drop Below $101K and Sparks Panic selling, experts warn that this may just be the beginning.
While BTC’s price dropped to almost $98K, there was enough market response to support going back above that psychological six-figure mark by the day’s close.
However, the crypto market is extremely vulnerable to global flashpoints, especially when there’s potential for escalation,” said a senior analyst from CoinGape. “We’re now in a wait-and-watch phase, but if Iran retaliates or tensions spread, crypto markets could face another brutal leg down.
In the short term, the US involvement in the Israel-Iran conflict will result in a massive crypto market crash, as short sells would form. The Bitcoin price could drop nearly 10-20%, crashing altcoins and the rest of the market amid panic and risk-off sentiments.
Similar to recent reactions, the investors may shift to USD, gold, and safe-haven assets, worsening the crypto’s performance. While it’s a crash, the oil price would rise, and the Fed would delay the rate cuts, further impacting crypto valuations.
BTC is expected to retreat in the short term, focus on 104500📰 Impact of news:
1. The ceasefire agreement reached earlier did not take effect, and Trump believed that both sides violated the agreement
2. Federal Reserve Chairman Powell delivered a speech 3 hours later
📈 Market analysis:
I haven't updated BTC for a while. Today I want to share my views on BTC with you. BTC is currently encountering resistance and pressure at the 106,000 level and is beginning to retreat. From the technical indicators, MACD is in a dead cross, and RSI is retreating after reaching the overbought area. There is no problem with the short-term bearish trend, and it is expected that it will be able to retreat to the 104,500 level without much problem. However, the recent decline in the gold market, DXY market, and crude oil market may cause funds to flow into the BTC market.
🏅 Trading strategies:
SELL 106000-105500
TP 105000-104500
BUY 140500-103500
TP 105000-106000
If you agree with this view, or have a better idea, please leave a message in the comment area. I look forward to hearing different voices.

Market next target ⚠️ Disruption Analysis – BTC/USD
1. Questionable Bullish Bias
The chart labels the structure as "Bullish," but the current setup looks more like a potential distribution phase than a healthy continuation pattern.
The price is moving sideways with declining volume, suggesting buyers are losing strength.
2. Volume Discrepancy
Notice the spike in volume during the sharp move up, followed by flat candles and lower volume.
This is typical of a "pump and fade" structure, where large players exit after a rapid price move, leaving retail traders with poor entries.
3. Resistance Not Clearly Broken
Price failed to sustain above 105,800–106,000, indicating that the resistance zone remains valid.
The recent rejection candles near this level suggest sellers are active and overhead pressure is strong.
4. Descending Into Compression
The blue "descending" structure before the sideways move may signal a bearish flag or a pause before further downside—not necessarily a bullish sign.
5. False Reversal Warning
The bullish pattern drawn with zig-zags (implying consolidation before continuation) could actually be setting up a bull trap.
If price fakes a bounce and then breaks below 104,800, a sharper decline toward the 103,000 target could accelerate quickly.


#Bitcoin - Pivot Point is $107306.60 & Expecting 3000 Pts MoveDate: 16-06-2025
#Bitcoin Current Price: 107650
Pivot Point: 107306.60 Support: 106281.06 Resistance: 108337.05
#Bitcoin Upside Targets:
Target 1: 108804.75
Target 2: 109272.44
Target 3: 110009.63
Target 4: 110746.82
#Bitcoin Downside Targets:
Target 1: 105810.91
Target 2: 105340.76
Target 3: 104603.57
Target 4: 103866.38

CHECK BTCUSD SIGNAL READ CAPTAINbtcusd buy now ✅
entry point (105700.00) (105500.00)
TAKE PROFIT 1: (104850.00)
TAKE PROFIT 2: (104000.00)
LAST TARGET(103200.00)
STOP LOSS (106500.00)

Bitcoin - Looking To Buy Pullbacks In The Short TermM15 - Strong bullish move.
No opposite signs.
Currently it looks like a pullback is happening.
Expecting further continuation higher until the two Fibonacci support zones hold.
If you enjoy this idea, don’t forget to LIKE 👍, FOLLOW ✅, SHARE 🙌, and COMMENT ✍! Drop your thoughts and charts below to keep the discussion going. Your support helps keep this content free and reach more people! 🚀
--------------------------------------------------------------------------------------------------------------------

Short Setup on BitcoinA solid short setup has emerged on Bitcoin.Trend is bearish — price is trading below the moving averages.
The setup offers a favorable risk-to-reward ratio within the prevailing downtrend.
📝Trade Plan:
Entry: At current market price
Stop Loss: Above the resistance level at 107,145
Target: Price zone around 94,000–95,000

June 23 Bitcoin Bybit chart analysisHello
This is Bitcoin Guide.
If you "follow"
You can receive real-time movement paths and comment notifications on major sections.
If my analysis was helpful,
Please click the booster button at the bottom.
This is the Bitcoin 30-minute chart.
The Nasdaq seems to be rising without any problems,
but Bitcoin is under pressure from the MACD dead cross on the weekly chart as it has been adjusted strongly over the weekend.
Depending on the real-time situation, it seems advantageous to operate safely
short-term trading or both-way trading this week.
I created today's strategy based on the Nasdaq movement and the Tether dominance pattern.
*One-way long position strategy when the red finger moves
1. $100,587.9 long position entry section / hand drop when the purple support line is broken
2. $103,953.8 long position target price / Good 2nd target price thereafter
From the purple support line breakout, the weekly chart
candle low point created this week is broken, so it is better to maintain it without breaking out from the long position position.
If it breaks out, it can be pushed to the bottom -> 2nd section.
The 1st section marked in the middle
If it doesn't come down to the long entry point today
It is a vertical rise section
And the pink finger in the middle indicates the short-term target price -> additional long entry section
And the Gap8 section was created at the top due to last week's movement
I think it would be good to refer to it while trading.
Up to this point, I ask that you simply use my analysis for reference and use
I hope that you operate safely with principle trading and stop loss prices.
Thank you.

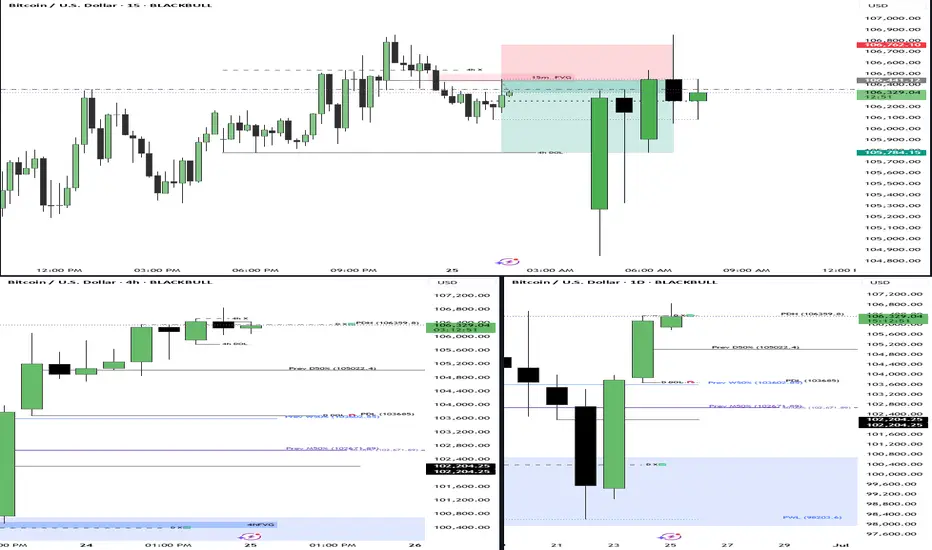
Bitcoin / U.S. Dollar 4-Hour Chart - June 24, 20254-hour chart displays the Bitcoin (BTC) to U.S. Dollar (USD) price movement, currently at $105,121.98, reflecting a decrease of $258.74 (-0.25%) as of 03:15:58. The chart highlights a recent downward trend with a potential support level around $103,509.67 and a resistance zone between $104,651.27 and $107,154.41, indicated by shaded areas. The time frame spans from June 6 to June 25, 2025.

BTC/USD 15M CHART PATTERNYou're sharing a short trade setup for BTC/USD on the 15-minute timeframe. Here's a breakdown of your trade plan:
---
📉 Sell Entry
Entry Price: 104800
---
🎯 Take-Profit Targets
TP1: 103400
TP2: 102100
TP3: 100428
---
🛑 Stop Loss
SL: 107100
---
⚖ Risk-Reward Overview
Here’s a rough idea of the risk-to-reward ratio for each target:
1. TP1:
Risk: 107100 - 104800 = 2300
Reward: 104800 - 103400 = 1400
RR ≈ 0.61:1
2. TP2:
Reward: 104800 - 102100 = 2700
RR ≈ 1.17:1
3. TP3:
Reward: 104800 - 100428 = 4372
RR ≈ 1.9:1
---
⚠ Notes
SL is relatively wide (2.2%) — make sure position sizing reflects that.
Targeting a full retracement down to ~100K area suggests high confidence in a local top or rejection zone.
---
Would you like:
A chart visualized for this setup?
Help converting this to a trading script or bot?
Backtest ideas for this strategy?
Let me know how you'd like to proceed.

USD Index (DXY) Bullish Reversal & Breakout PotentialThe DXY chart displays a strong bullish reversal structure from the support zone near the 99,800–100,200 area. Here’s a professional breakdown of the technical setup:
🔍 Key Observations:
🟢 Bullish Reversal Formation
The price rebounded aggressively from a strong demand zone (support), marked by a green arrow and orange highlight.
Multiple historical reaction zones confirm this level's validity as a reliable support.
📉 Previous Decline & Correction
After reaching the resistance area near 110.400, the price corrected with a bearish channel.
This pullback formed a classic bull flag, a bullish continuation pattern, eventually leading to the current breakout.
🟦 Current Price Action
The market has broken out of the recent downtrend and is forming higher highs and higher lows.
A strong bullish impulse candle confirms renewed buying interest.
🧱 Support & Resistance Levels:
🔵 Resistance Zone (Target): 110.409 — a historically respected area and target for the bullish move.
🟣 Current Support Zone: 105.061 — previously resistance, now likely to act as support after the breakout.
🎯 Bullish Target Projection
If price retests and holds the support at 105.061, the next potential leg can extend towards 110.409, offering a strong risk-to-reward setup.
⚠️ Caution
Watch for a pullback and retest near the support level.
A failure to hold above 105.061 could invalidate the bullish structure.
🧠 Conclusion
The DXY is showing a bullish trend continuation after a breakout from a corrective structure. A successful retest of support could propel price towards the 110.400 target zone 📊.
Bias: ✅ Bullish above 105.061
Invalidation: ❌ Below 105.000


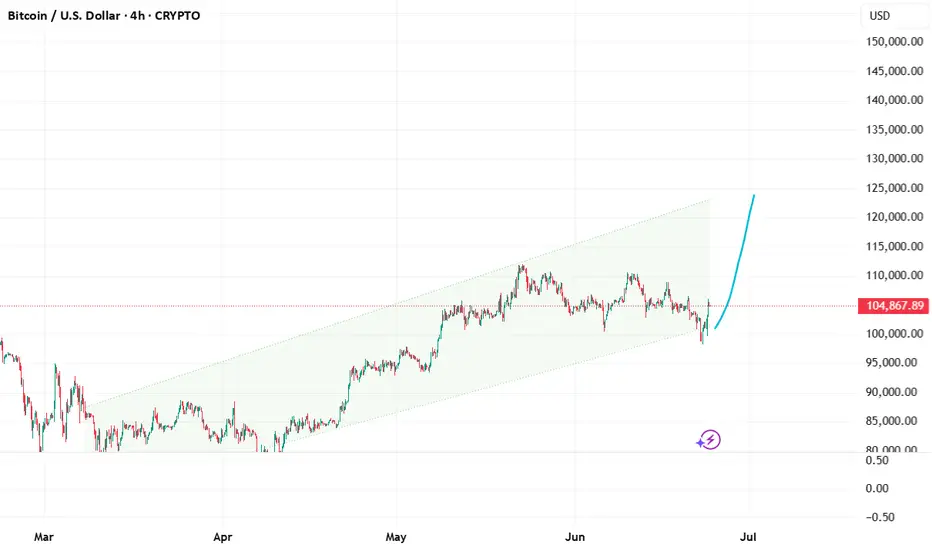
Bitcoin uptrend beginning?Bitcoin is experiencing a bounce from an important support level. If this level holds, can we see 130k?
A pull back from here to a minor support level at 103.400k is an important replacement level.
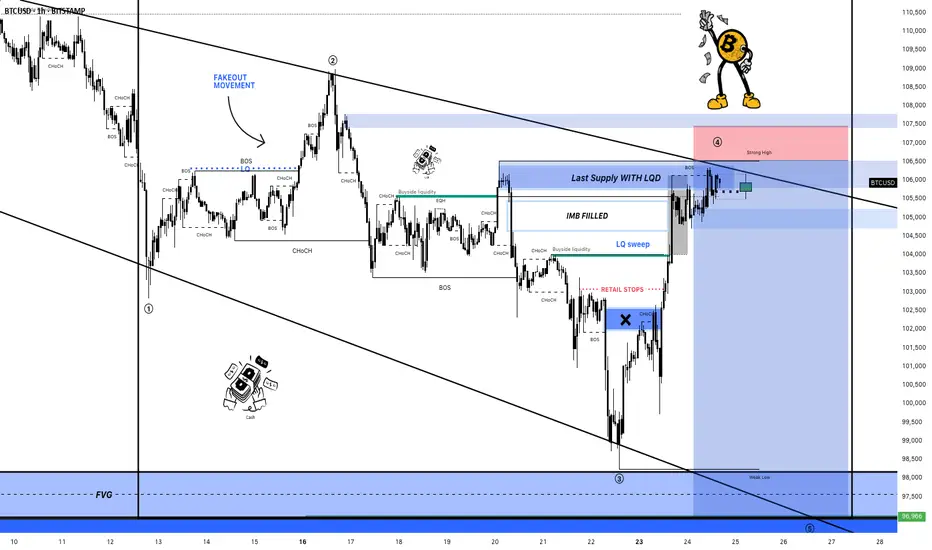
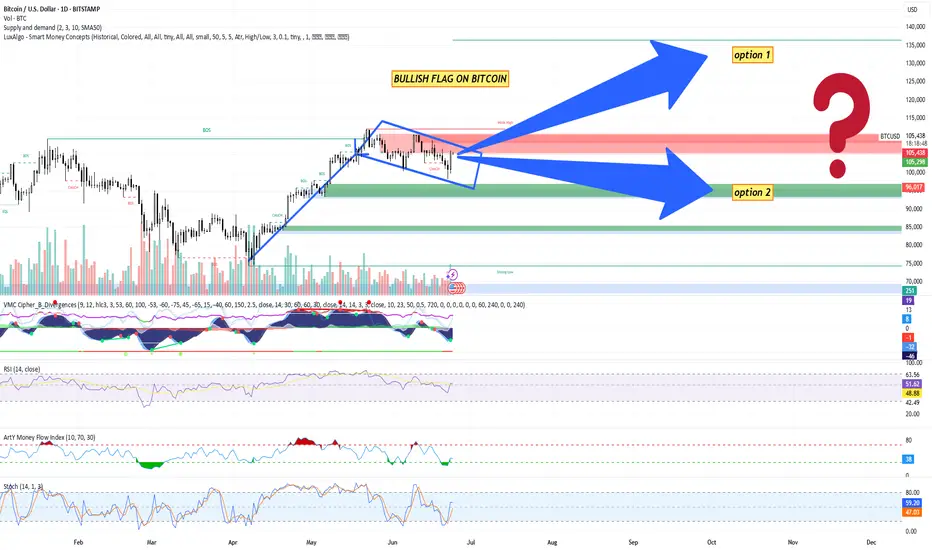
Bitcoin (BTC/USD) Technical Analysis + trade planBitcoin (BTC/USD) Technical Analysis – June 24, 2025
Pattern Identified: Bullish Flag Formation
A clear upward impulse leg followed by a downward-sloping consolidation (flag) indicates a continuation pattern.
The flag is bounded within a descending parallel channel, suggesting a potential breakout to the upside.
Break of Structure (BOS): Multiple BOS signals indicate strong market structure shifts favoring bullish continuation.
Change of Character (CHOCH): Minor CHOCH noted inside the flag, indicating local liquidity grabs but no trend reversal yet.
Key Levels
Current Price: ~$105,126
Flag Resistance: ~$105,291 (watch for breakout)
Major Supply Zone (Resistance): ~$115,000 (red zone)
Demand Zones (Supports):
$96,000 (minor)
$85,000 (medium strength)
$75,000 - $70,000 (strong low / high-confluence area)
Volume Analysis
Declining volume during flag formation supports the bullish flag hypothesis (low-volume pullback).
Anticipate increased volume on breakout for confirmation.
Indicators Summary
1. VMC Cipher B
Green dots signal potential local bottoms.
Wave trends support bullish reversal setup, though momentum still neutral.
2. RSI (14)
Current RSI: ~50.76
Neutral zone; not overbought/oversold – provides room for upside movement.
3. Money Flow Index (Art’y)
Positive inflow recovering, signaling accumulation phase.
4. Stochastic RSI
Blue line crossing above orange around 46. Indicates bullish crossover from the oversold region – early entry signal.
Bitcoin Trading Plan
Trading Bias: Bullish (Contingent on Flag Breakout)
Entry Plan
Breakout Entry: Enter long above $105,300 with confirmation (4H or daily candle close).
Aggressive Entry: Pre-breakout entry inside the flag at ~$104,000–$105,000, anticipating breakout.
Stop Loss
Conservative: Below $96,000 (below key support + 50 SMA).
Aggressive: Below $102,500 (inside flag, tighter stop).
Take Profit Levels
TP1: $110,000 (local high)
TP2: $115,000 (strong resistance zone)
TP3: $123,000–$125,000 (measured move from flag breakout target)
Measured Move Target: Height of the pole ($25K) added to the breakout zone ($105K) = Target zone: $130,000 (theoretical).
Alternative Scenario – Bearish Breakdown
If BTC breaks below $96,000, the bullish structure is invalidated.
In that case:
Look for short entries below $95,500.
Target zone: $85,000 – $75,000.
SL above $98,000.
Risk Management Guidelines
Risk per trade: 1–2% of capital
Use position sizing tools to determine trade size.
Monitor macroeconomic news (Fed, inflation, ETF flows) and crypto market sentiment.
To sum up things:
BTC is consolidating within a textbook bullish flag.
Momentum indicators align with a potential breakout.
Caution warranted until clear breakout occurs – volume confirmation is key.
Keep alert for fakeouts due to low summer volatility.
BTCUSD Short (Yesterday)I missed this one yesterday - BTC is now net short on the regression break. It bounced hard on the Iran/Israel news but is currently still short.
